A redevelopment project planned for Rhode Island Avenue Metro station, one of the largest such projects in the District, could bring $2.3M per year in new fare revenue for Metrorail.
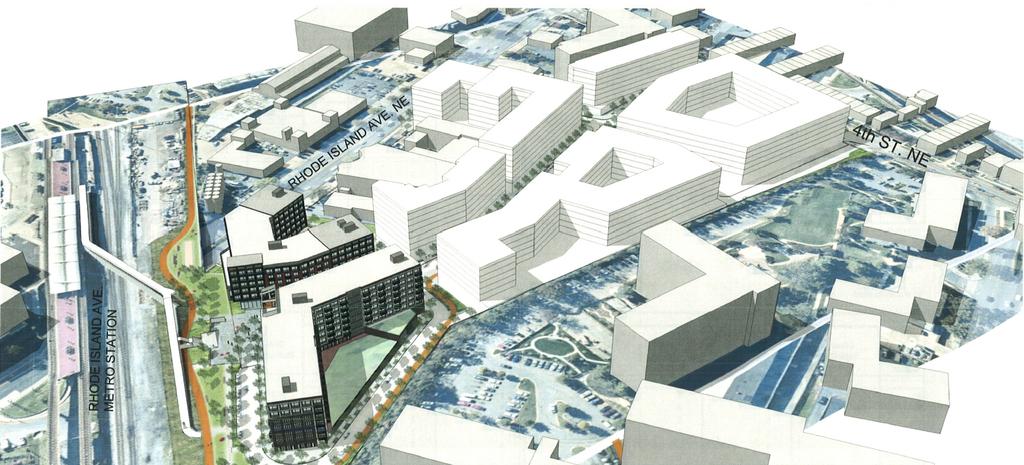
A venture led by MRP Realty is proposing a mega project near the Rhode Island Avenue metro station, which when constructed would add over 1,500 residential units and retail to that transit-oriented community. That’s fantastic news for the District, which needs household growth to resolve its structural fiscal deficit, and also for Metro and the region, which benefits each time we add transit-oriented development that drives ridership and revenue.
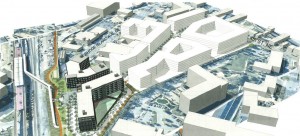
Image Courtesy MRP Realty
At Metro we find this especially exciting because it is yet another example of how changes in development are in part fueling a ridership resurgence. Our Land Use-Ridership model conservatively suggests that this project will yield an additional 3,200 rail entries per day systemwide, generating rail fare revenues of around $2.3 million per year. Whether this ridership actually materializes – or is even higher – depends on the developer building good pedestrian connections to the Metro station and the Met Branch Trail.
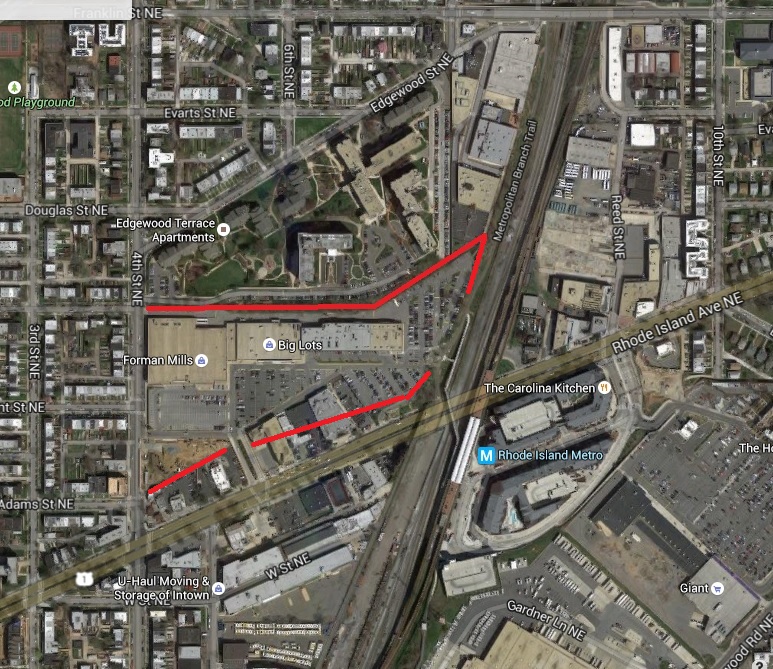
In addition, this project could be a good opportunity to create a pedestrian connection between the station and the neighborhoods to the north, where potential Metrorail riders are blocked from the station’s “walk shed” today. The current conditions include a challenging combination of grade changes and physical barriers behind the shopping mall, creating pedestrian barriers outlined in red below. The key question will be whether the development will help fix the barrier along the north side of the site, which would only increase the ridership- and revenue-generating potential of this project.
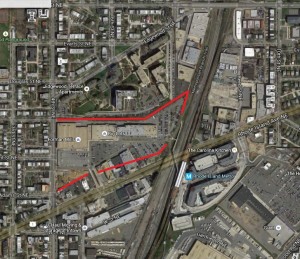
Pedestrian barriers in red. Image courtesy Google Maps
The property tax benefits of the project all accrue to the District, and the increased revenue to WMATA doesn’t come for free – the system will need to handle the additional passengers and incur additional operating costs and potential wear and tear on the system. Right now there isn’t a defined mechanism for WMATA to recoup the value of real estate property taxes to fund capital renewal or expansion. But certainly anything that contributes to the operating health of the transit agency through increased ridership and revenues goes a long way to promoting financial stability for the Authority, as well as lowering the operating subsidy burden it requires to run the system.


Recent Comments