
Monitoring (and Caring About) Customers, Not Just Trips
Deep explorations into the composition of Metrorail’s customer base shows that Metro has a wide reach – and that the five-day-a-week rider may not be as common as you think.
Metro (bus and rail) moves 1.1 million people per day, right? Well, technically we see that many trips (transactions) per day, but how many individual customers is that? When you look at your fellow passengers on-board a train, how many are frequent commuters? How many rarely ride? In addition to counting trips, we’ve begun to monitor customers – the number of unique SmarTrip cards and paper tickets used on the system in a month.
We’re starting with Metrorail at first.
Metrorail typically handles roughly 730,000 trips on a weekday, which are generated by about 400,000 unique customers. Some of those customers ride frequently, and others will ride only once in the month. As the chart below shows, of the 730,000 trips, only about two-thirds are generated by frequent customers. Not surprisingly, frequent customers dominate more during the peak times.
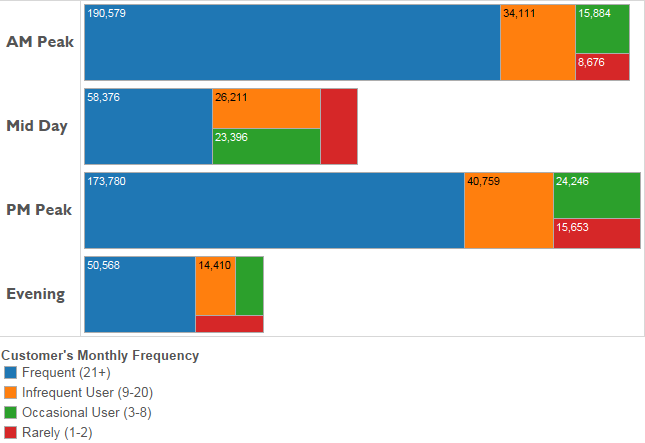
Typical weekday rail ridership (trips) by customer’s monthly frequency (trips/month)
Surprisingly, over 17% of all trips are generated by customers who take eight trips/month or fewer– that’s fewer than once per week. That may not seem like much, but in order for infrequent customers to generate so much of our ridership each and every day, there must be a LOT of them!
Indeed, if we look over the course of an entire month, Metrorail’s customer base is dominated by infrequent customers, because each day they turn over more quickly:
- In February, customers riding once a week or less were 73% of this month’s customer base, but generated 21% of all ridership.
- On the flip side, a core group of about 250,000 frequent customers (21+ trips/month) represented 16% of the month’s customer base, but generated 60% of the ridership.
- Metrorail recorded just under 14 million trips in February, from a base of around 1.6 million customers.
Annual Trends. It’s also interesting to see how our customer base changes over the course of a year, and by SmarTrip card versus paper ticket. Here’s a look over recent months:

Trends in Size of Metrorail’s Customer Base (customers, not trips), by Month and Fare Media Type
While the SmarTrip customer base remains mostly steady throughout the year, the paper ticket customer base fluctuates significantly with seasonal tourism – spiking in April, July, and August, and bottoming out in January and February.
We can also see the general decline of paper tickets as SmarTrip vending machines have become more accessible and as customers respond to the surcharge for paper tickets. But although paper is now well below 10% of all trips, paper customers still represent about 30% of our customer base. Some of the size of paper tickets’ customer base is likely due to customers using multiple paper tickets in a month.
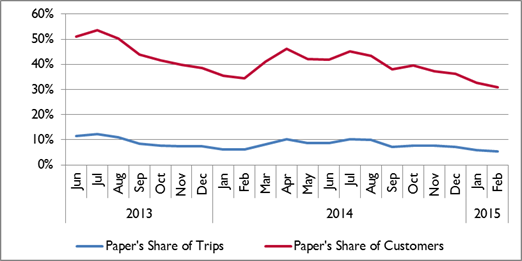
Paper tickets’ share of customer base vs. trips
Why Monitor Ridership This Way? Because it helps us better understand our entire pool of customers (not just a single snapshot) and how our customers – and the residents of the Metro area – interact with the service we are selling. We continue to mine this kind of longitudinal data to help explain changes in ridership (like customers who use SmartBenefits “never” vs. “sometimes” vs. “always”), and guide our strategies for fares and ridership in the future. This metric differs from ridership in important ways. For example, this month on Metrorail, ridership was up, but the customer base was down – perhaps due to the decline in weekend usage, or the shift away from paper tickets.
Next, we will begin looking at the customer base of Metrobus, and combining the two to understand the integration (or separation!) of our bus and rail markets.
What do you think? What do you see here that we should be looking at?

I’d like to see a similar analysis for Metrobus. The biggest surprise of this Metrorail analysis is the still high proportion of cash riders on a daily basis – 8% is too big to write off to escape the costs of handling cash.
@Steve Yaffe
Thanks Steve, we are working to expand this to all modes, including parking too. This post talks about paper tickets vs. SmarTrip, without really saying much about cash. Riders can always load cash onto either one!