Metro’s planners provide tips on avoiding crowds this Cherry Blossom season.
After this long and trying Washington winter, locals and visitors alike are marking their calendars for the 2015 Cherry Blossom Festival. While everyone knows that Metro is the best way to reach the blossoms, PlanItMetro has been digging into the data to help you minimize the crowd crush and maximize your enjoyment of this treasured DC celebration.
What happens to Metro ridership? As we showed last year, the Cherry Blossoms always bring a major bump to Metrorail ridership, especially on weekends and at Smithsonian station. Metro is ready for the increased demand: track work is cancelled, service levels are increased, and our customer ambassadors are out in the field to help with the needs of visitors. So how do savvy Washingtonians avoid the thickest crowds?
Tip #1: Avoid Smithsonian station

On weekends during Cherry Blossoms, the number of customers exiting Metro at Smithsonian dwarfs every other station during daylight hours
Read more…
Station-area walkability is one of the most potent congestion-busting tools in the planner’s bag of tricks. Now we’ve mapped out in detail which stations are living up to their full potential – and where we need to redouble our efforts.
We’ve brought to you information about the power of station area walkability. Not only does better station access give mobility benefits to those who most need it, but it also boosts ridership and revenue and therefore lowers Metrorail’s operating subsidy. That means lower taxes for you and me.
Metro’s Office of Planning is wiring the science of walkability into WMATA’s Key Performance Indicators. We are committed to working with our partner jurisdictions to improving station area access and identifying the near-term and low-cost improvements that have big returns for ridership and revenue. And we have been working diligently to develop a comprehensive geodatabase of walk sheds and the land uses – existing, planned, and proposed – located within them.

Example walk shed, extracted from the Walk Shed Atlas.
We’re also happy to release for the first time a comprehensive atlas of Metrorail walk sheds that includes some of the data that the Office of Planning uses to calculate ridership potential and evaluate investment needs. You’ll notice that each station area has a unique “footprint” and that in almost every case, the walkshed footprint is related to the overall performance of the station (as defined by all-day boardings).
A few notes here: Read more…
Ridership on the X2 Metrobus line has jumped 14% after Metro changed the way the line is managed.
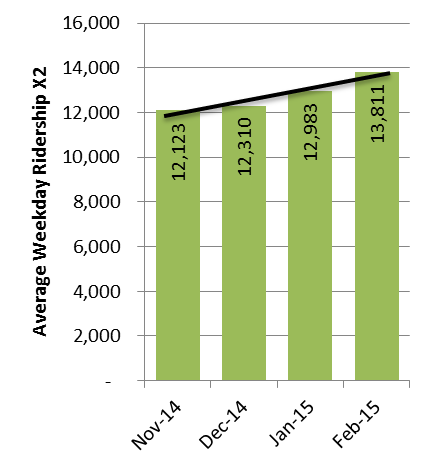
The X2 bus on the busy H Street/Benning Road corridor has always been one of Metro’s busiest routes at over 13,000 riders per day. (If the X2 were a Metrorail station, it’d rank just above Silver Spring and just below Rosslyn!)
Through most of 2014, the X2’s on-time performance (OTP) averaged about 65% – well below Metro’s goal. Insufficient running time in the schedule, and disruptions from planned and unplanned detours along the route created uneven spacing between buses leading to “bus bunching” and long gaps between buses. These service gaps often led to significant overcrowding, particularly during the midday period.
So to improve reliability, we made some changes in December 2014:
- To meet demand, we increased the frequency of buses to an even 8 minutes all day long – 6:00am-7:00pm on weekdays.
- We deployed a team of dedicated supervisors on the street (at Minnesota Avenue and Lafayette Square) and at the Bus Operations Control Center to ensure even spacing between buses on weekdays. The X2 is now a “headway-managed” route on weekdays, meaning our primary goal is to maintain buses evenly every 8 minutes throughout the day.
- We adjusted the scheduled running times by about 15% for all trips.
The results have been impressive: ridership has jumped 14% from 12,700/day in October 2014 to 13,800 in February, overcrowding (particularly during the midday) has been virtually eliminated, and on-time performance has grown to 83% – a remarkable achievement for a heavily congested urban corridor.
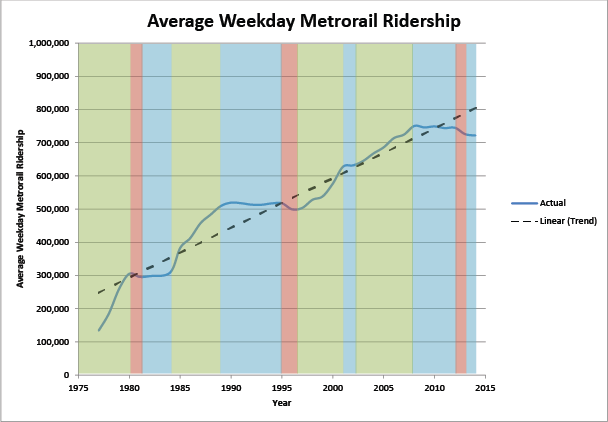
Historical data and regional growth projections tell us one thing – Metrorail ridership will rebound and grow right along with the region, and the system better be ready to carry the load.
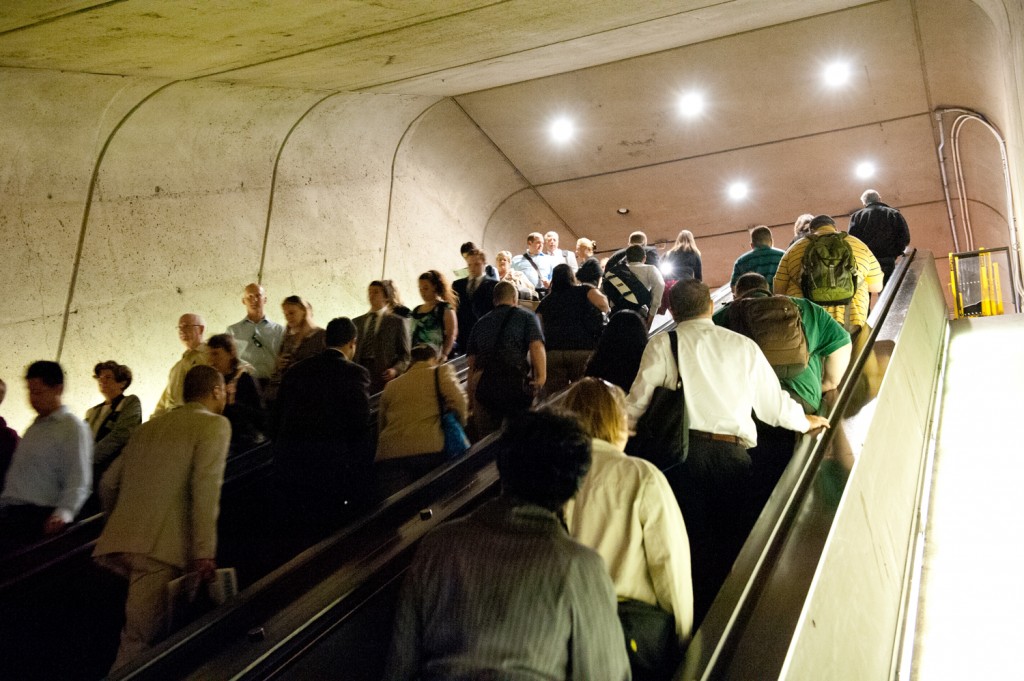
Metrorail riders enter and exit Crystal City during the AM rush hour, June 2012.
Local ridership trends that seem to defy a national boom in public transit usage give some pause about the need for planned transit expansion projects. It’s no surprise that even the most ardent of transit supporters might be caught flat-footed when trying to defend infrastructure investments against the backdrop of scarce funding. Some have even gone so far as to question whether Metorail ridership, which just a few years ago looked poised to eclipse 800 thousand trips per average weekday, is experiencing more of a structural downshifting and may experience flat or even declining ridership for the foreseeable future.
All of this debate is understandable in a town obsessed with statistics and “horse race” leaderboards. But when it comes to economics, demographics, mobility, and infrastructure, regional leaders need to look beyond the numbers d’jour and bet on a sure thing – Metro ridership will go up. Here’s why:
1. Short-term snapshots of rail ridership miss the forest for the trees. Or maybe even just leaves.
The graph below shows Metrorail average weekday ridership from the beginning of Metrorail. You can see that ridership grew in the first five years as the system grew from just the Red Line and four stops in 1976 to adding Orange and Blue Lines in operation by 1980. And after all of that expansion was completed, something fascinating took place – ridership declined and essentially flatlined until 1985. During that time, the region didn’t stop investing in Metro. On the contrary, during that same time period Metro built the Yellow Line and extended the Red Line from Downtown into Upper NW DC and then all the way to Shady Grove. Ridership shot up again in the late 1980s while Metro extended the Orange Line to Vienna and the Red Line to Wheaton then flat-lined and even declined through the mid 1990s, all while Metrorail added capacity on Yellow and Blue and (finally) opened up the Green Line. From 1997 through the late 2000s Metrorail saw robust ridership increases despite minimal capacity increases – largely reflective of the underlying economic and demographic resurgence of the central city and its urbane suburbs – and ridership flat-lined in tandem largely with the economic collapse of 2008 and the prolonged Great Recession.
Read more…


Recent Comments