Regional Patterns in TOD Demand
The Washington, D.C. MSA added 275,000 households and 295,000 jobs between 2004 and 2010. Of that growth, 6.4% of these households and 13.8% of these jobs located within one-half mile of suburban and one quarter-mile of urban Metro station[1]. This is despite the fact that the land area around these Metro stations comprised only 0.5% of the MSA land area, and suggests that TOD locations in the region are capturing 2.76 times their “fair share” of growth when normalizing for land area.
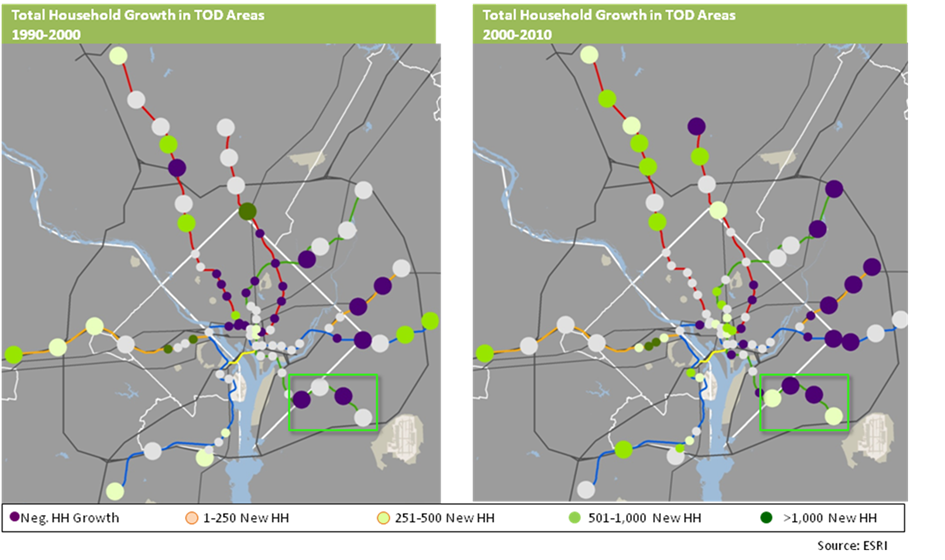
- Household growth patterns from 2000 to 2010 illustrate that the number of households around almost all of the Metro stations grew, and Metro-proximate households grew at a faster rate than the MSA as a whole. While the Washington D.C. MSA grew by 1.4% from 2000 to 2010, the number of households around Metro stations grew by 4.8% annually.
- Employment growth patterns show that employment growth in suburban areas of the MSA has been most pronounced around Metro stations, with office-using employment demonstrating a particularly strong inclination to locate near Metro. From 2000-2010, 12% of MSA office employment growth located near transit, and three sectors:Computer systems design and related services; Management, Scientific and Technical Consulting Services; and Other Professional, Scientific and Technical Services represented 41% of office-using employment growth in metro station areas.
This capture rate is a sharp departure from historical growth trends in the region. Until the 2000s, growth in households and employment had emanated due west from the epicenter of Washington, D.C., and some would argue that outside of growth adjacent to Metro Stations in the historical path of growth – which could arguably include the Rosslyn-Ballston corridor – growth was largely agnostic to transit proximity.
What is driving these shifts? At least two factors:
- Regional and national trends indicate that much of the housing growth through 2030 will come from younger, smaller households that are increasingly choosing higher density homes in transit-accessible, infill locations with easy access to employment and entertainment. Over 67% of the household growth during the 1985-2000 time period had been comprised of one- and two-person households, and the Census projects that upwards of 85% of the future household growth will be comprised of these “smaller” household types. These households have a built-in demand for walkable, urbane environs that offer multiple opportunities for unplanned human interaction and what Bob Putnam calls “social capital”. Almost half of all housing consumers express a desire to live in a walkable community, as evidenced by data compiled by the National Association of REALTORS ® in 2004 and again in 2011.
- Employers seeking competitive advantages in an increasingly-tight market for high-quality labor are returning to urban locations – where their employees want to be – in order to increase retention and attraction prospects. In addition, research conducted by the Brookings Institution confirms that urbane, walkable communities exhibit calculable and significant value premiums that drive net operating income and asset-level value for developers and investors.
[1] Urban Metro stations include all D.C stations, plus the Rosslyn-Ballston Corridor, Alexandria, and Braddock Road and Pentagon City. All other Metro stations are classified as suburban.


Recent Comments