Archive for December, 2012

Metrobus Market Effectiveness Study Under Way
December 21st, 2012 4 comments

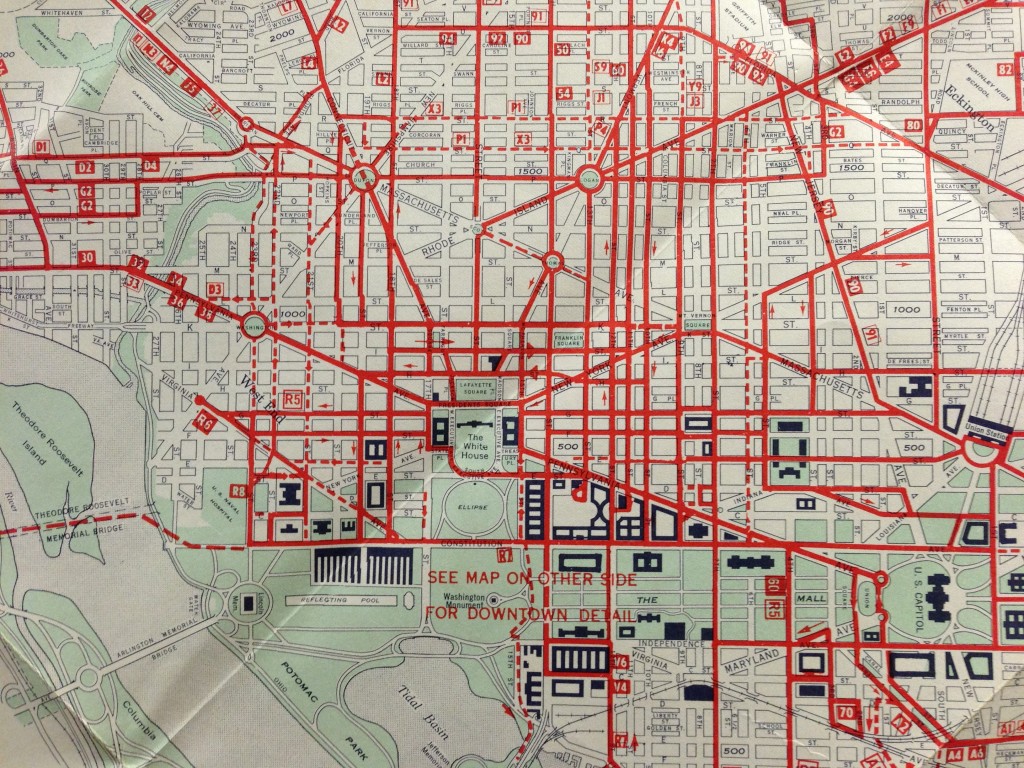
Photo of a 1969 1968 map of DC Transit System Inc routes. Many routes listed here are still running today.

WMATA bus began operations in 1973, when it consolidated the four Washington-region bus operators under one system and brand.  As many commented in MindMixer, many of these lines were originally streetcar lines established in the late 19th century and majority of services were based in the inner areas.

The inclusion of old streetcar lines in the current Metrobus network informs a rich history about natural progression of transit network and the interaction between urban development and transit investment.  The century-old streetcar investment  helped develop those areas and transform them into transit-friendly markets. In return, these areas and corridors are among the most transit supportive markets today, generating high bus ridership.

Over the past 30 years, strong growth in jobs, population and urban development in the DC region continued to demand the expansion of bus transit service from the central core to suburbs, from traditional activity centers and corridors to the new or emerging local centers and corridors, some of which are near or beyond the edge of Metrobus market.  Metro currently operates nearly 300 revenue bus routes organized into approximately 150 lines throughout the jurisdictions in the Metro compact area.

To better understand how the current Metrobus system serves travel needs in the DC region, Metro’s planners are conducting the Metrobus Market Effectiveness Study to identify market constraints and opportunities for Metrobus, and most importantly, strategically position Metrobus toward building an effective network that can better serve current and future demand, enhance productivity and efficiency, and improve integration between Metrobus and local services.



Categories: Planning Studies Tags:

Chart of the Week: “Hotspots” for Pedestrian and Bike Access to Rail Stations

December 17th, 2012 11 comments

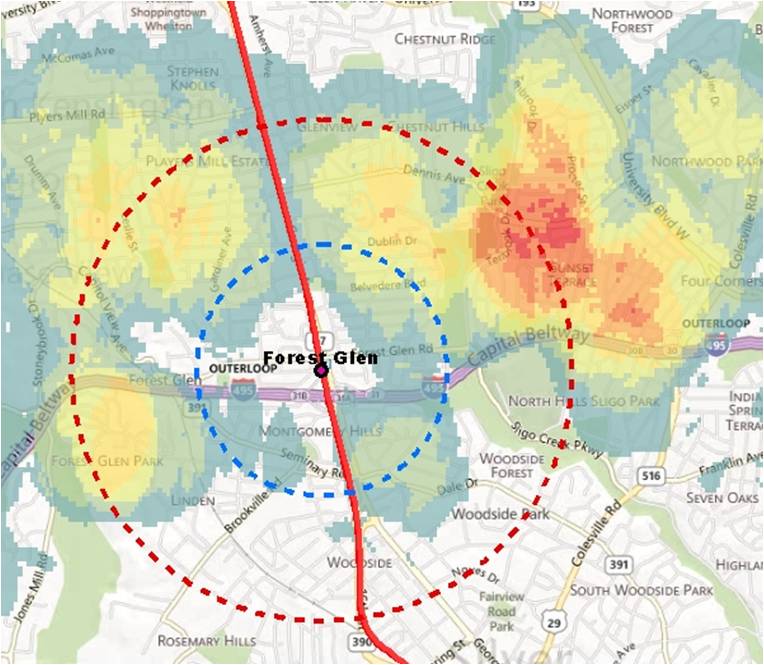
Heat map showing short-distance parking access at Forest Glen station, which indicates good opportunities for pedestrian and bicycle access (click for full map)

In our effort to improve safety, access and sustainability, Metro is expanding our understanding of bike and pedestrian barriers faced in commuting to our Metrorail stations. Over the past several years, we have focused our bike and pedestrian project planning and implementation efforts on improvements we can make to our station areas such as, installing bike racks or constructing pedestrian improvements. Now, we’d like to expand the envelope and develop a list of access needs beyond our own boundaries and work with our jurisdictional partners to make needed improvements.

One way we are doing this is by gaining a better understanding of where auto commuters come from when they drive to our stations, and zeroing in on areas where we see a good deal of auto access to determine if there are barriers to walking or biking to the station.

The map at right (full version) shows auto-to-station “hot spots” around the Forest Glen station, to pick one example, locations from which clusters of customers drive and park at Metro. According to the 2007 Metrorail Passenger Survey data, many customers drive from within a 1-3 mile radius; some are even closer. So why are so many people from this area driving? In our 2010 Bicycle and Pedestrian Master Plan, we teased out some of the more broad-based reasons why people drive rather than walk or bike – now we’d like to explore each station’s local conditions and see what can be done to improve walk and bike access.

The Forest Glen station is located north of the Capital Beltway and west of Georgia Avenue. More commuters to Forest Glen are from north of the Beltway and east of Georgia Avenue. There is pedestrian overpass over the Capital Beltway which helps facilitate foot traffic:  Is crossing Georgia Ave then a barrier?  There are four Metro rail stations located within a 2-mile radius of Forest Glen which draw away commuters farther from the station. This could help to explain the highly localized nature of the parking shed.

There are many factors not considered here such as demographics, bus usage, and average driving trends. Further research into parking and commuting trends is in the works.

If you commute from this area, can you comment about what you experience on your commute? Do you drive?  If so, what factors influence you to drive instead of walk or bike? Would you like to walk or bike, but the infrastructure isn’t there or the traffic is too daunting? Or do you see something else from this data? We want to hear from you and appreciate any feedback you have that can make our system more accessible to pedestrians and cyclists.

Metrobus Testing Bike Racks with Space For 3 Bikes

December 13th, 2012 5 comments

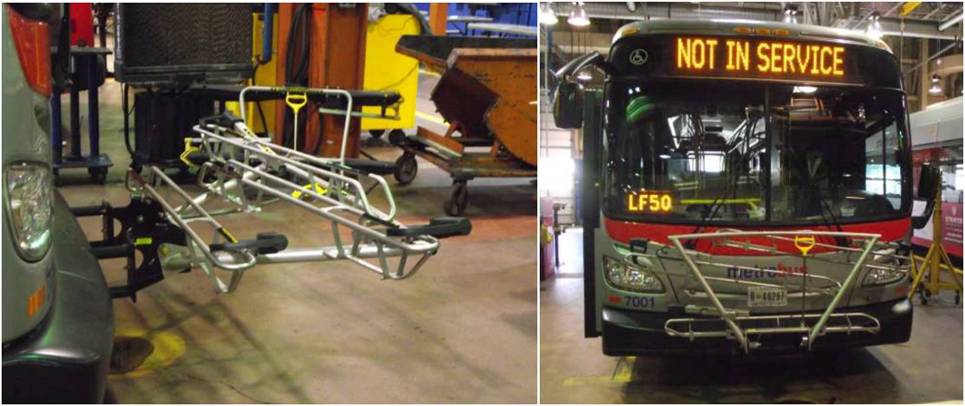
Every Metrobus has a bike rack on the front of the bus with room for two bikes. But if you ride the F12 or F13 bus routes around the Cheverly and Landover areas, you may have noticed a different kind of rack on one of our buses – with space for three bikes, not two.  Our Bus group is testing out this new style of rack on one bus operating on the F12 and F13 routes to see how it works. The instructions for using this test rack are the same as the standard racks.

Have you seen or tried this rack? Did you try the middle or back-most rack? What do you think?

Let us know in the comments below.

Metro is testing a new style of bicycle rack on buses with space for 3 bikes.All Metrobuses currently have racks for 2 bikes.


Bikes are allowed on Metrobus at all times, even during peak times. Unsure about how they work? See instructions for how to use the standard racks.

Categories: Planning Studies Tags: ,

Chart of the Week: Updated Visualization of Metro and Circulator

December 11th, 2012 Comments off

A few weeks ago we posted a video visualization of one day’s worth of Metrorail, Metrobus and Circulator created by STLTransit.  Upon first seeing this video, contacted them to thank them for their work and also asked whether the Metrorail could be made to stand out more in the video, to differentiate it from Metrobus and Circulator.  This morning, I received a link the updated video embedded below, a great improvement.  Metrorail trains are now shown as “tadpoles” instead of dots, which allows them to be more visible and better represents the carrying capacity of a train (800+ people) versus a bus (60+).  Check it out.

It looks best in HD mode full-screen.

L’Enfant Plaza Station Capacity Improvements Study

December 6th, 2012 Comments off

The L’Enfant Plaza Station is one of busiest stations in the Metrorail system and handles thousands of passenger transfers on four of the five Metrorail lines.  It ranks third among all stations in absolute ridership growth over the last five years.

Earlier this year, Metro initiated a station capacity improvements study, similar to previous studies that evaluated the feasibility of station access and capacity improvements and station circulation enhancements at Gallery Pl-Chinatown and Union Stations.  The purpose of this study is to identify and address the physical and operational internal capacity constraints of L’Enfant Plaza Station.  Both short-term and long-term capacity enhancement solutions will be sought with operational improvements and constructability in mind.

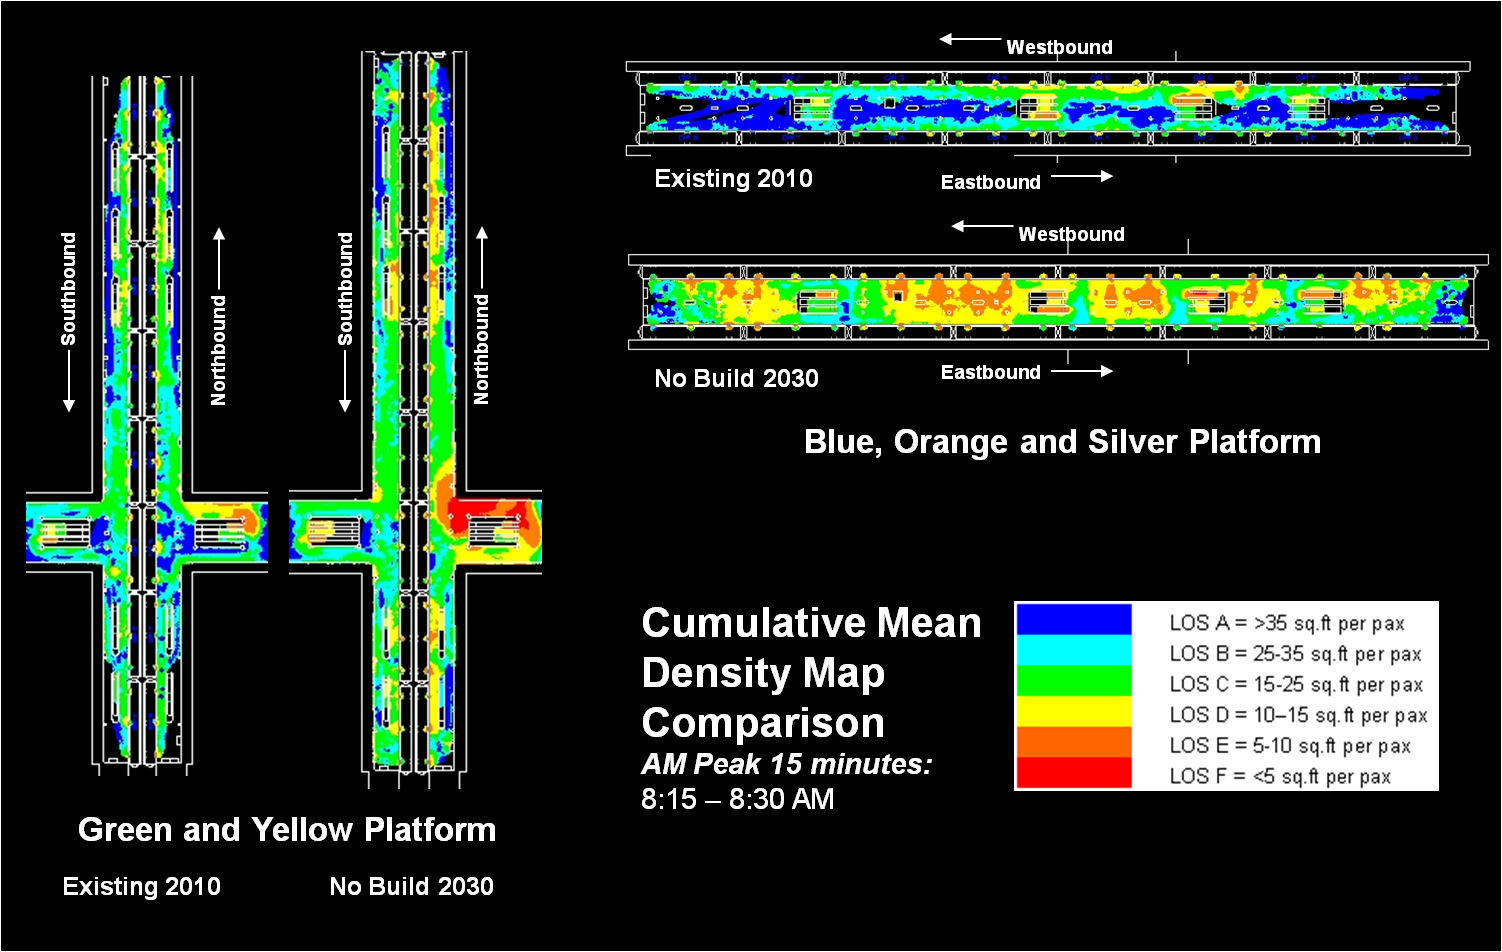
Current and Future “Hot-Spots” at L’Enfant Plaza Station Platforms during the AM Peak

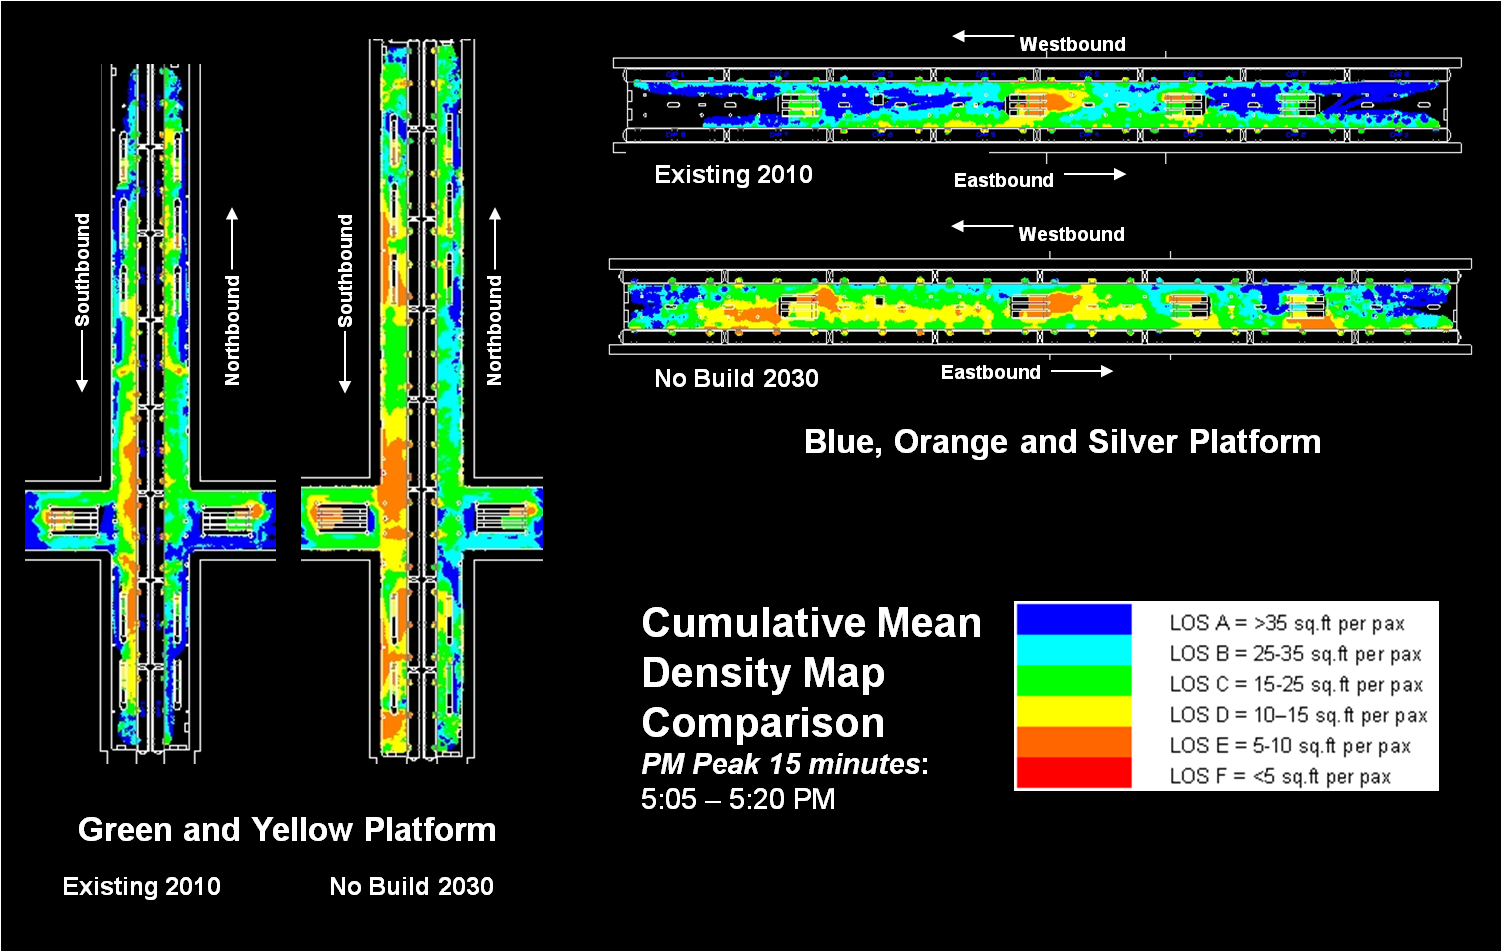
In order to assess the current and future conditions within L’Enfant station, Metro has used a pedestrian simulation tool that enables the quantification of crowded conditions.  The maps included here show existing and future condition profiles of the upper and lower level platforms within the station.  Future conditions were estimated using MWCOG/TPB travel demand model, Metrorail ridership growth forecasts and Metro origin-destination data sources.  Cumulative mean density maps help to identify “hot-spots” within the station – areas where high levels of crowding are sustained.

Analysis of current pedestrian activity during the AM peak 15-minute interval showed that the station currently operates at safe levels on both platforms in the morning peak hour, and identified a large volume of transfers between the northbound upper platform where Green and Yellow lines run and the westbound lower platform where Orange and Blue lines operate.   By year 2030, however, these conditions are expected to worsen with growth of transfers.  The levels of crowding in the transfer areas leading to the lower platform intensify due to increased passenger flows and space restrictions adjacent to escalators.  Also, high passenger densities are shown to occur at the westbound Orange and Blue platform during the morning rush hours.

A reversed pattern of crowding is shown between the eastbound lower platform and the southbound upper platform for the returning passengers during the PM peak 15-minute interval.  As expected, conditions worsen with increased passenger flows and transfer activity forecast for 2030 on the southbound upper platform.

Current and Future “Hot-Spots” at L’Enfant Plaza Station Platforms during the PM Peak

Given the existing and future “no-build” scenarios presented here, Metro is currently working to develop short and long-term design alternatives for detailed evaluation.  Stay posted for additional simulation and conceptual design results as they become available.

Chart of the Week: Metro Key to Region’s Growth

December 3rd, 2012 Comments off

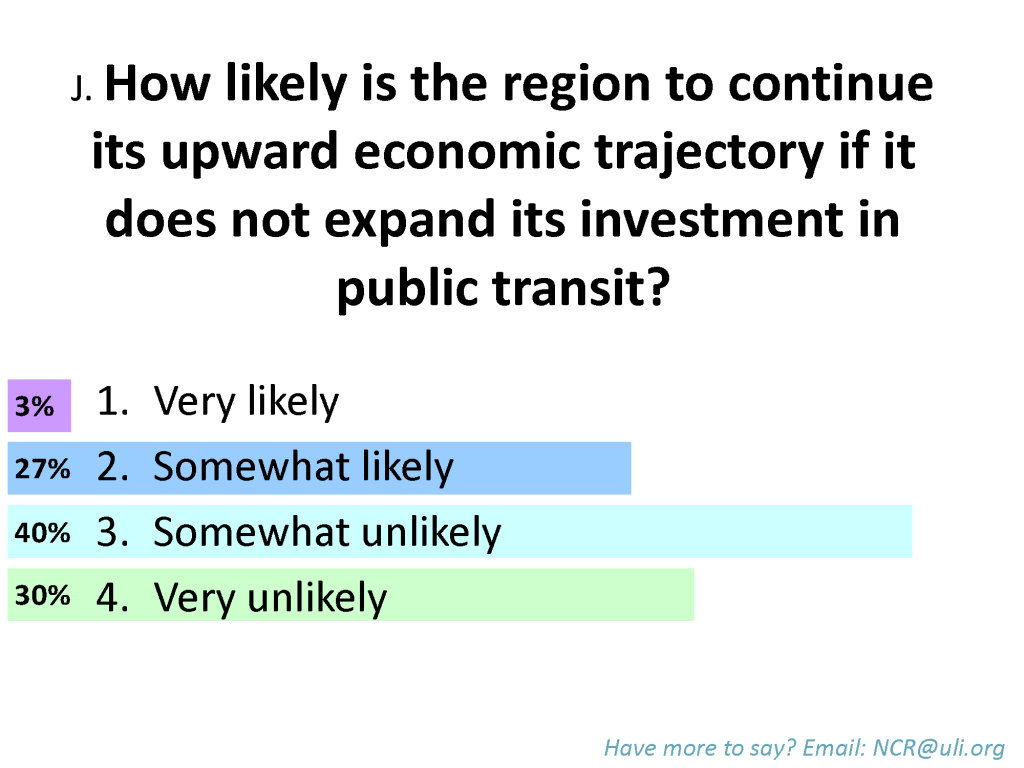
70% of the participants felt that expanded investment in public transit is key to continued economic growth in the Washington region.

Over the past decade there have been many significant efforts to promote regionalism in the National Capital region.Endeavors including Reality Check, COG’s Region Forward and the work of the 2030 group, have envisioned a region that is more accessible, prosperous, sustainable and livable.

Building on these plans and visions, on November 13th, ULI Washington hosted “Regional Leadership: Vision to Action,” an invitation-only event for the region’s leaders in business, land-use and real estate. The purpose of the event was to examine regional strategies for improving economic development and quality of life in the National Capital Region. A report summarizing the content of the event is being developed by ULI Washington and will be published in December 2012 at www.washington.uli.org. Read more…