The four new Metrorail stations in the Tysons Corner-area of Fairfax County illustrate diversity of land uses.
Tysons Corner, the archetype of an Edge City, is a mix of office towers, apartment buildings and single-use retail in a suburban, auto-oriented setting. As such, one would expect to see ridership at the new Tysons-area stations reflect the diverse land uses. Ridership data (station entries) from October, 2014, illustrate this perfectly.
McLean
This station shows more AM Peak entries than any other time period, showing its station area is more like a typical “bedroom” community than the rest. However, very strong PM Peak station entries reflect many employment sites near the station, providing a near-perfect balance between AM and PM peak entries. As would be expected at stations with limited retail, mid-day and evening ridership is low at McLean.
Tysons Corner
This station has perhaps the most unique ridership pattern, with PM Peak ridership dwarfing all other time periods, and evening ridership higher than even AM Peak. This station is located adjacent to two of the region’s largest shopping malls, and the ridership likely reflects both shoppers and retail employees using the station heavily throughout the day.
Greensboro
This station has the greatest number of entries in the PM Peak. This pattern reflects the suburban employment center-nature of this section of Tysons Corner. Midday and evening ridership are significantly lower than the peaks, reflecting lower numbers of transit-accessible retail.
Spring Hill
This station is similar to McLean with the greatest number of entries in the AM Peak, reflecting large residential complexes nearby. However, this station also draws a fair number of PM Peak entries, nearly as many as in the AM, reflecting the variety of job sites within walking distance of the station.
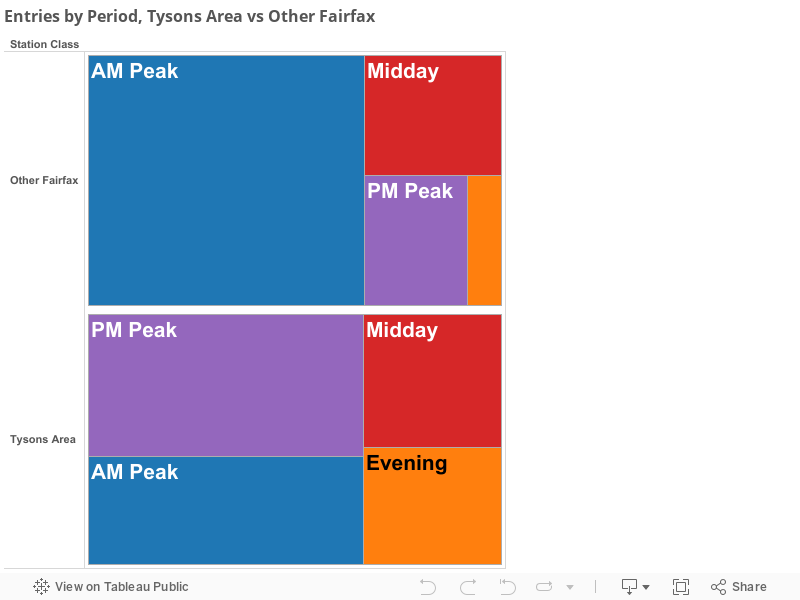
Tysons-Area Stations versus Other Fairfax County Stations
Perhaps what’s most unique about these ridership patterns is that they differ from those of the other stations in Fairfax County. Below is a graphic showing percentage of system entries by period for Tysons-area stations versus the other stations in Fairfax County. At the other Fairfax County stations, system entries are concentrated (two thirds!) in the AM Peak. Ridership at the Tysons-area stations is more diverse, with 37% of the entries in the PM Peak and another 29% in the AM Peak.
These graphics and the data behind them are available for download from the Tableau Public site. What other patters can you find?


 Over the past few years we’ve been making ridership data available for download and analysis by the online community. We have received some requests for full origin-destination (O/D) data sets that include the new Silver Line ridership.
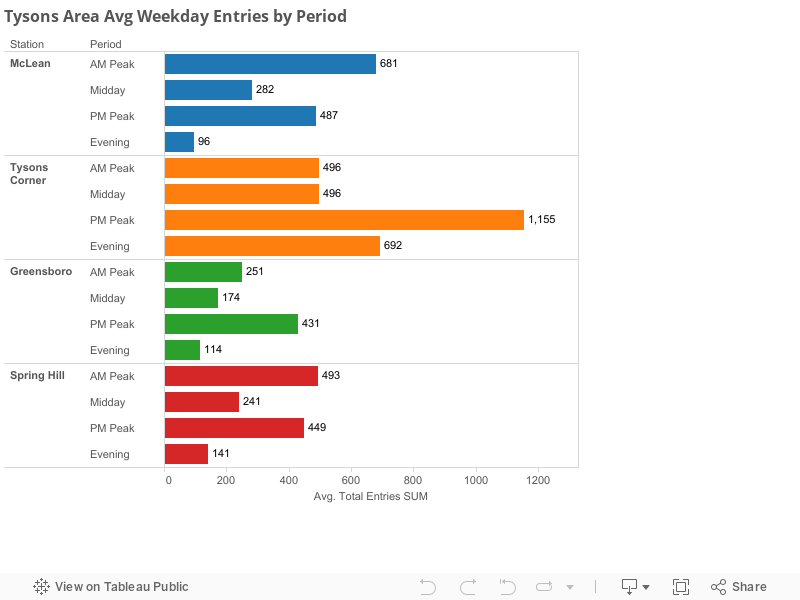


Recent Comments