‘Engage’

Chart of the Week: Metrorail and Metrobus Ridership 5-Year Trend

October 29th, 2012 Comments off

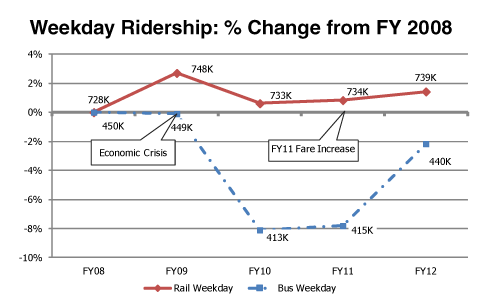
A recent analysis of 5 years worth of ridership data has shown the impacts of the economic downturn and subsequent recovery on Metrorail and Metrobus ridership. Metrorail ridership experienced a 2% drop in ridership in FY10 and then recovery in FY11 and FY12, 1% below FY09 levels. Metrobus ridership experienced an 8% drop in FY10 and began recovery in earnest in FY12, returning to just over 1% above FY08 levels.

Categories: Engage Tags: , , ,

What Happens to Metrorail Ridership on Holidays?

October 25th, 2012 3 comments

About ten days a year, Metrorail operates on a holiday schedule. On some holidays, most commuters have the day off, like Christmas, Labor Day, or Independence Day. But other days can be holidays for some, but not others – like Columbus Day, Veterans Day, or Martin Luther King, Jr. Birthday – and these often fall on a Monday or Friday to make a long weekend.  Federal workers, whom we estimate at over a third of peak ridership, usually get these days off, as do others.  Metro often uses some holidays to do trackwork. So what happens to rail ridership on holidays?

To answer this question, this post examines total ridership on holidays over the past few years, by holiday, and by time of day. I excluded Christmas, New Year’s Day, and Independence Day, since these holidays are strongly influenced by how they fall in the calendar, and by the events on the National Mall on Independence Day.

Here’s a look at ridership on the remaining 7 holiday weekdays.  For the sake of comparison, I also show an average weekday, Saturday, and Sunday for May 2012.
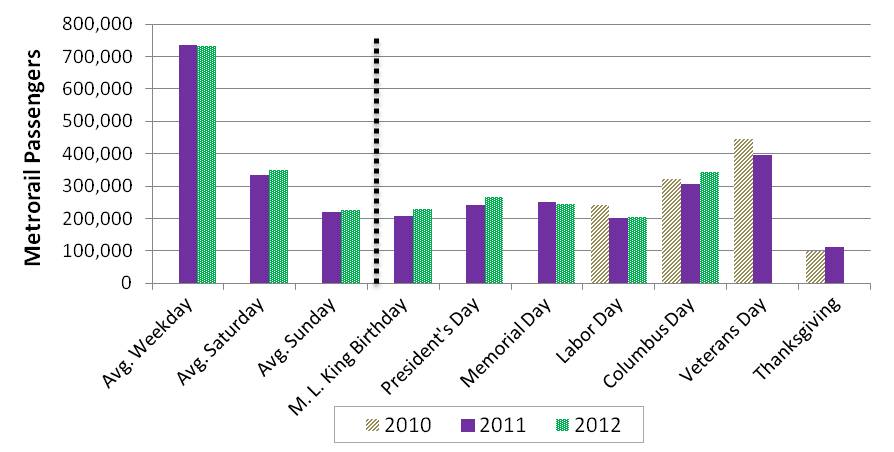
Historical Metrorail ridership on holidays, compared to average May weekday, Saturday, and Sunday

So, all holidays shown have much lower ridership than a typical weekday, and are more in the range of a Saturday or Sunday. A typical weekday on Metrorail shows around 730,000 riders per day, with Saturdays about half that, and Sundays around a third of a weekday.  The holidays shown above are in the range of  200,000 to 400,000 riders per day.

Read more…
Categories: Engage Tags: , , ,

Nats Fans Take Metro

October 12th, 2012 Comments off

The Nats thrilled us last night with a ninth-inning home run to win the game, and the crowd at Nationals Park went wild.  And afterward, nearly 15,000 fans took Metrorail on their way out of the stadium.

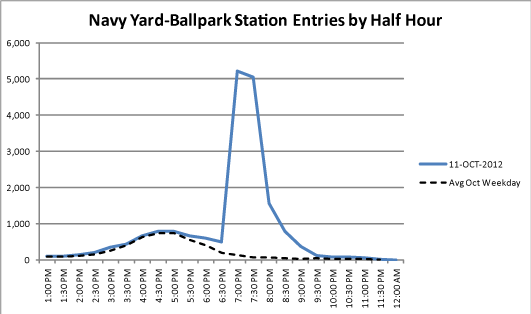
The graph below shows number of entries at Navy Yard-Ballpark Station from 1 pm to midnight yesterday in blue, and the black dashed line represents the average ridership on days this month without a ballgame.  The gap between the solid line and the dashed line represents the station entries that are associated with yesterday’s game.  The total number of game-related entries to the Navy Yard-Ballpark station from 7 p.m. to midnight was 12,835.

Navy Yard-Ballpark station entries showing the spike of customers using Metro after last night's game.


Of course, not all Nats fans enter the system at Navy Yard. When you include increased post-game ridership at nearby stations (e.g. Capitol South), one third of all Nationals attendees used Metro after the game (14,786 total). Read more…

Categories: Engage Tags:

Metrorail Late Night Usage Patterns

February 17th, 2011 1 comment
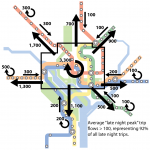
Late Night OD Map by SuperZone

The Metro board recently received a staff presentation containing some options for narrowing the projected gap in the fiscal year 2012 budget.  One of these options, the elimination of weekend late-night service, garnered a lot of attention in the media and on the local transit blogs. A lot of the discussion centered around understanding who these passengers are (late night revelers, night shift workers), where they’re starting their trips and where they’re ending them.   Others discussed what other transit alternatives might be viable replacements for Metrorail late-night service.

One local blog, Greater Greater Washington, posted a great diagram generated by one of their contributors that illustrates total station volumes for late night trips and helps see whether a station is an origin station, a destination station, or in the middle.  The map does a wonderful job of illustrating origins, destinations and volumes, but leaves one question unanswered:  what sorts of trips are actually being made?

Read more…

Categories: Engage Tags:

Peak Hour Passenger Ridership on Metrorail

November 29th, 2010 1 comment

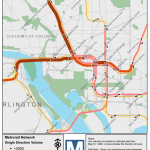
More than two-thirds of daily ridership occurs during the morning and evening peak periods.  In fact, the peak ridership is a key determinant to Metro’s operating plan and future system planning efforts.   An assessment of peak passenger ridership allows Metro to locate areas of current and future peak-period passenger crowding,  and then plan to develop and fund capital projects aimed at addressing these capacity-constrained locations.

In 2009, Metro’s Office of Long Range Planning developed a tool to estimate passenger ridership on individual rail segments based on the station-to-station origin-destination data in the ridership database.  The tool approximates passenger volume by peak hour and period.  Then we use GIS to map the link-level passenger volumes.

Read more…

Categories: Engage Tags: , ,

Metrobus High Frequency Corridors Map DRAFT

November 19th, 2010 32 comments

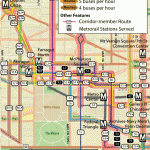
The Metrobus system is a robust network of surface transit lines that provide service to a variety of markets.  Each different market is best served by a different type of bus service.  Some bus routes only operate during the peak periods, while others operate from early morning to midnight.  Some routes provide limited-stop commuter service, while others stop frequently every other block.   Some routes provide only a few bus trips per hour, while others run every 10 minutes on a fixed frequency.

Metrobus lines provide a variety of services, and the current Metrobus map is designed to show all routes without regard to the service types and the markets they serve.  Metro is aware that different travel markets could benefit from maps illustrating the bus service best suited to them.

Perhaps the market most in need of specialized maps and traveler information is the casual/off-peak rider.  While commuters place the heaviest load on the bus system and tend to have very rigid schedules, the casual rider has no fixed schedule and travels during the off-peak times when service exceeds demand.  This makes the casual rider the most inexpensive to serve,  yet most difficult.  The casual rider wants convenient, point-to-point travel options any time of the day without having to consult a timetable.  A “12-minute” map can provide the casual rider with the information she needs to make her trip.

Read more…

Categories: Engage Tags: ,