Metrorail Late Night Usage Patterns
The Metro board recently received a staff presentation containing some options for narrowing the projected gap in the fiscal year 2012 budget. One of these options, the elimination of weekend late-night service, garnered a lot of attention in the media and on the local transit blogs. A lot of the discussion centered around understanding who these passengers are (late night revelers, night shift workers), where they’re starting their trips and where they’re ending them. Others discussed what other transit alternatives might be viable replacements for Metrorail late-night service.
One local blog, Greater Greater Washington, posted a great diagram generated by one of their contributors that illustrates total station volumes for late night trips and helps see whether a station is an origin station, a destination station, or in the middle. The map does a wonderful job of illustrating origins, destinations and volumes, but leaves one question unanswered: what sorts of trips are actually being made?
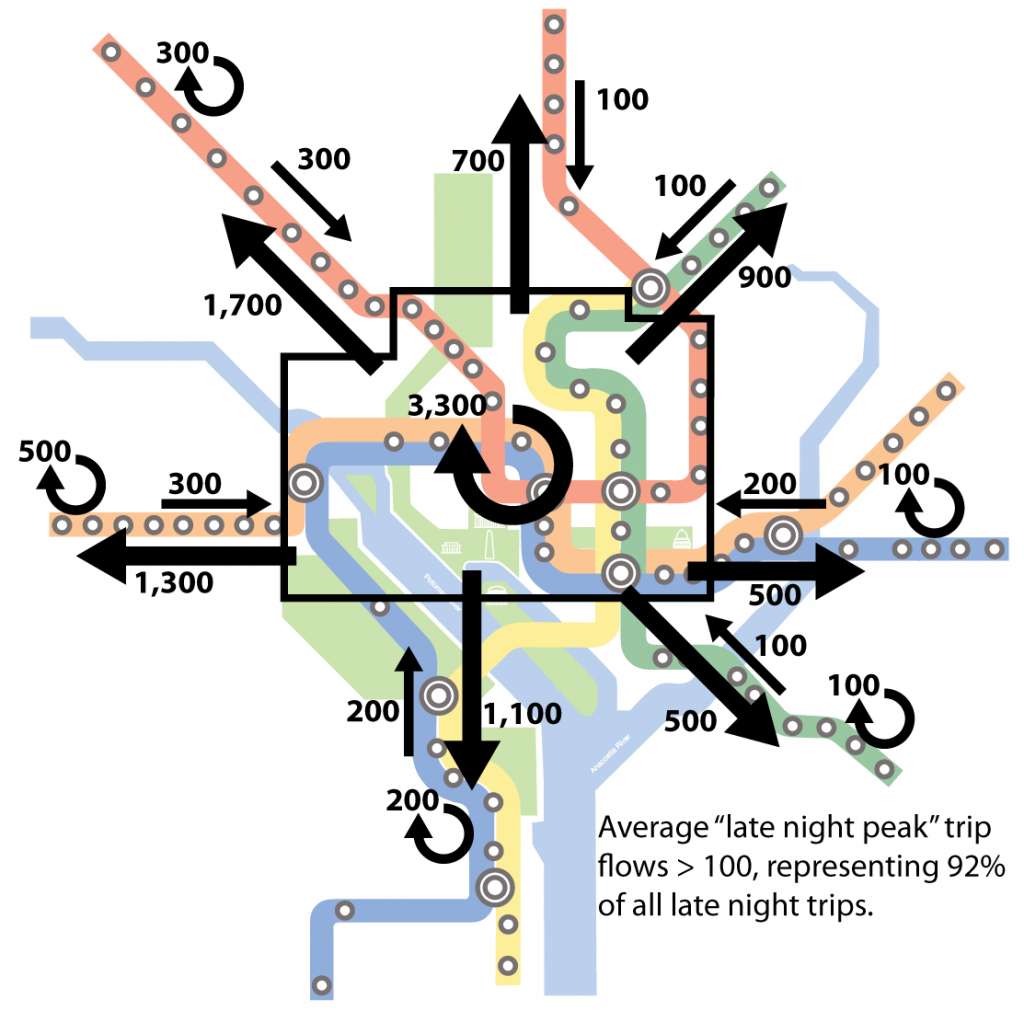
The diagram below, made by Metro planning staff, answers this question. Not focused on individual station volumes like the GGW diagram, this diagram splits the Metrorail system up into 8 service zones: one for the “core” of the system and one each for the non-core trunk lines leaving the core. (The eastern ends of the Orange and Blue lines are paired into one zone, as are the southern ends of the Yellow and Blue lines.) The numbers and arrows on the diagram indicate the rounded average number of people going between zones, or staying within a zone, during the late-night period.* All flows greater than 100 persons are displayed. Interestingly enough, the only passenger flows greater than 100 were either leaving the core, entering the core, or staying within a zone.
Here are some other data points from the origin-destination analysis:
- 73% of the late night trips originate in the core zone. No other zone has more than 5% of the origins.
- 34% of the region’s late night trips are to the core zone.
- 24% of the late night trips both originate and end in the core zone. Therefore, 10% of the late night trips originate outside the core and terminate inside it.
The time these trips is also a factor. Analysis shows that more than half of the late-night boardings occur after the first hour of the late-night service period. Approximately one quarter of the late night trips being after 2 AM.
This data can be used to explore options for reducing the cost of late night service, either by better matching rail service to late-night demand, or exploring other options for providing these trips through other transit modes. We welcome your comments on this data or recommend service alternatives based on the above passenger flows.
*A note on the data: The data used for this assessment are for trips with entries and exits after midnight, September 2010 to November 2010. The data was averaged by the number of late night periods over the analysis range, so that the numbers above represent the flow demand for a given late night period.


Thanks for putting this together! This is very useful information that I would like to share with the Arlington taxicab companies to make a case for more late night service at certain stations.