
How Do Different Modes Compare?
The region either already has or is planning for a variety of different modes. How do they compare?  The Silver Line will soon open as a Metrorail line. Later this year, a streetcar will be operating on H Street, NE with others planned for Columbia Pike in Arlington and the District. Arlington and Alexandria are jointly building a bus rapid transit (BRT) line between Crystal City and Potomac Yard. Once funding is finalized, Maryland will build the Purple Line and light rail transit (LRT) will connect New Carrollton and Bethesda. This is all in addition to the region’s existing commuter rail, commuter bus, Metrorail, Metrobus, and MetroExtra services. The region is not only expanding transit services, but it also expanding the types of transit modes that will operate. At long last, instead of talking about Portland (streetcar), Jersey City (light rail), or Cleveland (bus rapid transit), we’ll be able to point directly to services and infrastructure in our backyard or take a trip and experience the pros and cons of these modes for ourselves.
So how do the different modes compare? What kind of purposes does each serve? There are many external factors and trade-offs that influence how agencies and jurisdictions select which mode to implement. As we see from the ongoing debates in jurisdictions across the region between LRT and BRT or streetcar and enhanced bus, there is not always one perfect choice. However, an array of transit and land use measures can provide context to the conversation. As part of ConnectGreaterWashington: The 2040 Regional Transit System Plan, we developed the below table to compare commuter rail, commuter bus, heavy rail, light rail, streetcar, bus rapid transit, and enhanced bus across land use intensity (households and employment), vehicle capacity, stop spacing, trip length, and capital and operating costs.
What do you think? Does this information better inform the rail vs bus debate? What other information would provide more clarity on what modes work where?
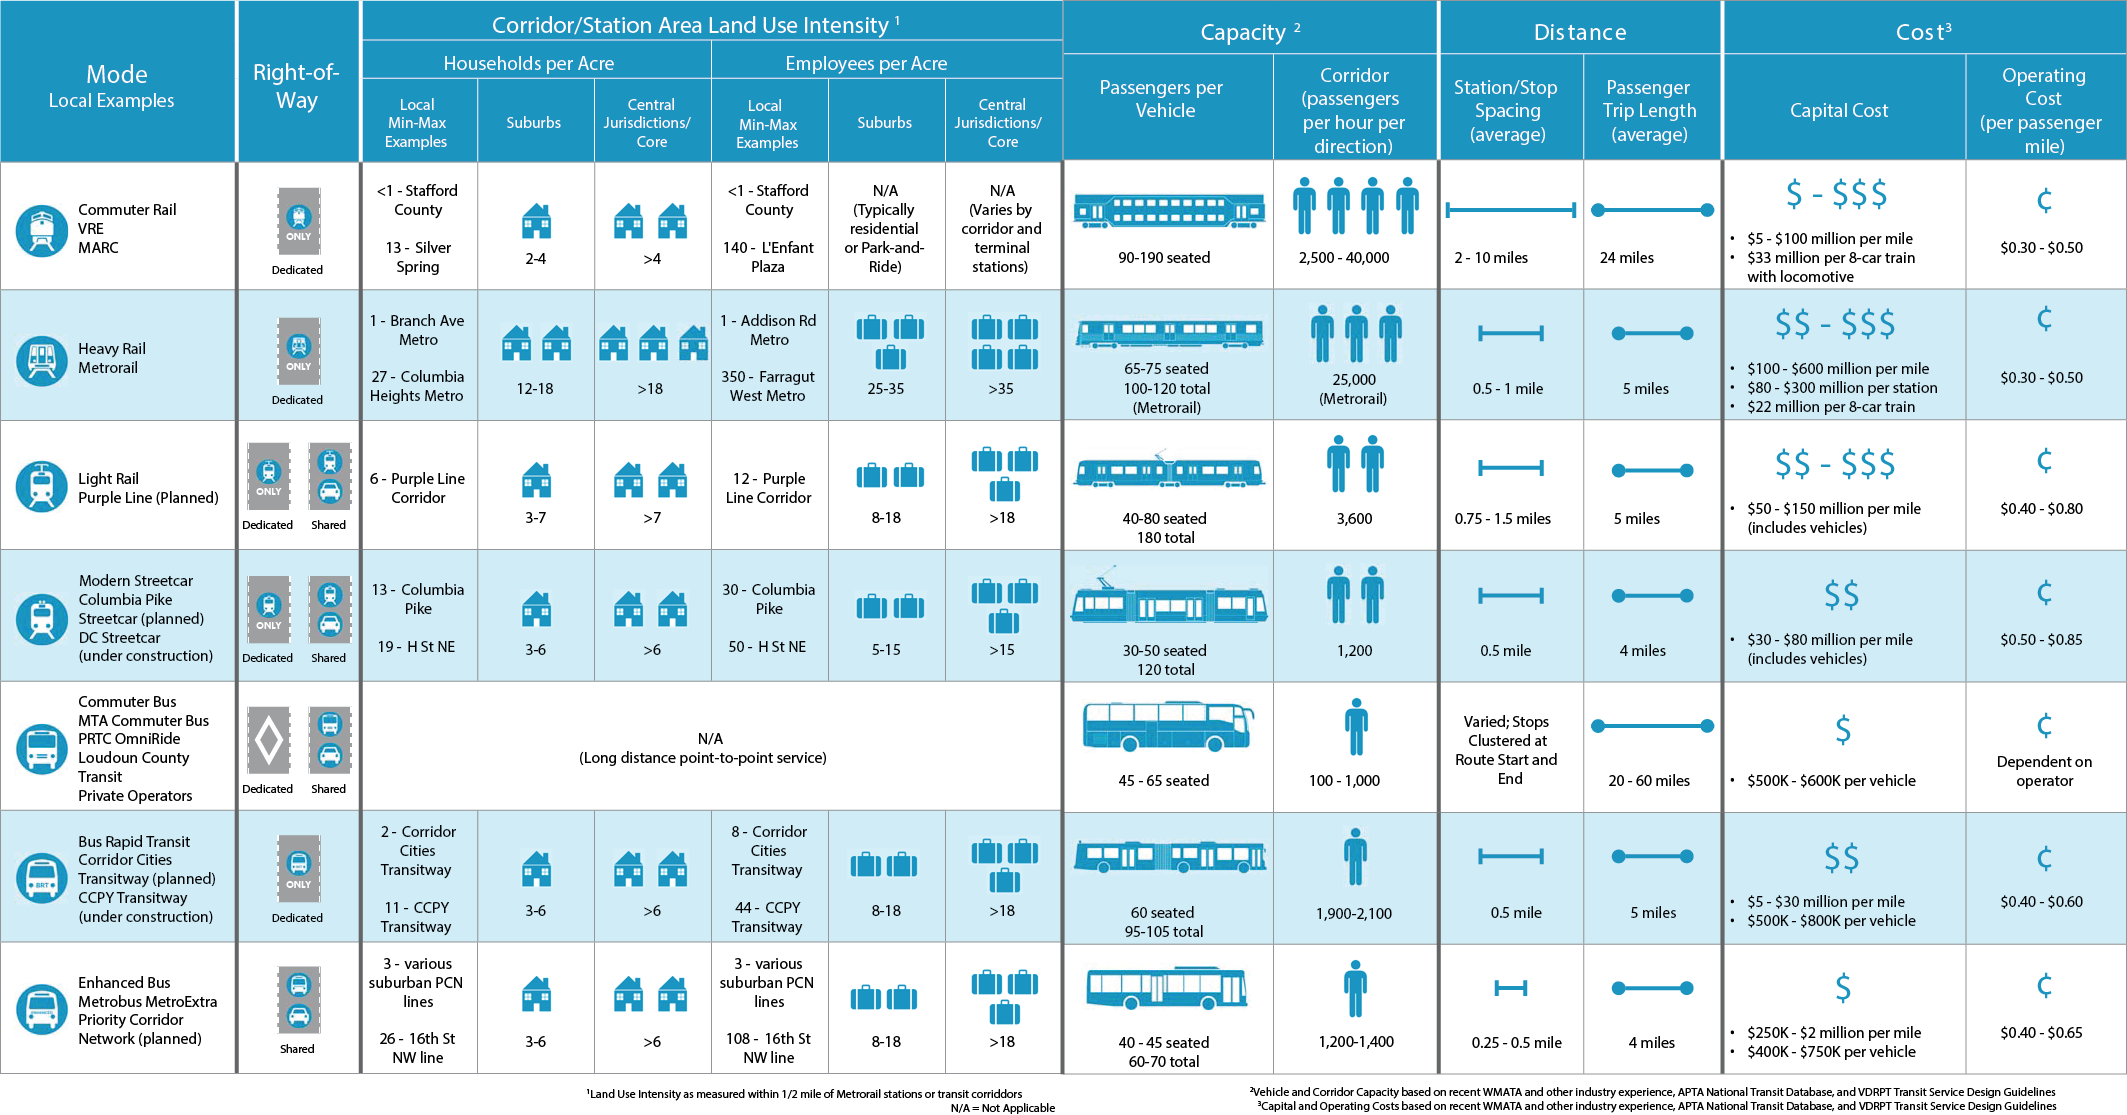
Comparison of High-Capacity Transit Modes

I would be interested to know the average vehicle lifetimes. Some of the materials I’d read regarding the purported benefits of streetcars were the minimal maintenance and long lives. Also, why isn’t the cost of the street car vehicles listed separately?
Why no local bus, too much variation?
I thought the purple line was going to be a dedicated bus line?
Thanks for the comments. This is supposed to be a comparison of high capacity transit, hence why enhanced bus (MetroExtra lines) are included, but not regular local bus service. Additionally, Alan, you are right – local bus has a lot of variation, so the averages would be fairly meaningless.
Andrew, the Purple Line has decided to go forward as light rail. The Record of Decision and accompanying Environmental Impact Statement (EIS) and other documents can be found here: http://www.purplelinemd.com/en/about-the-project/studies-reports/record-of-decision
San Francisco is in the process of reworking its bus and rail system to make them more efficient. Part of the problem is that stops are too close together, 1 or 2 blocks. A few bus lines have two stops on the same 0.15 mile block.
When the H St. streetcar opens for service this year riders will find a much different travel experience than on Metro. They will find it even slower than the bus since trains cannot weave in and out of shared traffic. In SF, the combined Market St/Twin Peaks tunnel is over 6 miles in length with 9 stations. It usually takes under 15 min to travel from Embarcadero to West Portal at which point the three remaining light rail lines begin their respective surface routes. This is the point when travel slows to a crawl since all three lines operate in mixed traffic with stops on the average of every 2 blocks. My commute takes 15 more minutes to travel the final 1.5 miles home from West Portal.
I’d like to see the average trip length expressed in time, in addition to distance. This will help demonstrate how well the mode might compete with SOV.