
How Smarter Urban Planning Can Help the Chesapeake Bay
Better urban planning can help save our rivers and the Chesapeake Bay—by reducing this region’s future impervious surfaces by 20%. Here’s why.
As many Washingtonians know, the Chesapeake Bay needs help. Dead zones and algae blooms appear every summer which destroy aquatic life in the Bay and threaten fishing, swimming, and economic health. A major contributor to this problem is rainwater runoff from paved roads, parking lots, and roofs. These are called “impermeable surfaces”. In contrast, permeable (or pervious) surface is one through which liquids are able to pass.
Grassy fields, woodlands and farmlands are excellent examples of this: rainwater or snowmelt soaks into the ground, pollutants in the water are filtered naturally, and excess water travels underground to streams and eventually (in the Washington region) the Chesapeake Bay.Rainfall that falls on impervious surfaces like paved roads, parking lots and roofs “runs off” unfiltered making its way to the Chesapeake Bay—along with nitrogen and sulfur oxides from vehicle emissions, motor oil, and road salt residue.
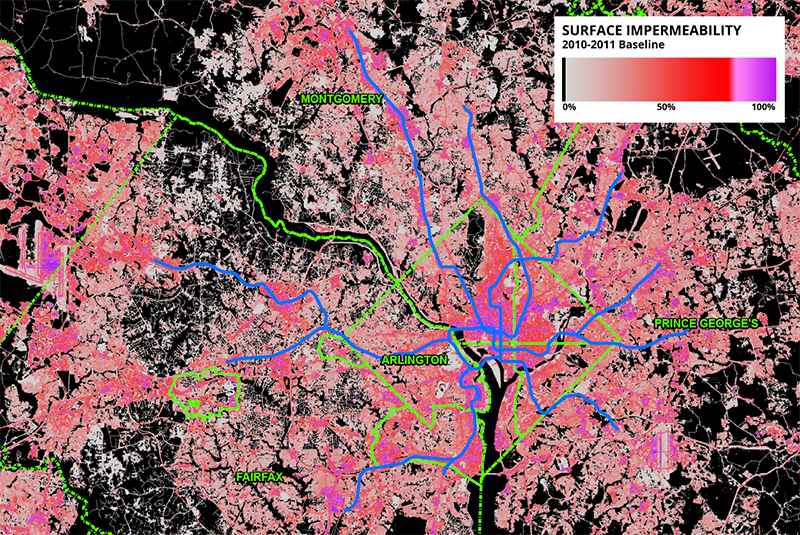
Figure 1 – Map of impermeability throughout the region with overlaid jurisdictional boundaries and Metrorail system for reference. Note the concentrations of highly-impermeable surfaces in central D.C., and at other activity centers like Dulles.
Better growth patterns and public transportation investments help preserve permeable surfaces like open fields, woods or park lands that play a key role in preserving the health of the Chesapeake Bay. Models comparing regional development patterns show that with more transit investments and a more transit-oriented future, the region could save 6,000 acres of permeable area that it would otherwise lose between now and 2040 – an area 18 times the size of the National Mall, or nearly eight times the size of National Airport. This would prevent an average of 6.5 billion gallons of particulate-laden rainwater and snow-melt from flowing into the Chesapeake Bay every year.
To quantify how different land use and transportation decisions could effect the Chesapeake Bay, we modeled two potential scenarios for growth.
Currently, all of the areas of impermeability in the Washington metropolitan region add up to 165,000 acres of fully impervious surface—about 13% of the total land, or an area just over 4 times the size of the District of Columbia.
We combined data on impermeability levels at a 100-foot resolution from the National Land Cover Database with current and forecast land-use data, by aggregating the permeability data into Transportation Analysis Zones, or TAZes. Current and forecast data on households and employment are attached to each TAZ by MWCOG’s cooperative forecasts.
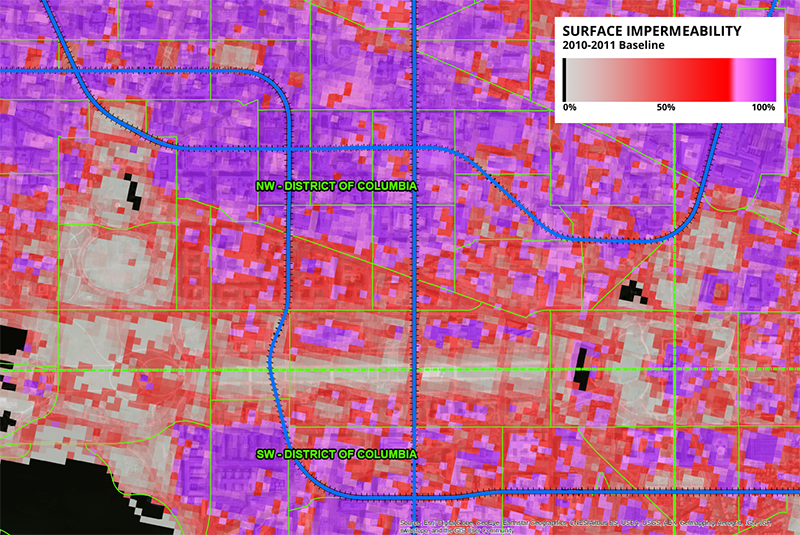
Figure 2 – A close look at Penn Quarter, Federal Triangle, and the National Mall. Easily visible are the bodies of water along and near the Mall (in black), the Capitol dome, the White House, and Pennsylvania Ave. TAZ borders are outlined in the thin green lines.
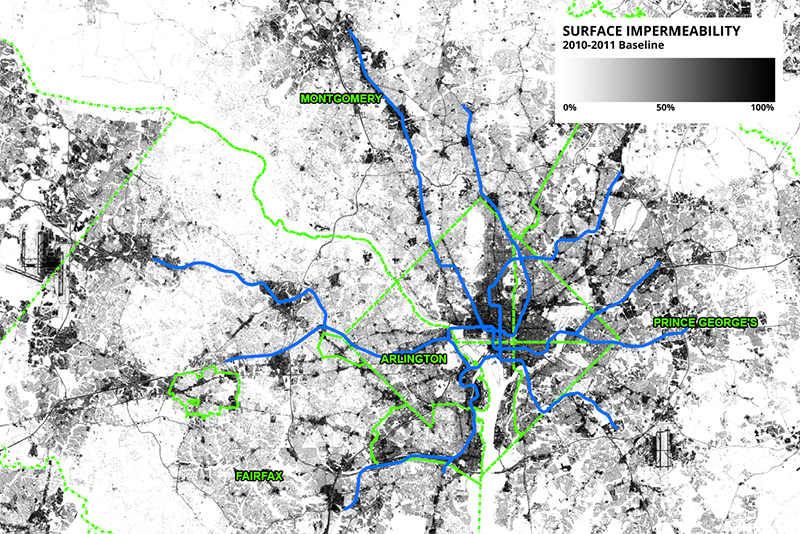
Figure 3 – A regional view of today’s surface impermeability at 100 foot resolution.
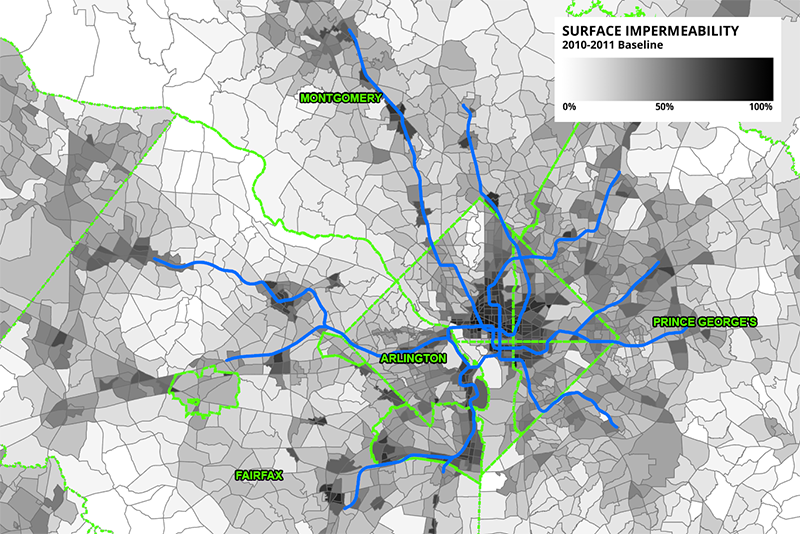
Figure 4 – A regional view of today’s surface impermeability aggregated at the TAZ level.
Data clearly showed that impermeability is correlated with population and job density – a strong relationship emerges between the combined household and employment density (the “human-activity density” in Figure 5 below) when permeability data displayed on the maps above is analyzed together with socioeconomic data. This information allows us to model changes in permeability based on different regional growth patterns.
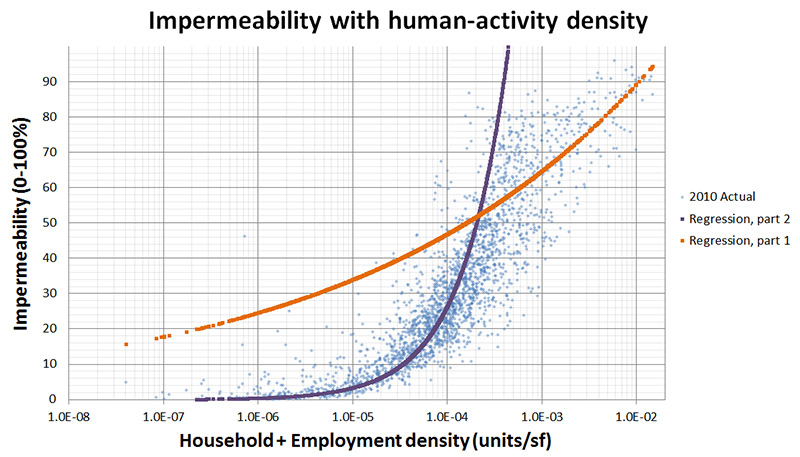
Figure 5 – Our model showing today’s surface impermeability related to the human-activity density in the respective TAZ (each represented by a dot). The orange and purple lines show a piecewise best-fit regression.
How could different land use planning and transit investments change permeability? To find out, we measured the expected impact of two 2040 land-use forecasts produced by MWCOG. The first, the standard cooperative growth forecast, is based on current jurisdictional master and long-range plans. The second, MWCOG’s Aspirations scenario, focuses population and job growth in transit served “Activity Centers”. Each scenario forecast assumes the same types and levels of growth to the region as a whole – they just assign the growth to different locations. Applying the piece-wise regression, we estimated change in permeability as a function of density.
We found that, by adopting the Aspirations growth scenario, the region saves 6000 acres of permeable land or open space that the region would otherwise lose between now and 2040. The graphics below illustrate the amount of impervious surface in the region under both cases, and can be compared to Figure 4. The direct savings in permeability between the baseline and Aspirations scenarios equates to a 20% improvement from the predicted loss by 2040 – an area 18 times the size of the National Mall, or nearly 8 times the size of National Airport, as Figure 8 shows.
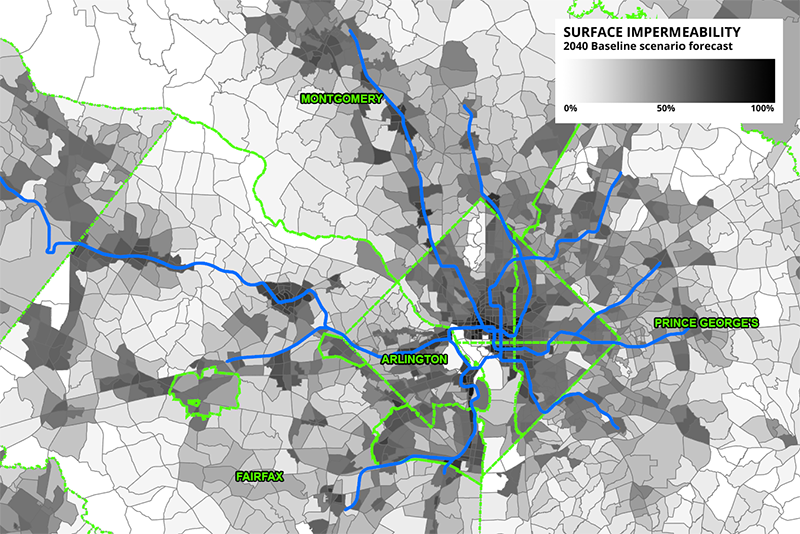
Figure 6 – Projected regional impermeability in 2040, business as usual (baseline)

Figure 7 – Projected regional impermeability in 2040 for the more transit-oriented growth scenario
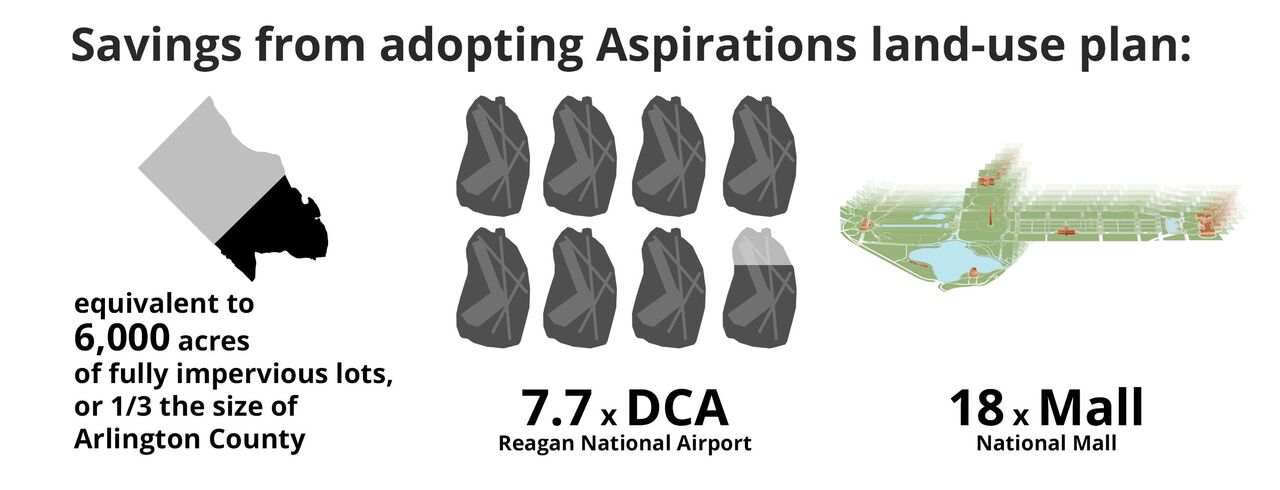
Figure 8 – Savings associated from adopting a regional land-use plan with emphasis on transit-oriented growth.
Now we are able to show how better planning can help save our rivers and the Chesapeake Bay. By reducing future impervious surfaces by 20%, adopting the Aspirations land-use scheme would prevent an average of 6.5 billion gallons of particulate-laden rainwater and snow-melt from flowing into the Chesapeake Bay every year.
Our model shows that moving growth to higher-density clusters along major transit corridors – and investing in the supporting transit infrastructure – results in more green and open space and less impermeability between now and 2040 than under the current regional long-range forecast. By keeping these 6.5 billion gallons of polluted water from entering our region’s drains and flowing into the Bay, we protect both the health of the Bay and preserve open space for future generations.

Recent Comments