In this guest post, Mr. Christiaan Blake, Director, WMATA Office of ADA Policy and Planning describes a new cost-cutting partnership called Abilities-Ride.

Mr. Christiaan Blake, Director, WMATA Office of ADA Policy and Planning
On September 30, the Washington Metropolitan Area Transit Authority (WMATA) issued a request for proposals (RFP) for its new Abilities-Ride program. Abilities-Ride is designed to provide MetroAccess–eligible customers with access to a general trip purpose alternative in the Prince George’s and Montgomery County sections of the MetroAccess service area. Depending on the results of the program, Abilities-Ride could be expanded to cover the entirety of the MetroAccess service area. Abilities-Ride will not be a Metro service, but instead a public-private partnership between Metro and one or more vendors that provide existing or soon-to-be established generally available on-demand service. Metro will subsidize up to $15 per eligible customer trip.
MetroAccess Sustainability
MetroAccess is the region’s designated paratransit service for people whose disabilities prevent them from using bus and/or rail services for at least some of their trips. As outlined in the Americans with Disabilities Act (ADA), paratransit services like MetroAccess were designed to be a safety net. However, in many places, including the Metro service region, demand for paratransit has grown at unsustainable rates. To address the growth in demand for MetroAccess, WMATA has been facilitating the availability of new alternative services among which MetroAccess customers could choose. The new alternatives include the Coordinated Alternatives to Paratransit Service (CAPS) pilot program for trips to/from human services agencies, and the highly successful TransportDC service that allows Washington, DC residents eligible for MetroAccess to call a cab for medical and work-related trips anywhere in DC for a flat, $5 fare. Read more…
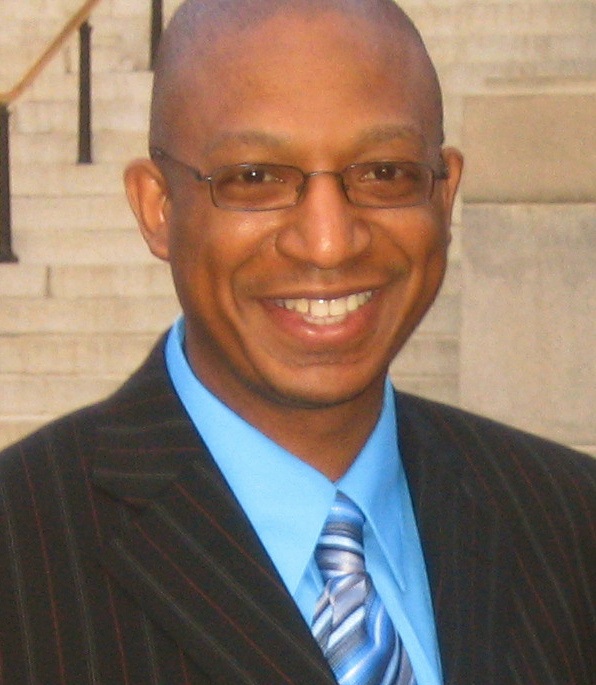
A visual of what transit supportive densities look like for different transit modes
Recently, GreaterGreaterWashington blogged about density, using Google maps 3D images to show what different densities look like in Washington, DC. Visuals like these are so important because most people hear “density”, think “Manhattan” and can’t say “no” quickly enough. Last fall, we completed work as part of ConnectGreaterWashington and the Transit Corridor Expansion Guidelines that illustrated the differences in desired employment and/or residential densities within a transit walkshed by each mode.
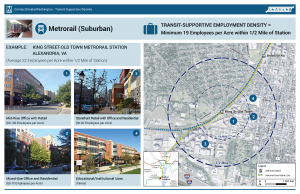
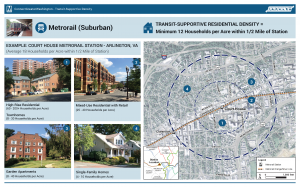
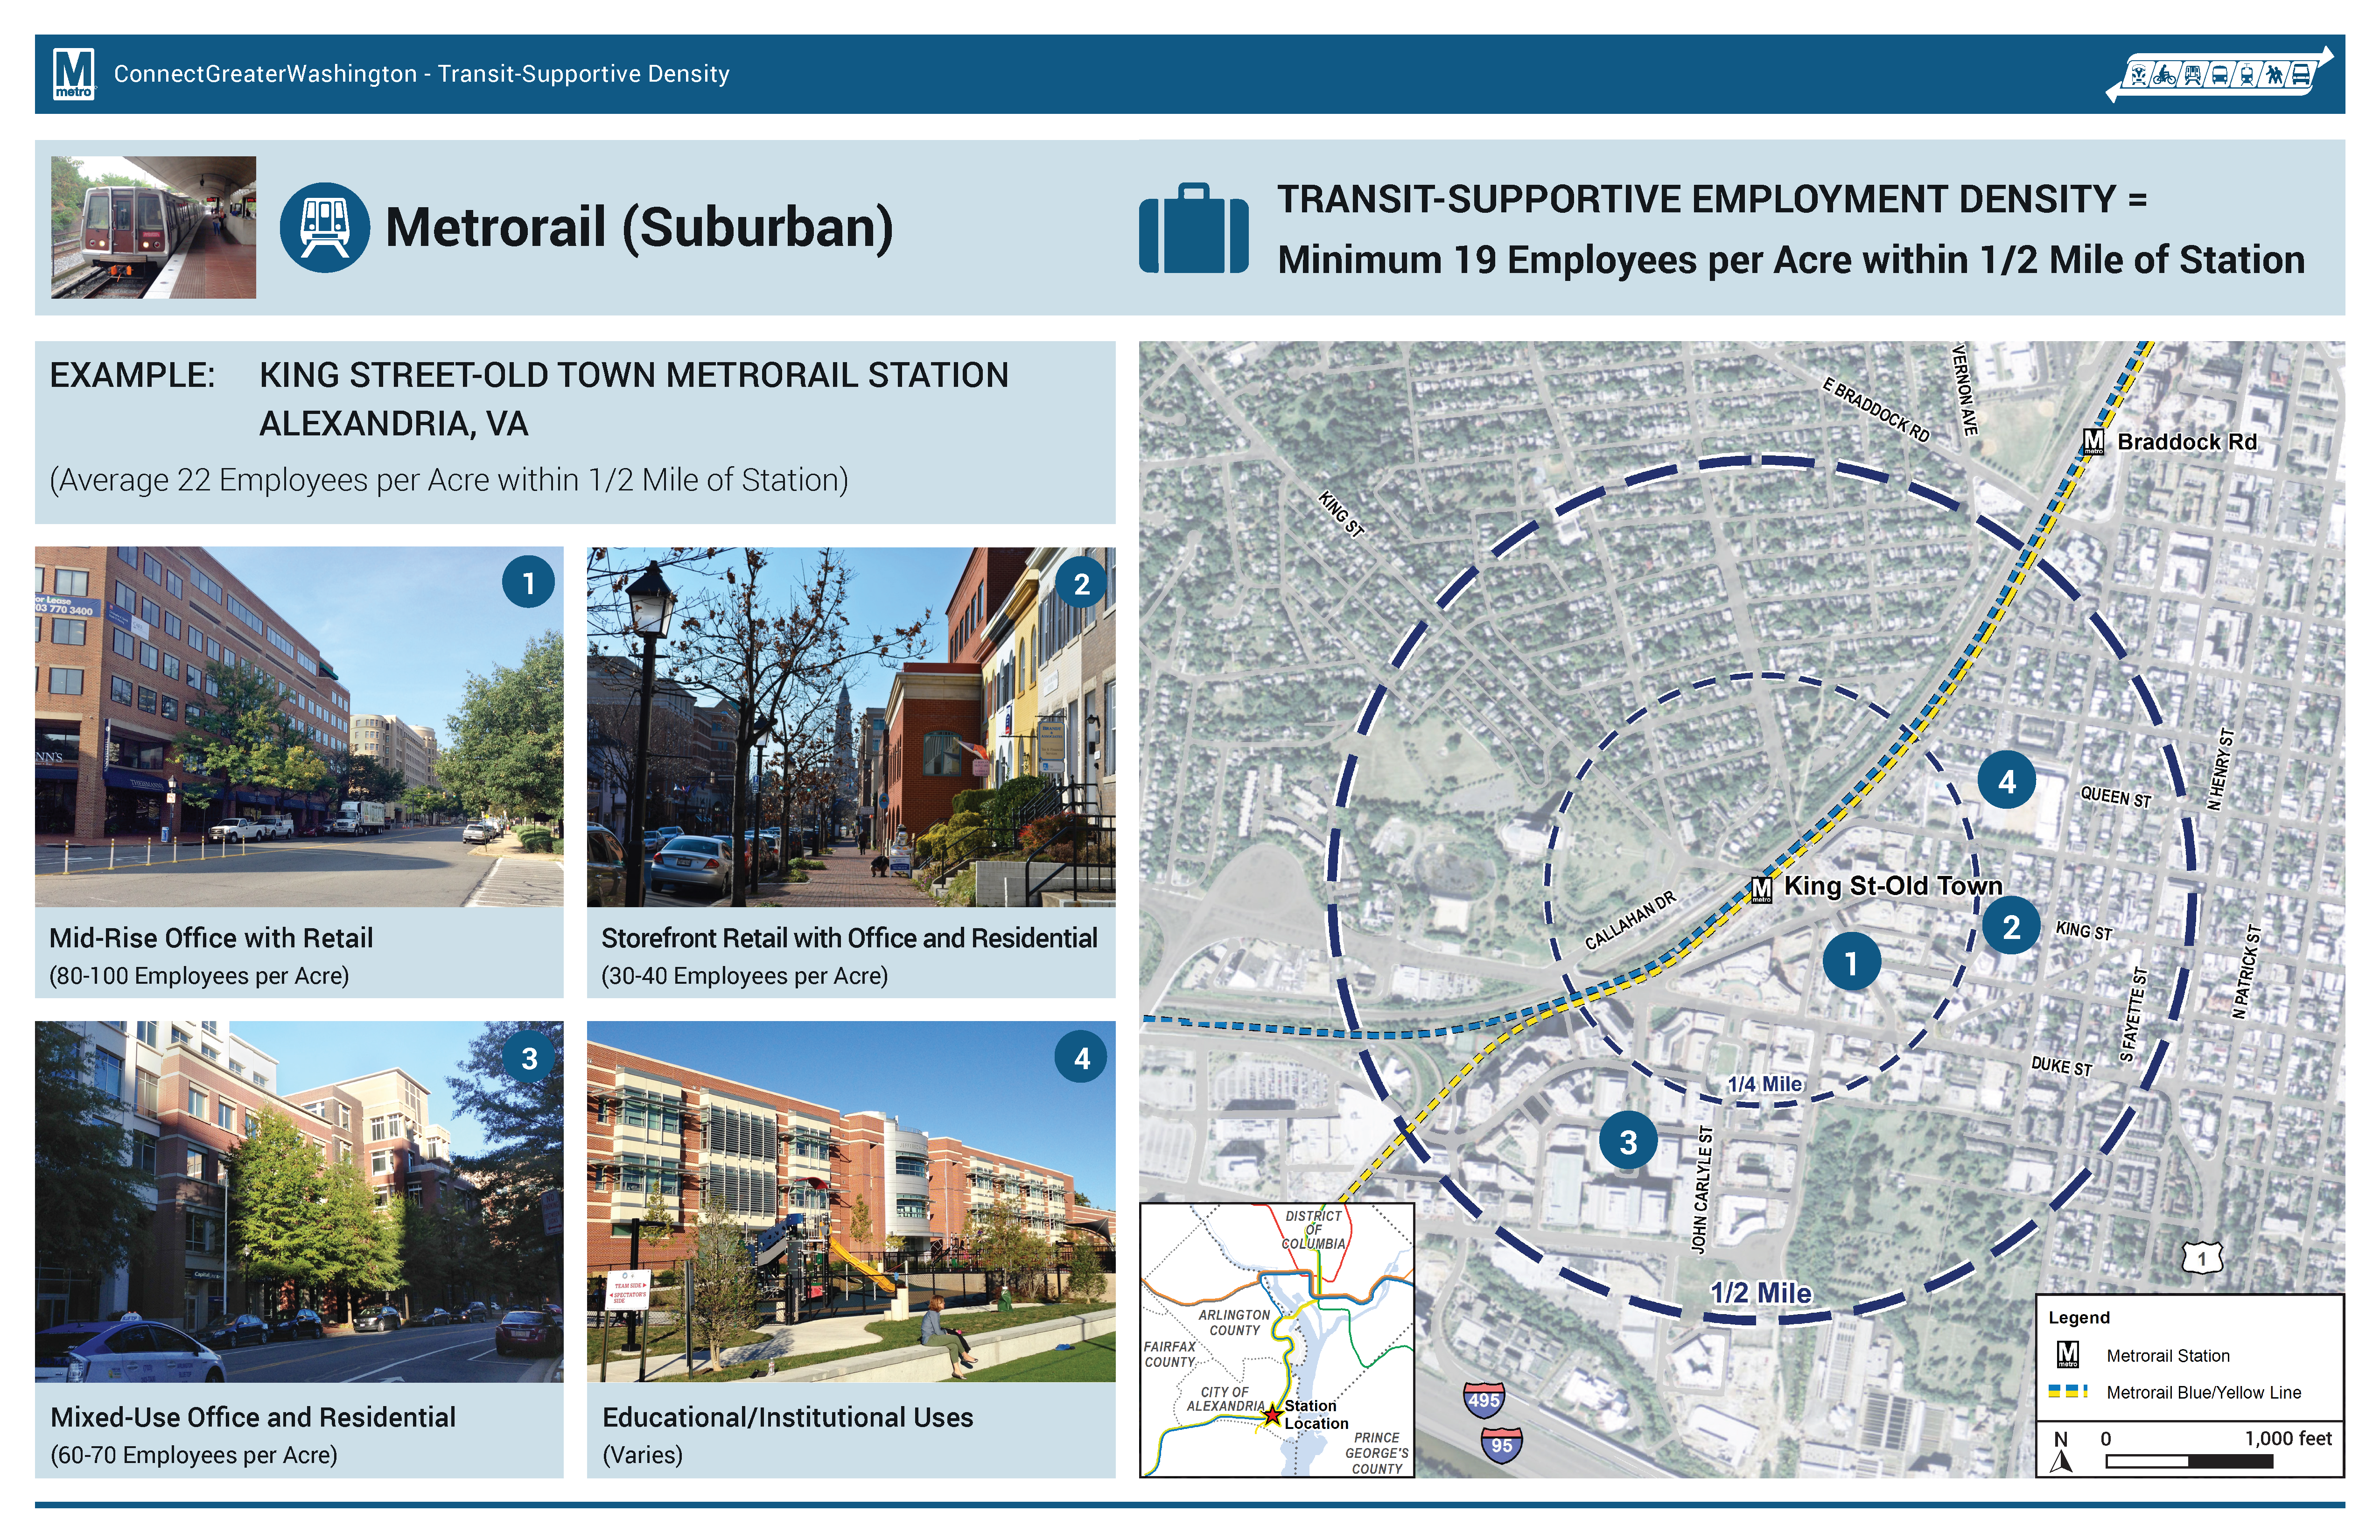
As is typical for planning projects, especially when expanding transit service along new corridors, density is discussed and jobs and/or households per acre targets are tossed around. But most people (full disclosure, that includes me) do not know what 4 households per acre or 150 jobs per acre looks like. It is especially important because a residential target of 12 households per acre within a half-mile of a suburban Metrorail station, for example, does not mean that every residential dwelling needs to meet that target. Instead, within the half-mile radius, the overall density should be 12 or more households per acre. That gives plenty of room to have less dense single family homes (on small lots) and more dense high rise apartments with studios and one-bedrooms.
Below are example stations for each mode and the employment and/or residential density targets, along with images of the different building types that combine to meet or exceed the targets. We’d appreciate your feedback on whether they make sense to you and if they would resonate with the general public.
Metrorail (Suburban) Densities
Note, because of the variability in density across the Metrorail system, we created two types of Metrorail stations to estimate densities.
Read more…
Agenda released for upcoming event focused on identifying rider needs in the apps & maps space.
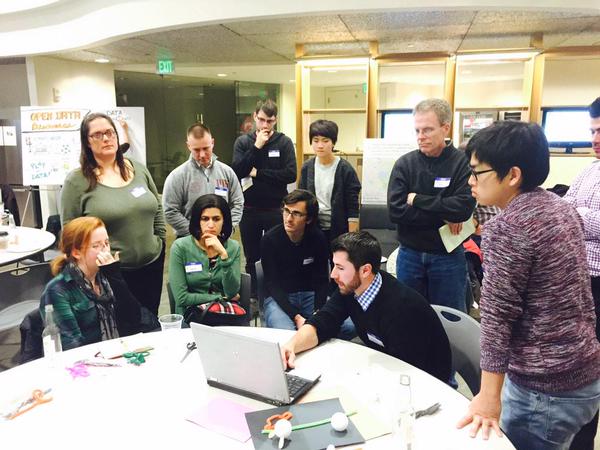
Expect name tags and group activities at our upcoming event. Photo credit Open Data Nation.
Two weeks ago we announced we were hosting an event here at Metro on October 15th to engage the developer, rider and advocate communities to uncover unmet needs and potential solutions to them. We plan to have some fun and meet new people, and we are calling it Destination Ideation.
While we are busily preparing for the event, we invite you to go ahead and check out the event agenda. (PDF)
For those who are interested but haven’t signed up yet, please go to the event page to claim your free ticket. We need a good estimate of the head-count to manage the event.
Download: agenda-destination-ideation-v2
RSVP: http://tinyurl.com/destinationideation
We are looking forward to seeing you on October 15!
New York City’s Select Bus Service may provide an excellent model – and a few cautionary lessons – for WMATA’s Priority Corridor Network and a Metrobus Off-Board Fare Payment System (OBFPS).
Earlier this year, a small team of planners from Metro’s Office of Planning, the Office of Bus Planning, the District Department of Transportation (DDOT), and DC Surface Transit had an opportunity to visit our colleagues in New York and to see their Select Bus Service (SBS) in action. Metro and our partners think it may provide both a good model and some cautionary lessons as we move forward with bus prioritization strategies, off-board fare payment, and the Priority Corridor Network.
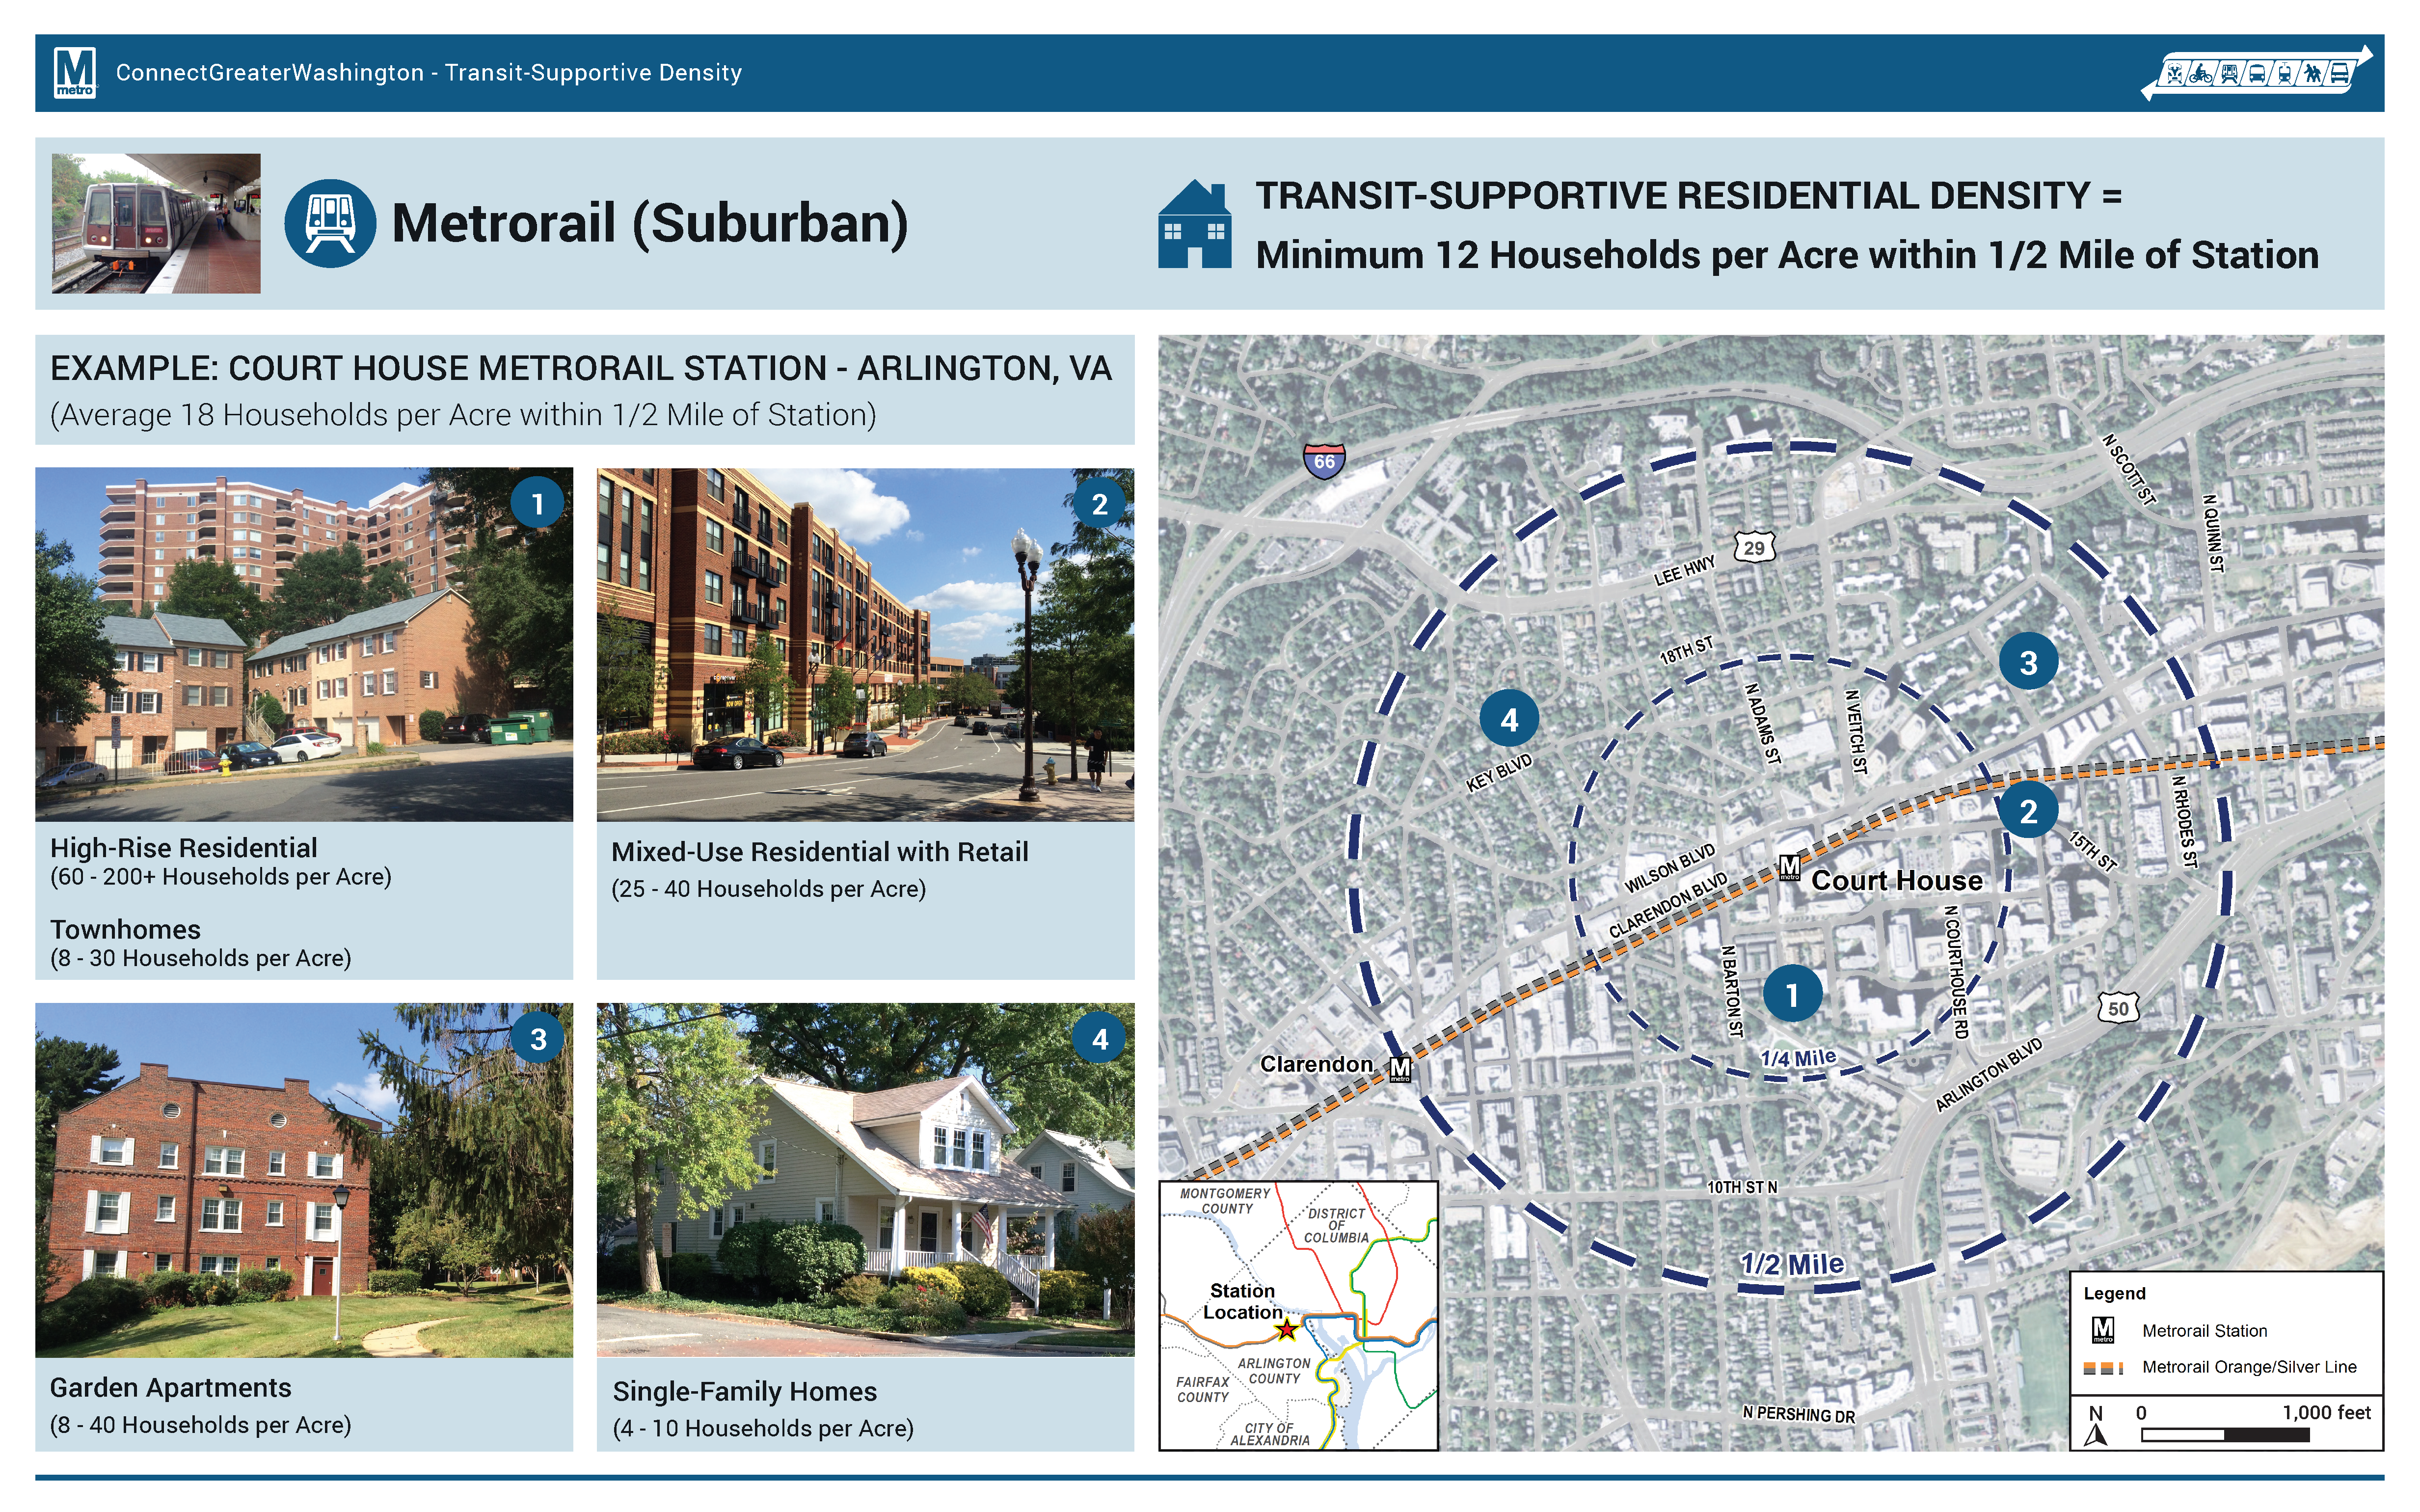
Slower buses = worse service, higher costs
Just as we’ve experienced in and around DC, bus speeds in New York have fallen steadily over the past two decades, and continue to do so. As of 2013, the average speed for Metrobus routes is 10.5 mph. The system-wide average speed of a bus in New York has fallen to 7.5 mph, and routes serving some of the most congested corridors in Manhattan and Brooklyn are down to 4-5 mph. Traffic congestion generated by dynamic growth in jobs and population is the single greatest impediment to faster bus service, but it isn’t the only factor. Just as in our region, buses in New York spend only half of their in-service time actually moving forward; the rest is taken up by traffic signals and passenger boarding:
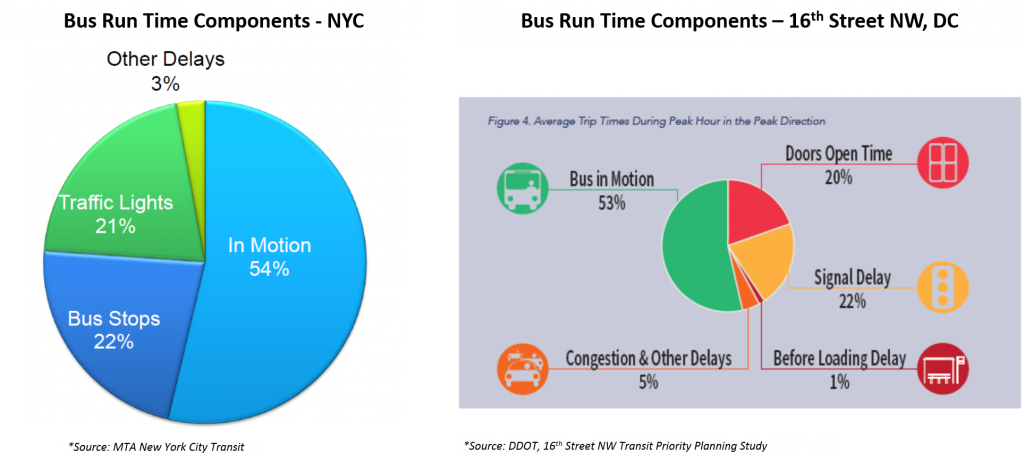
Read more…


Recent Comments