The relocation of Marriott’s headquarters to downtown Bethesda would bring new riders and revenue to Metro, without straining Metro’s capacity. A win-win!

Downtown Bethesda
Marriott last month announced it will move its headquarters to downtown Bethesda, bringing over 3,500 employees to a location that’s now accessible to the Red Line. The move will help Metro by attracting more riders and fare revenue to the Red Line. Using our S.W.A.R.M. model, we estimate that the new headquarters will bring about 1,200 new boardings/day on Metrorail, and over $1 million per year in new fare revenue.
What’s more, we’ve already got space for these new riders. Since most of the new riders would be reverse-commuters (towards Bethesda in the morning) or would originate in Montgomery County, they would not strain existing crowding on-board trains at our pinch points, a.k.a. our maximum load points. Bethesda station has sufficient vertical circulation capacity for them as well. In short, this move is a win-win for Metro, the riders, and our funding partners, and we applaud the decision.
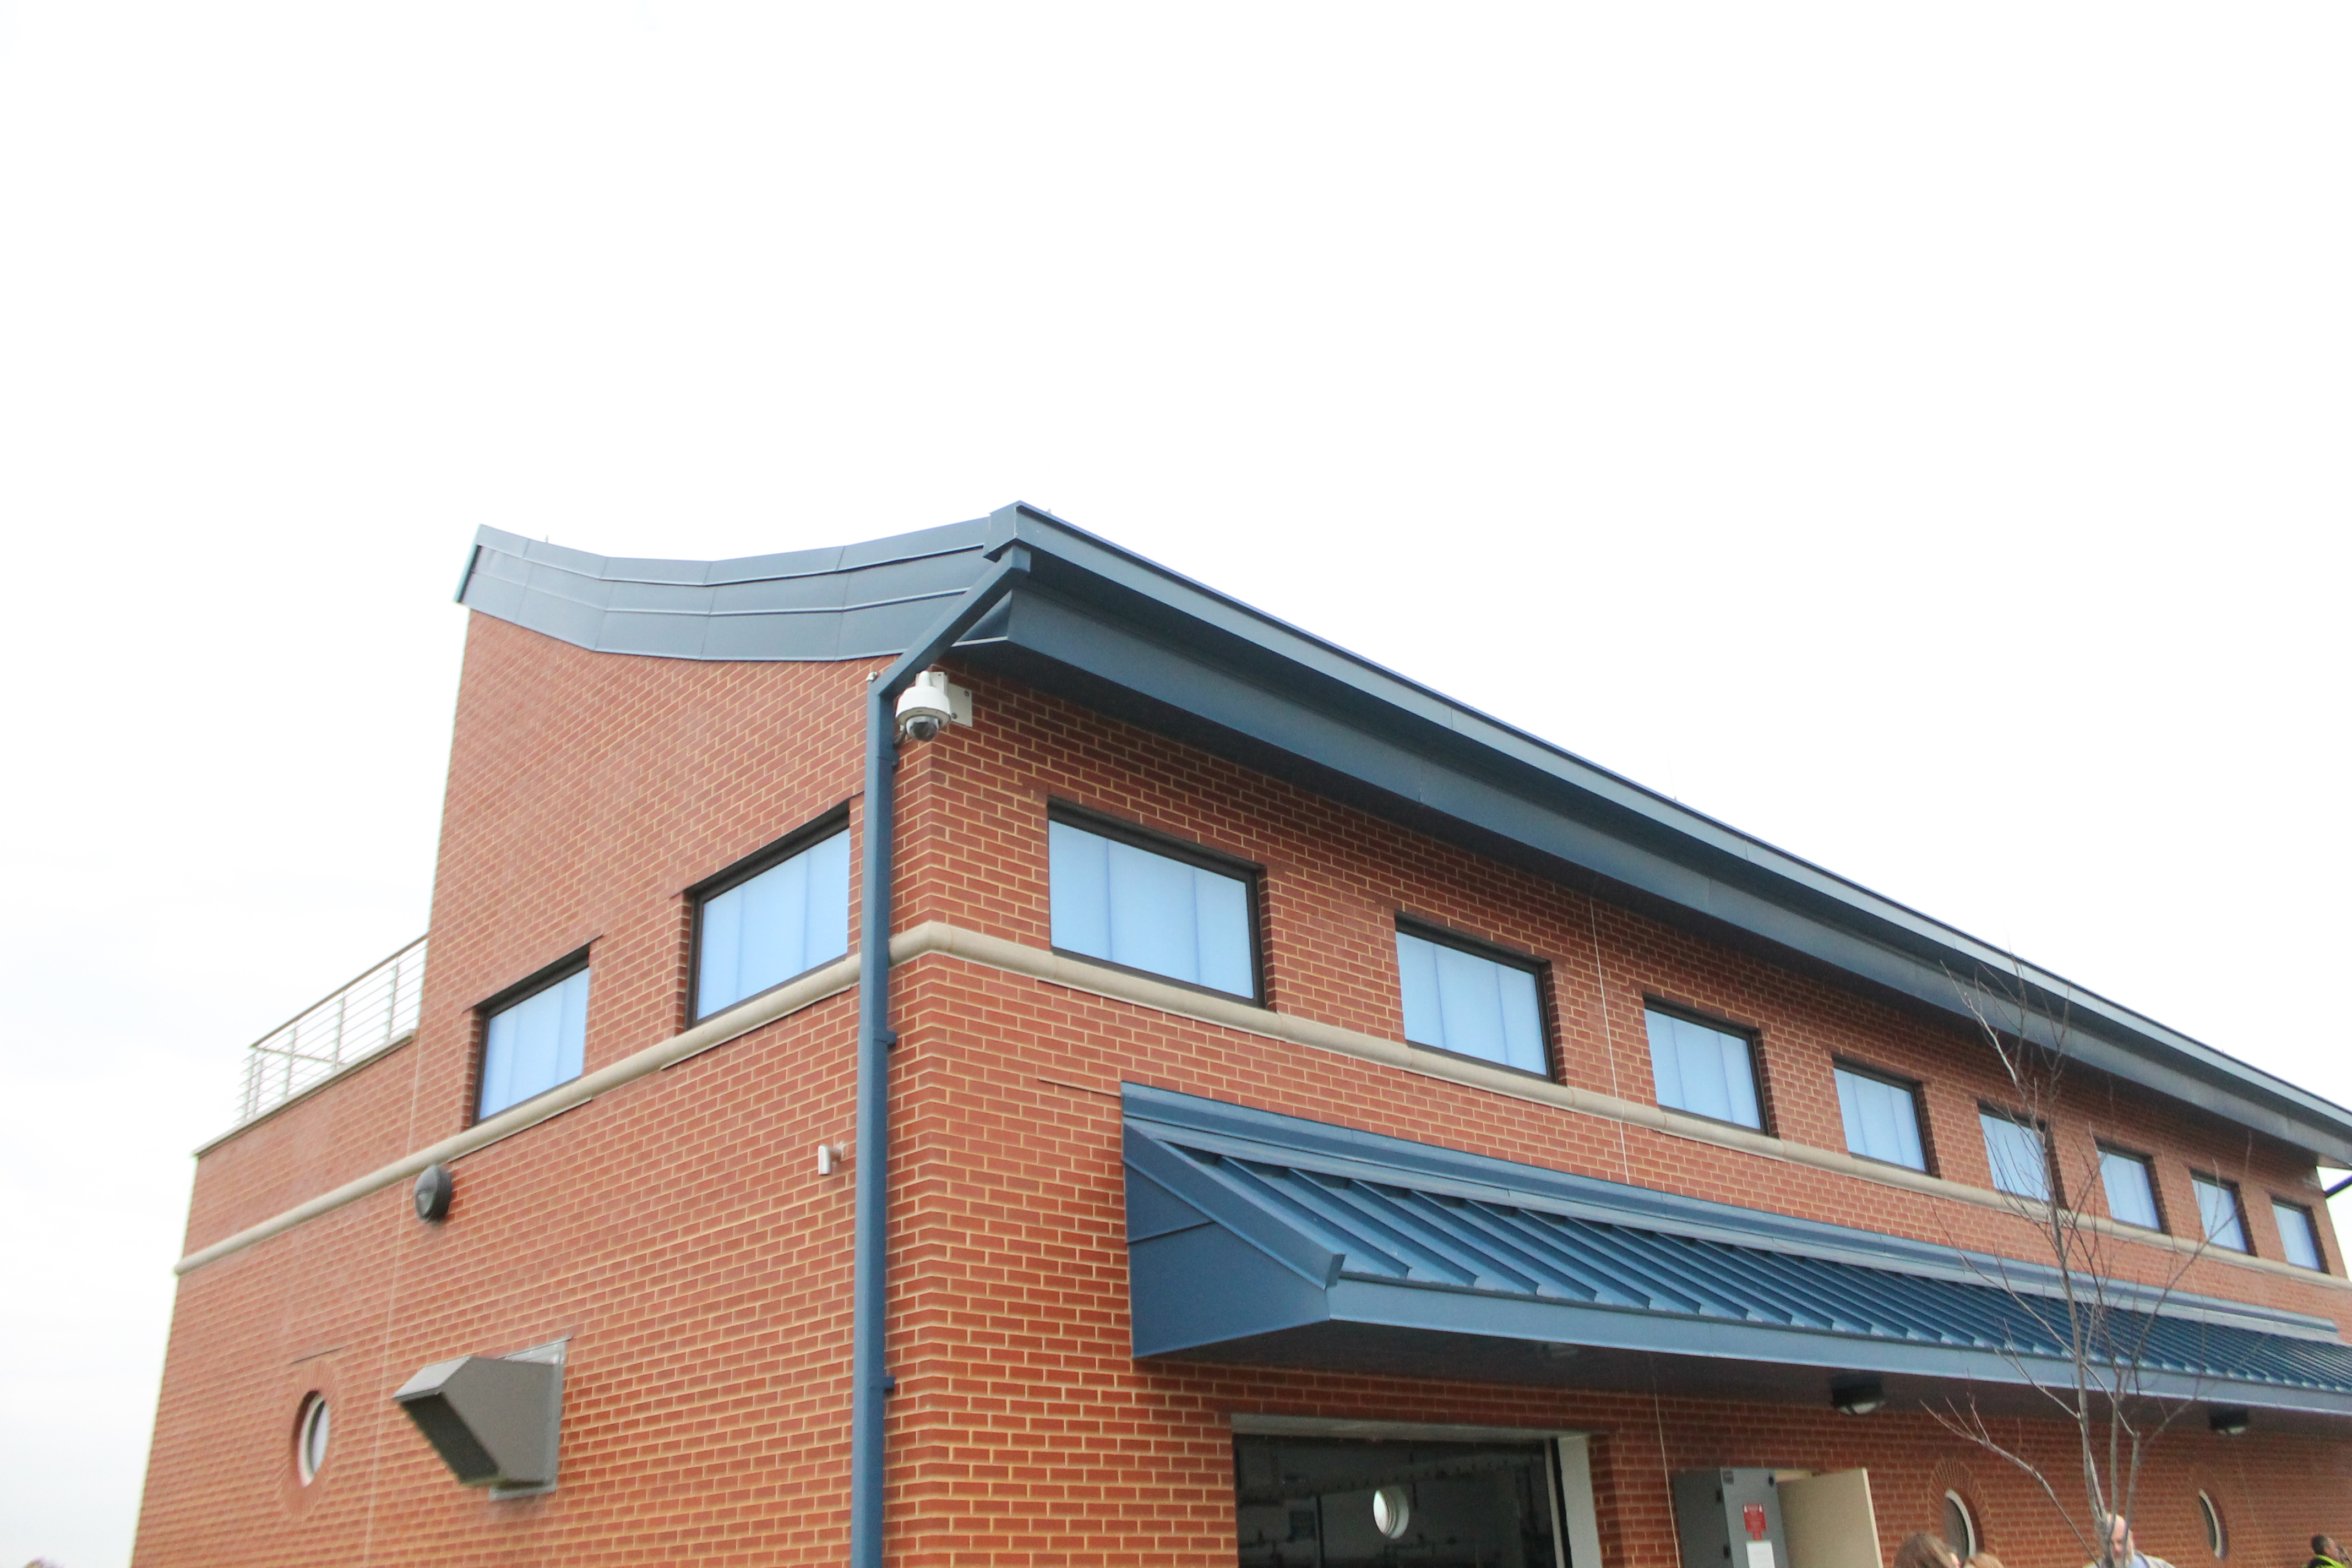
Two years into operation Metro’s solar powered high efficiency water treatment facility continues to work as designed by producing as much energy as it needs on-site to perform the entire subsurface water treatment process.
 According to Basil Borisov, Environmental Engineer at Metro’s Office of Environmental Management and Industrial Hygiene, “During the summer of 2016, the Largo Water Treatment Facility has been generating more power than it uses. The monthly surplus of electricity has almost reached 300 kWh; for comparison, a typical refrigerator uses 50 to 100 kWh per month. Excess electricity was generated on more than 25 days out of each month.”
Clean energy water treatment supporting a clean Bay – keep up the good work.
Here’s your chance to analyze and visualize the movements of the Metrobus fleet.
In anticipation of the upcoming Metro Hack Night, Metrobus planning staff has generated an automated vehicle location (AVL) systems data set. The data set, for five days in October, shows the time that each Metrobus was at each stop over the course of the day, the buses’ dwell time, and a comparison of actual stop time to scheduled stop time.

Real-time arrival sings at Metrobus stops around the region are powered by automatic vehicle location (AVL) systems on-board buses.
What can be done with this kind of data? Here are a few ideas:
- Look at how the running times for routes varies across the day
- Calculate vehicle speeds across the region
- Dive deep into on-time performance
- See how dwell times affect running times, speeds, and on-time performance
- Map the movements of Metrobus vehicles over time
- Get a better understanding of Metrobus operations, including how vehicles are interlined among routes and the number of different variations of some routes
Come on techies! Dive in and find new and inspirational ways to look at this data.
Please post links to your work in the comments!
Metrobus_AVL_Oct_2016.zip (319 MB zip file)
And some brief documentation:
Metrobus AVL Data Dictionary(.docx, 13 KB)


 According to Basil Borisov, Environmental Engineer at Metro’s Office of Environmental Management and Industrial Hygiene, “During the summer of 2016, the Largo Water Treatment Facility has been generating more power than it uses. The monthly surplus of electricity has almost reached 300 kWh; for comparison, a typical refrigerator uses 50 to 100 kWh per month. Excess electricity was generated on more than 25 days out of each month.”

Recent Comments