Metro does far more for the region than simply providing transportation. It also provides economic, social, and environmental benefits which contribute to the region’s health and vitality.
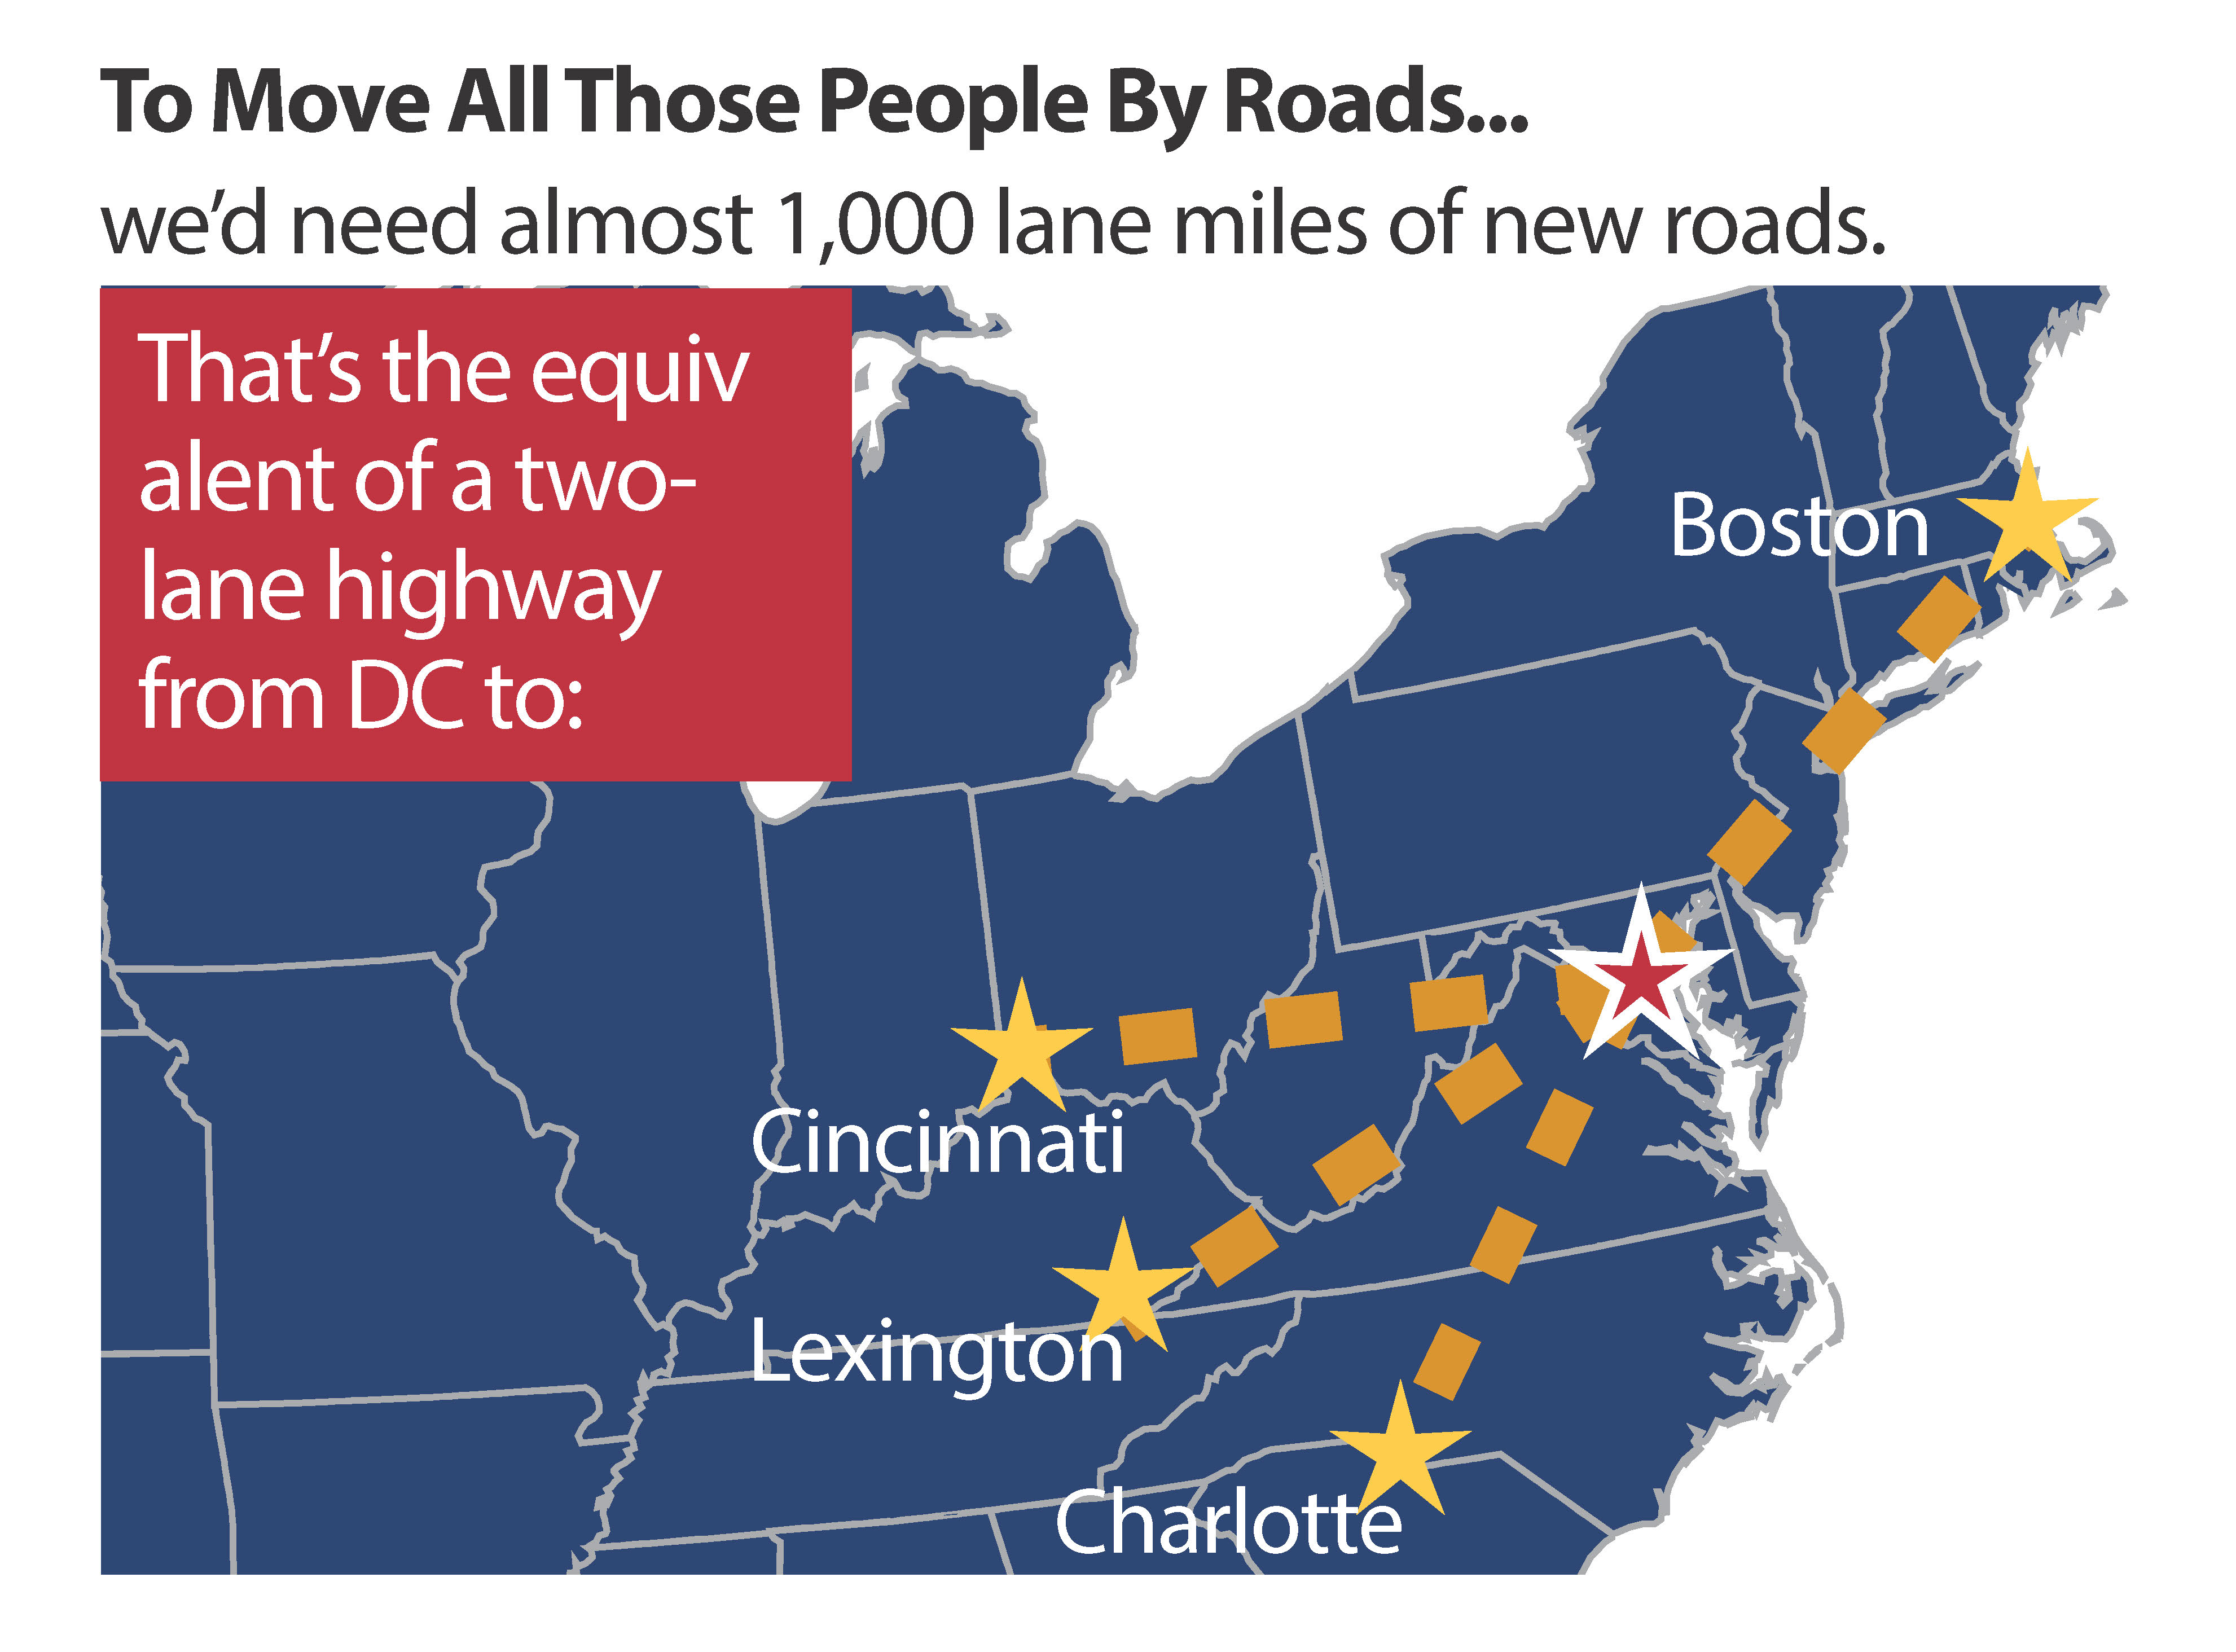
There would be one million more auto trips per day;
Congestion would increase by 25 percent;
All Potomac River crossings would need four to six additional lanes; and
Downtown Washington would require 200,000 more parking spaces, which is the equivalent of 166 blocks of five-story garages, at a cost of at least $4 billion (2012), excluding land.
Strategic planning is the process of determining what an organization does, where it wants to be and how it plans to get there. Organizations with well-defined strategic plans have the distinct advantage of clarity of common direction. It offers discipline, focus, and results-orientation, enabling the entire enterprise to focus its talents and energies and to measure achievements against expectations and potential constraints. At Metro, it also provides leaders clear direction for prioritizing decisions around improvements, investments, expansion, operations, and maintenance.
Metro needs a strategic plan for all of the above reasons and more. The organization is implementing hundreds of improvements to rehabilitate the system via MetroForward and instilling management discipline to the organization through the General Manager/CEO’s business plan. These efforts will have positive effects in the near term, but will be insufficient to prepare the system and organization for the challenges to come. Read more…
You’ve been diligently telling us what you think our priorities should be and we’ve listened. We’ve been hard at work putting the final touches on Momentum: The Next Generation of Metro and Metro’s Board endorsed the plan today.
Starting Monday, over the following 40 weekdays, we’ll be rolling out the most interesting parts of the plan in daily posts here on PlanItMetro.
Monday Posts: Preparing for Tomorrow’s Region Today
Tuesday Posts: Metro’s Importance to the Region
Wednesday Posts: Metro’s Recent Accomplishments and Public Engagement
Thursday Posts: Strategies and Priority Actions to Make this Vision a Reality
Friday Posts: Metro 2025 – Seven Priority Capital Initiatives
If you want to read and download either the full Momentum plan or the Executive Summary, go right ahead. But if you want to stop back for a daily dose of Momentum, don’t be shy. If you notice something that strikes your fancy, leave us a comment.
Regional support is important to making Momentum a reality! A number of regional stakeholders have already endorsed Momentum. Please sign on and add your name to endorse Momentum and send the message that public transit is vital to the National Capital Region.
PlanItMetro saw great interest in our last full data download of O/D data last year. We thought we’d provide an update with data from October of 2012. This enhanced data download contains the following files:
Full O/D trip data MS Access, including service type (weekday, Saturday, Sunday Special), travel period (AM Peak, mid-day, etc.), entry hour, Origin Station, Destination Station, rider class (full fare or discounted), media type (SmarTrip vs paper farecard), fare instrument type (stored value vs benefits vs pass), average travel time and average number of trips.
86 MB compressed zip file containing an MS Access Database
Subset of O/D trip data “No Details” CSV, includes all trips like the first file above but doesn’t include details on rider class, media type or fare instrument
418,759 rows of data, 34 MB
This dataset can be opened in Microsoft Excel 2007 and later
Metro, in conjunction with Traffax, Inc., recently hosted a Bluetooth traffic monitoring test at Fort Totten station. Bluetooth technology has been used for years now, for monitoring vehicular traffic. Specifically, it has been used to provide travel time and origin-destination data, mostly in vehicular settings. Some pedestrian monitoring has been tested as well.
For Metro’s recent pilot, Bluetooth traffic monitoring was used to study pedestrian movements within a multi-level environment. The hope was that the Bluetooth data captured could tell stories about pedestrian flow within the station (including vertical movement), the train dwell times, train volumes, and the transfer rate between the Yellow/Green and Red lines. The latter is an area that WMATA is most interested in, since it is difficult to predict how people will ride Metro when given options. In this case, do people prefer transferring between Red and Yellow/Green at Fort Totten or at Gallery Place? This kind of data would make it easier for WMATA’s planning staff to better serve its customers by understanding true crowding levels on trains at peak load points.
It was estimated that 1 in 20 passengers’ movements would be captured in the pilot. The Bluetooth data sensors were placed in backpacks that Traffax employees were wearing. This initial data collection test will be used primarily to develop appropriate methods for analyzing such data, and to see what potential the data has for WMATA.
We were made aware of this video entitled, “Metro: Here and Now.” Take a look:
The video contains footage on the initial operating segment of the Metrorail Red Line from Rhode Island Avenue-Brentwood to Farragut North, with a strip map including Dupont Circle as well as several shots of Metro Center. So we can surmise that Given some of the points made in the comments, the video probably dates from 1976 sometime in the period from 1975 – 1977, around the time that first rail segment opened in 1976. Aside from the interesting clothing and hairstyles of the time, one of the things that stands out is the operation of 2-car trains. This is difficult to imagine today, when 6-car and 8-car trains are the norm during all operating periods, and plans are being developed as a part of Metro’s Momentum Plan to operate 100% 8-car trains during peak periods.
Another interesting feature of the video is the landscape surrounding some of the stations. While the properties near Judiciary Square, with the DC courthouses, the National Building Museum, and Metro’s Jackson Graham Building appear mostly unchanged today, other station areas look different. At 8:44 in the video, you can see a train pulling into the (temporary) terminal station at Rhode Island Avenue. At 8:50, you can see the surface parking lots to the east of the line where a recently built joint development project now sits.
Metro planning staff understand that a picture is worth at least a thousand words, and often more. (And that a video is worth 1000 * 30 words per second.) As such, we are always looking to increase our ability to create compelling graphs, charts and video simulations.
Sample image of the Metrorail Ridership Visualization. Click the image to open the viz in a new window.
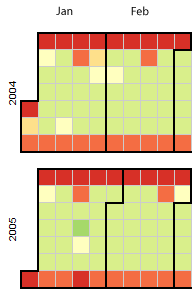
Metro planning staff recently attended a Mobility Lab Hack Day, where transit planners and data geeks intersected to share ideas and techniques for visualization of the volumes of data being made available by operators around the region. One of the visualization tools discussed was D3, a javascript library for creating “data-driven documents.” One of the online examples is for a calendar view that displays stock market data.
Each year is a horizontal stripe, sectioned off into months that go across. Both years and months are labeled.
The days within each month are transposed, so start at the left and read down, then move right. In the sample image, the leftmost column of January 2004 is the first week, with Thursday January 1 being the darkest red square. A graphical example is also displayed in the legend at the top of the visualization.
Each day is colored according to the ridership on that day, with darkest red being the smallest range (0 to 99,999) and the darkest green being the highest range (greater than 1,000,000).
If you move your mouse pointer over any individual day, a small “tool tip” appears showing the date and the ridership for that day, rounded to the nearest 1,000.
Fare table showing peak-of-the-peak pricing, in effect from August 2010 to June 2012
In a recent post we described how Metrorail fares are calculated. The previous post noted that Metro’s Fare Policy Principles have established guidelines for how fares are structured. When it is time to evaluate changes to Metrorail, Metrobus, and MetroAccess fares, Metro staff revisit the fare policy principles to look for guidance.
Metro Fare Policy Principles, adopted November 18, 2010:
Ensure and enhance customer satisfaction;
Establish a mechanism to allow customers to determine their fares easily;
Optimize the use of existing capacity;
Establish equitable fares and ensure compliance with federal regulations;
Facilitate movement between modes and operators throughout the region;
Encourage the use of cost-effective media;
Generate adequate revenue while maximizing ridership;
The challenge for Metro staff is to explore fare concepts that strike balance between the different principles. For example, Metro uses surcharges to encourage use of SmarTrip™ which is our most cost-effective fare media (principle #6), but the surcharges provide challenges to easily determined fares (principle #2).
Note that Metro’s distance-based fares are considered more equitable than flat fares. Average income increases with distance from the core in the Washington region, so a flat fare would result in the highest per-mile fares for those groups who are the least able to pay them. Metro’s Board of Directors understands this and has emphasized fare equity (principle #4) as one of its top priorities.
Many other aspects of the current bus, rail and paratransit fares reflect these principles:
Surcharges for not using SmarTrip™: Metro charges $1 per trip for using paper farecards on rail and $0.25 per trip for using cash on the bus. These surcharges have helped push usage of SmarTrip™ up to about 90%, resulting in the reduction of fare collection costs.
Different fares on different levels of service: Metro charges $1.60 base fare for local and MetroExtra services. Buses that travel long distances on freeway lanes cost users a higher fare ($3.65) to correspond with the greater travel speeds. Metro’s longest distance bus routes, which travel to Dulles and BWI airports, charge a $6 fare per trip.
MetroAccess fares are priced at twice the fixed route fare with a cap at $7. This fare structure is intended to encourage use of the existing fixed route capacity Metro offers, which are available to MetroAccess-eligible customers free of charge.
The peak-of-the-peak (POP) rail fare surcharge, enacted in August of 2010, charged customers an extra $0.20 to enter the system during the peak 90-minute periods during the AM and PM peak. This surcharge was another example of using fares to “optimize the use of existing capacity.” However, riders informed Metro this fare concept impacted fare policy principles #1 and #2, customer satisfaction and allowing customers to easily determine fares. In the end, these two policy principles won out and the POP surcharge was eliminated starting July 1, 2012.
What fare concepts might help better align Metro’s fares with the fare policy principles? What ideas have other agencies implemented that you’d like to be considered for Metro?


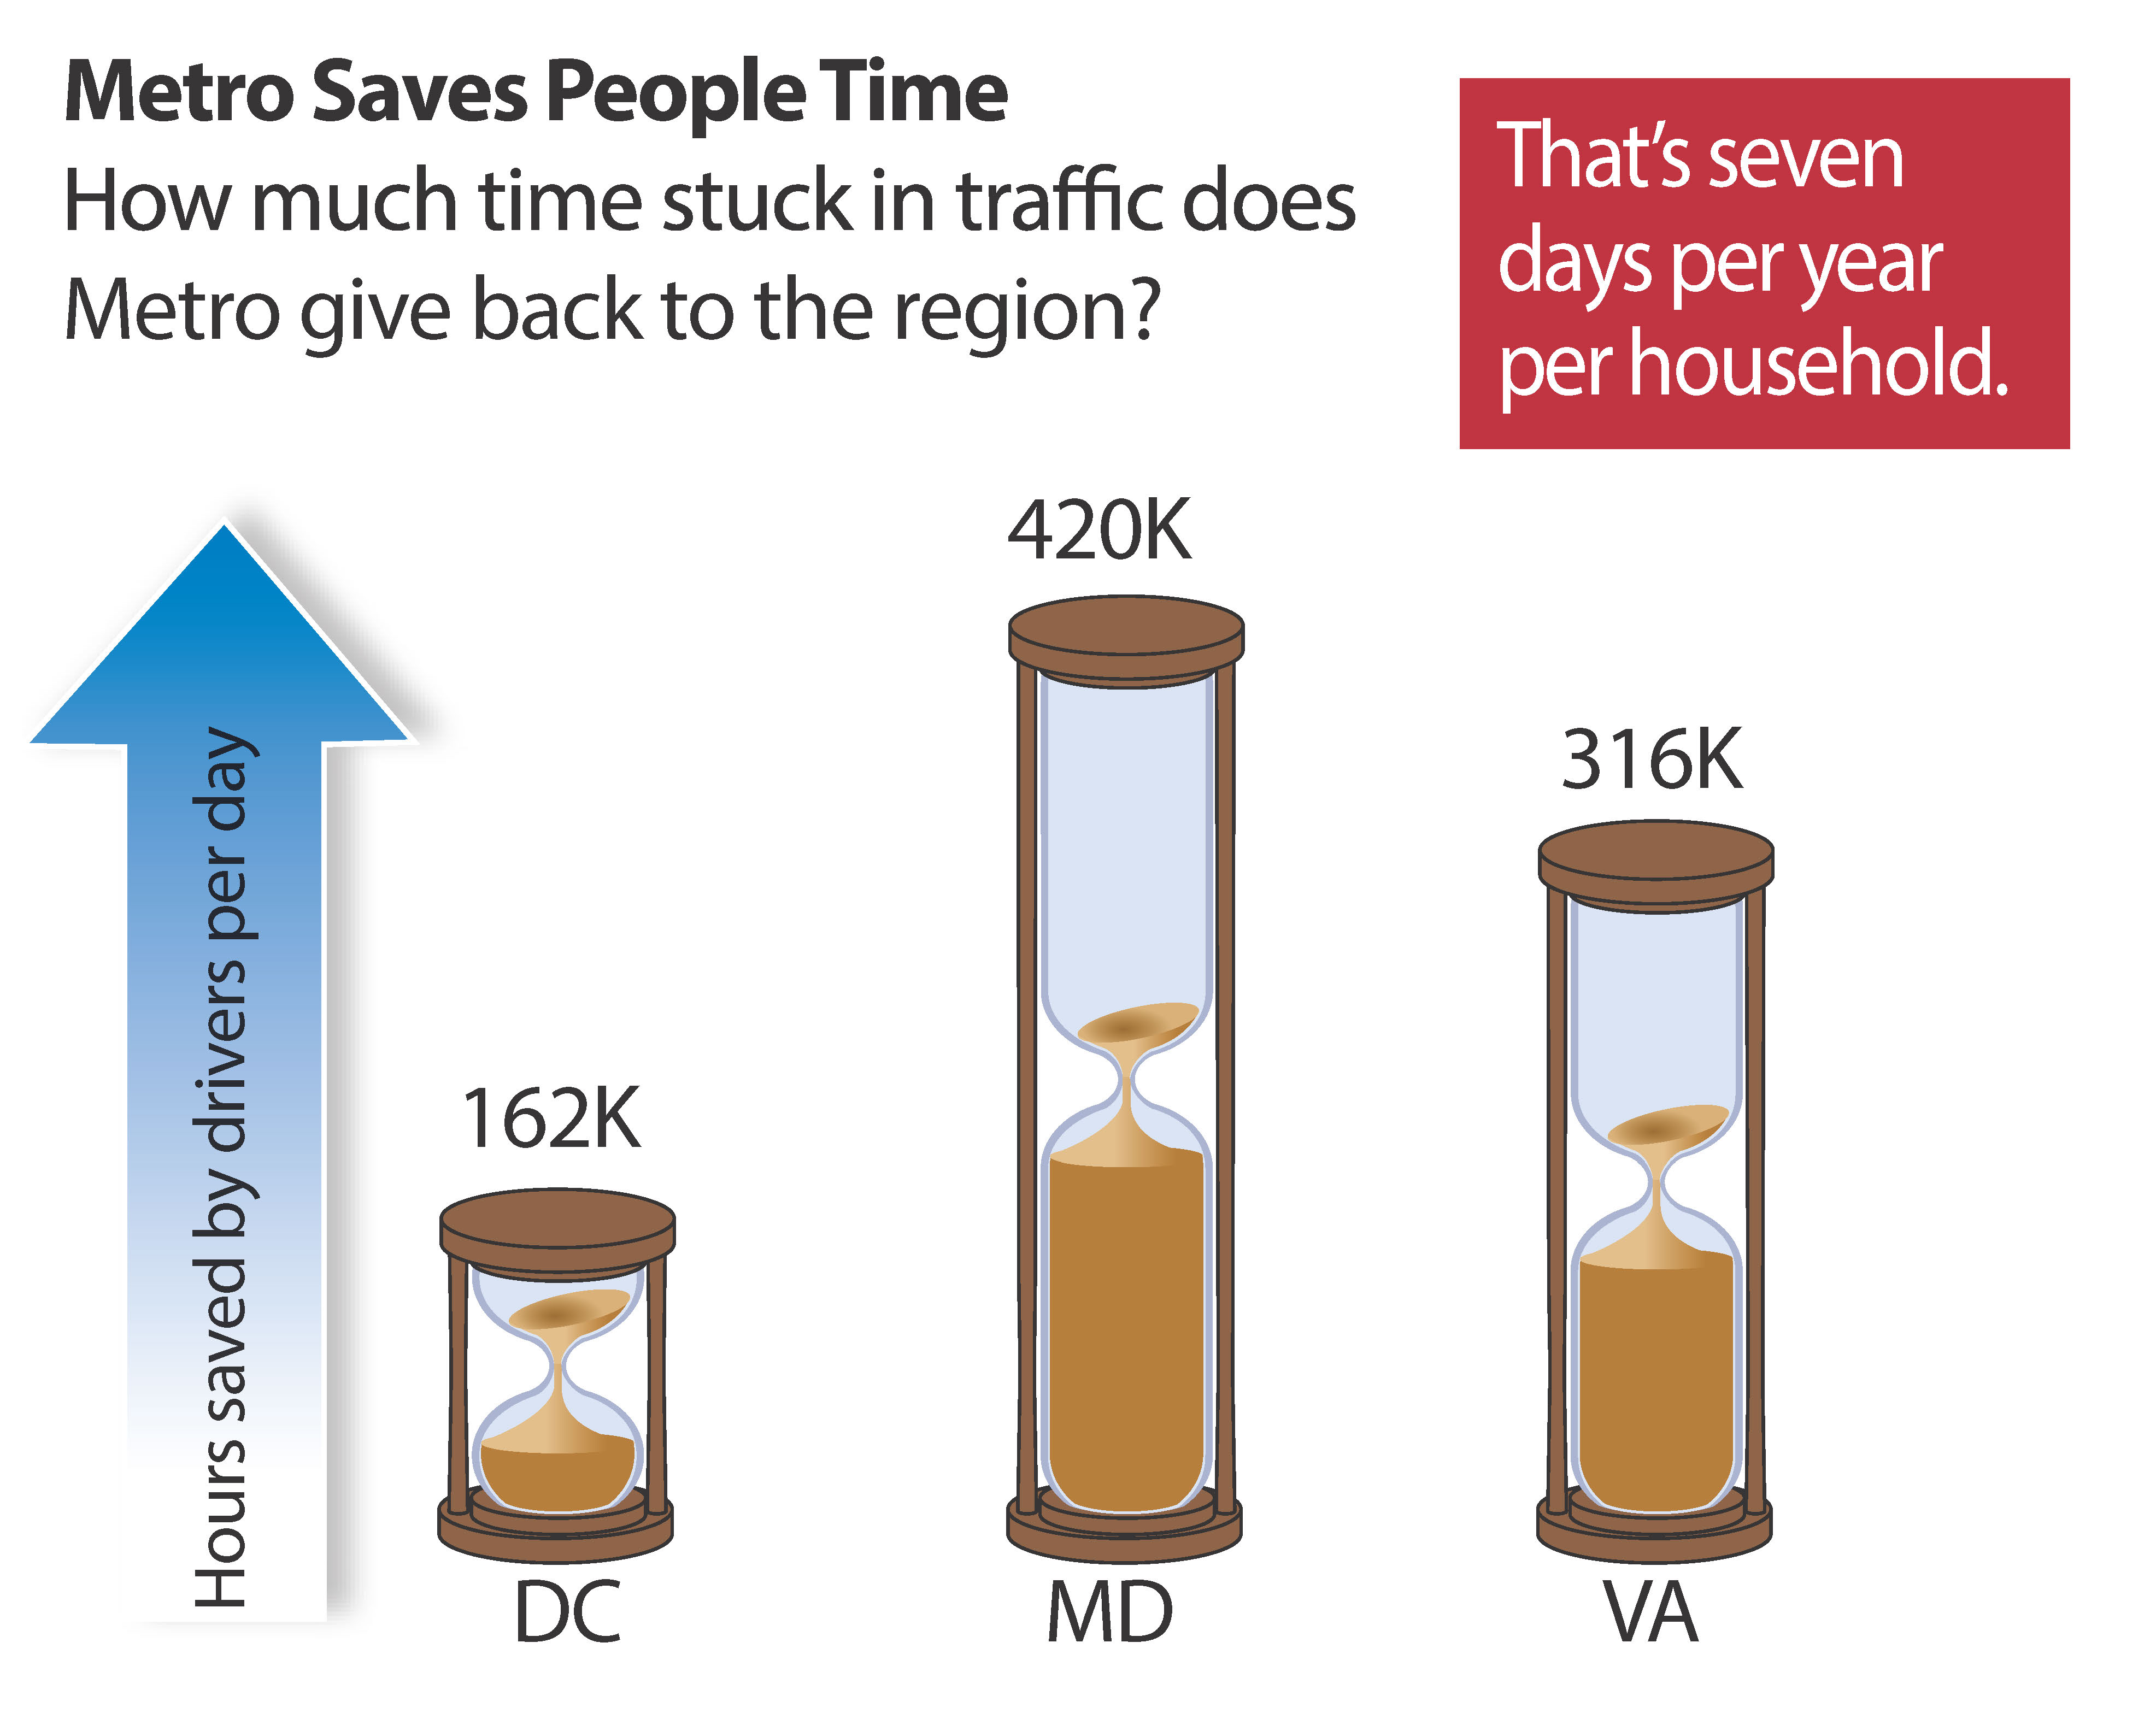 Metro does far more for the region than simply providing transportation. It also provides economic, social, and environmental benefits which contribute to the region’s health and vitality.
 PlanItMetro saw great interest in our last


Recent Comments