Posts Tagged ‘rail ridership’

Growth Mode or Stuck in Neutral? Or Both?

June 27th, 2016 2 comments

Population and jobs are up, but regional travel is down – Why? The very nature of trip-making may be changing in this region.

Crystal City Sta -am Rush 060912-129
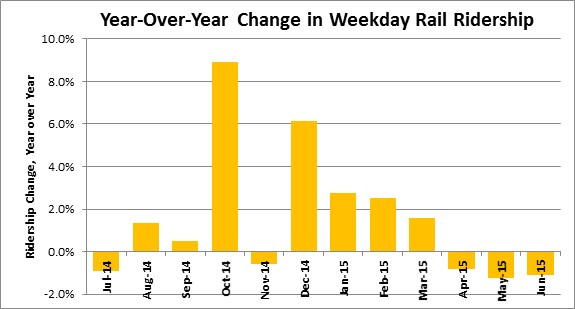
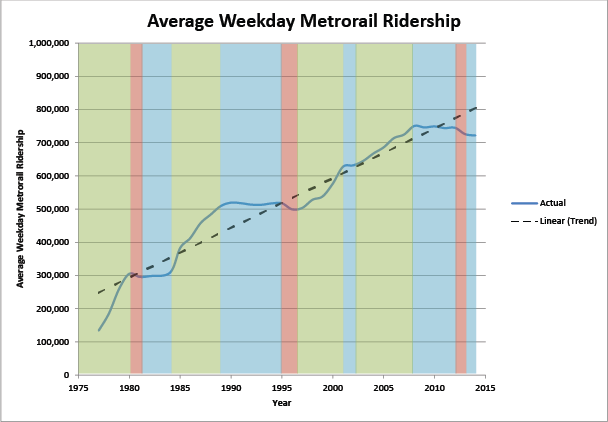
For several years, we have been reporting internally and externally about declines in Metrorail ridership. Our most recent rail ridership numbers show continued patterns of ridership levels that are five to eight percent below its 2009 peak, and despite gains in March, the trend in April and May suggests that the ridership patterns that we are seeing now are more structural than cyclical.  The implication here is that Metrorail may be operating at a “new normal” level that is still poised for growth, but growing from a baseline that has been reset at a lower level.

Theories abound about why this is taking place – telework and rail reliability are among the most talked-about culprits – but it’s almost impossible to isolate one cause among many in a time period that also witnessed fare increases, gas prices drop to historically low levels, and wild variations in the Federal transit benefit.

Now we have new information that may present a compelling theory about the declines in Metrorail ridership – the region is making fewer and fewer tripsData recently released by our Transportation Planning Board depicts a startling story of this region’s travel patterns over the last decade or so.  This data tell us that despite economic factors that would normally portend increased trip-making – rising population, household, and employment growth – this region is actually seeing fewer trips overall, regardless of mode. Read more…

Rail Ridership Data to Help the Region Plan for SafeTrack

May 27th, 2016 3 comments

To help the region and our partners plan alternatives and mitigate the impacts of SafeTrack, Metro releases rail ridership data applicable to this important maintenance effort.

SafeTrack example 2Rail Link Volumes: This data describes the number of customers on board trains between two contiguous stations, for a given hour of the day, then assigned to rail links.  For example, the link volume from Bethesda to Friendship Heights is the sum of everyone who boarded upstream, minus those who exited at or before Bethesda. This can be useful for planning SafeTrack mitigation efforts because it gives a first-order estimate of the potential demand for a bus bridge, for example.

Online Interactive Map of Metrorail Link Volumes, average weekday and Saturday in May 2015

Metrorail Link volumes, average weekday in May 2015, by hour, by line color (580kb, .xlsx)

Read more…

Ridership Before and After the Blizzard of 2016

February 22nd, 2016 3 comments

What happens to ridership when a major snowstorm closes Metro?

The blizzard at the end of January dumped around two feet of snow on the Washington region over the course of a few days, making it the fourth-largest snowstorm in D.C. in over a century. To protect equipment, for the safety of employees and riders, and to focus on cleanup efforts, Metro ceased all operations for over three days. The Federal Government and schools were closed.

The chart below tells the story of the blizzard from a ridership perspective.  Actual bus and rail ridership by hour is shown as blue and red, with the orange dotted line showing a typical pattern from two weeks prior in January.

image012

Even before the snowflakes began falling on the afternoon of Friday, January 22, Metro’s ridership was impacted. That day, riders adjusted their normal routines by staying home, teleworking, or leaving early. The morning’s peak was half of normal. By Friday night, bus and rail operations ceased. No service operated Saturday or Sunday. Very limited bus and rail service was offered for a few hours on Monday, January 25 as cleanup and recovery began. Fares were not charged on rail, so we recorded very few transactions.

We recovered gradually on Tuesday and Wednesday, and nearly fully by Thursday, even as many school systems remained closed.

In the end, total ridership losses were estimated to be about 2.9 million boardings over five days, 1.6 million on rail and 1.3 million on bus. Bus took a proportionately bigger hit than rail given service restrictions from icy and unsafe road conditions.

What do you see in these numbers? Also, feel free to download the underlying data (.xlsx, 40kb) for yourself.

Brookland-CUA Station Rises to the Challenge of Papal Proportions

October 5th, 2015 1 comment

Brookland-CUA station enabled over 24,000 trips for visitors attending the papal events at the Basilica on Wednesday, September 23, 2015. 

Brookland-CUA Metro station in Washington The Basilica of the National Shrine of the Immaculate Conception on the Catholic University of America campus is in the background. Photo Credit: AgnosticPreachersKid at English Wikipedia

Metrorail can handle crowds for most events downtown where the demand can be shared across a variety of stations and lines.   The papal mass at the Basilica of the Shrine of the Immaculate Conception, however, required a little extra planning.  The Secret Service was in charge of the regional planning of the event, and as the event approached Metro staff became aware the event would have a ticketed attendance of 25,000 people and that an additional 15,000 people might amass outside the venue to watch the ceremony on the jumbo-trons and try to catch a glimpse of the Pope on his way in and out of the area.  Preparing to enable safe and efficient trips for up to 40,000 customers at a station with one of the smallest capacities in the system required some extra effort. Read more…

Metrorail Ridership – Back on Track

July 21st, 2015 Comments off

Metrorail ridership stabilized in FY 2015, and that’s exactly what we said would happen.

We’ve seen from previous posts that total Metorail ridership had been experiencing its cyclical swoon following the housing bust and economic collapse of 2008.  Despite the volatile market, system ridership stabilized over the last few years – this past year may mark the beginning of the next phase of Metrorail ridership growth.  In Fiscal Year 2015, average weekday Metrorail ridership grew by just over 1.5%.

Ridership

The biggest swing of course is the difference in October: in October of 2013, we experienced the ridership loss due to the prolonged Federal Government shutdown; that didn’t happen in October of 2014.  Another interesting difference is that in FY 2014 there were five snow days during the winter, compared to only two snow days during the winter of FY 2015.  So, even when discounting the October effect, ridership was still up slightly year over year – a good sign for Metro and the region that helps support its services! And of course, the new Silver Line stations are helping to drive growth as well.

Meanwhile, we are continuing to experience strong growth in Metrobus routes where we have executed operational innovations.  Metro stands ready to work with jurisdictions and replicate these successes elsewhere.

This isn’t the end of the story.  The region’s pipeline of transit oriented development is going to accelerate this ridership growth, and in the next post we’ll provide just one example by detailing the expected ridership impacts of the exciting new project proposed for Rhode Island Avenue.

Categories: Engage Tags: , ,

Where Are Those Rail Riders Going?

May 12th, 2015 4 comments

Ever wonder where rail riders are going to and from? Here’s a map that shows you.

“What are the destinations of riders at Station X?”  It’s a question we get often here. Well, using October 2014 rail ridership data by origin and destination, it’s pretty easy to answer that question – click below for an interactive map.

OD Rail Viz preview

Click for a larger, interactive version of Metrorail ridership information by origin and destination station

Metrorail Ridership Projections – Looking Ahead

March 11th, 2015 8 comments

Historical data and regional growth projections tell us one thing – Metrorail ridership will rebound and grow right along with the region, and the system better be ready to carry the load.

Crystal City Sta -am Rush 060912-129

Metrorail riders enter and exit Crystal City during the AM rush hour, June 2012.

Local ridership trends that seem to defy a national boom in public transit usage give some pause about the need for planned transit expansion projects.  It’s no surprise that even the most ardent of transit supporters might be caught flat-footed when trying to defend infrastructure investments against the backdrop of scarce funding.  Some have even gone so far as to question whether Metorail ridership, which just a few years ago looked poised to eclipse 800 thousand trips per average weekday, is experiencing more of a structural downshifting and may experience flat or even declining ridership for the foreseeable future.

All of this debate is understandable in a town obsessed with statistics and “horse race” leaderboards.  But when it comes to economics, demographics, mobility, and infrastructure, regional leaders need to look beyond the numbers d’jour and bet on a sure thing – Metro ridership will go up.  Here’s why:

1. Short-term snapshots of rail ridership miss the forest for the treesOr maybe even just leaves.

The graph below shows Metrorail average weekday ridership from the beginning of Metrorail. You can see that ridership grew in the first five years as the system grew from just the Red Line and four stops in 1976 to adding Orange and Blue Lines in operation by 1980. And after all of that expansion was completed, something fascinating took place – ridership declined and essentially flatlined until 1985. During that time, the region didn’t stop investing in Metro. On the contrary, during that same time period Metro built the Yellow Line and extended the Red Line from Downtown into Upper NW DC and then all the way to Shady Grove. Ridership shot up again in the late 1980s while Metro extended the Orange Line to Vienna and the Red Line to Wheaton then flat-lined and even declined through the mid 1990s, all while Metrorail added capacity on Yellow and Blue and (finally) opened up the Green Line. From 1997 through the late 2000s Metrorail saw robust ridership increases despite minimal capacity increases – largely reflective of the underlying economic and demographic resurgence of the central city and its urbane suburbs – and ridership flat-lined in tandem largely with the economic collapse of 2008 and the prolonged Great Recession.

ridership_chart_v2-01

Read more…

Metrorail Data Download, October 2014

January 26th, 2015 26 comments

This new data download from October 2014 includes ridership from the five new Silver Line stations.

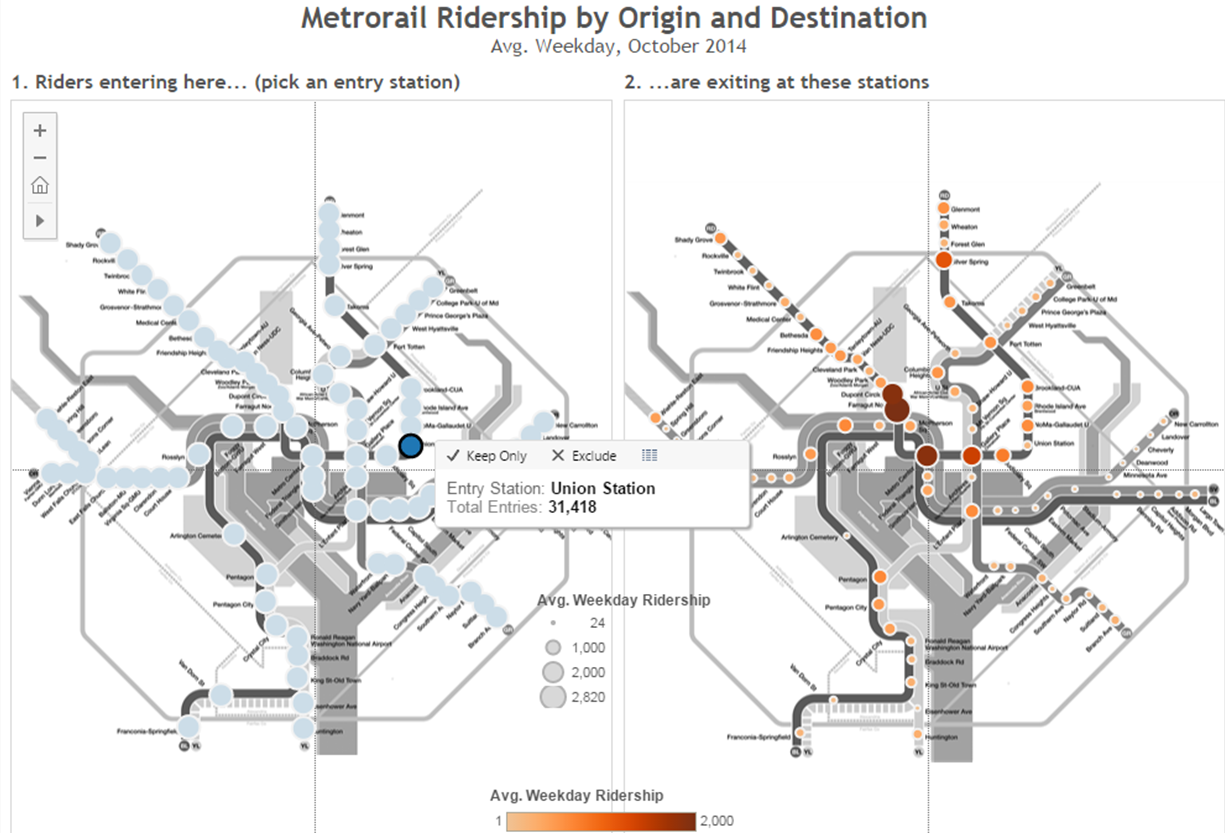
Over the past few years we’ve been making ridership data available for download and analysis by the online community.  We have received some requests for full origin-destination (O/D) data sets that include the new Silver Line ridership.

These data sets include ridership from October of 2014, and are available by period (AM Peak, midday, etc.) or by quarter-hour interval, for all stations including the five new Silver Line stations.  Both sets include daily averages for weekdays, Saturdays, Sundays and Columbus Day.

Note, the quarter-hour data file is to big to open in Microsoft Excel.

Have fun playing around with this data and let us know in the comments what you find.  Make sure you check out  the other assessments of Silver Line ridership  we’ve done.

Jan 29, 2015, 10:00 AM Update:  Files have been updated to include total and average travel times for each station pair.

Feb 02, 2015, 11:00 AM Update:  Files have been updated to separate Columbus Day from Saturdays using a new column “Holiday”.


The Drop in Transit Benefit Has Effectively Been a 20% Cost Increase for Metrorail Riders

November 6th, 2014 9 comments

The drop in the federal transit benefit is making Metrorail riders feel the pinch in their wallets, and it’s hurting ridership.

What’s happened to ridership since the benefit changed? You may have seen in the news that Metrorail riders have been heavily impacted by changes in federal tax law that discourages transit usage.  The maximum amount of SmartBenefits dropped from $240 to $130 per month in January, and since then:

  • Since the change, our traditional commuter market – full-fare customers who travel from suburban stations to the core at peak times – has fallen by about 1.5%.
  • Trips shorter than 4 miles – more likely to still be fully subsidized – are unchanged.
  • Customers able to get through the month on SmartBenefits alone are down 25%, while customers who must supplement with their own cash have doubled, and the net result has been a 10% loss in trips from this key commute market.
  • 75% of this ridership loss has been from trips over 7 miles: at an average fare of $4.10/trip equating to $165/month and up, these longer commutes now require substantial out-of-pocket contributions.
  • The average impacted SmartBenefits customer must now pay $0.84 extra per trip – this is the equivalent of a 20% fare hike.
    • For riders directly subsidized by the federal government, this was increase of nearly $2.40 per day, or over $54/month.
    • For riders setting aside pre-tax dollars, this felt like a 10% fare increase.
  • Trips paid for with SmartBenefits have dropped 1%.

Change in Ridership by SmartBenefits Class v2

The decrease in the federal transit benefit has hurt Metrorail ridership in the last year. Ridership is up from customers who are unaffected by the policy change, but more people must supplement with out-of-pocket contributions to make it through the month, and in the process Metrorail is losing trips.

How do you know it’s not something else? Ridership could be down for a variety of reasons, and we continue to mine the data for other patterns – from the economy to demographics to fares. We can’t pin all of the ridership loss on the federal transit benefit, but the losses have been concentrated on SmartBenefits users. In addition:

  • Ridership from commuters not enrolled in SmartBenefits has actually grown by 2% in the last year.
  • We are still investigating, but customers do not appear to be reducing travel much due to telework. Metrorail has been losing both customers and trips (not just trips), and trip frequency among commuters is mostly stable.
  • In fact, we are gaining riders at stations with recent transit-oriented development, and ridership is up 3% at stations along the Green Line in D.C., the Red Line in Northeast D.C., and Courthouse/Clarendon in Arlington.

We continue to study the trends, and for a second glance see our more detailed summary of ridership trends (PDF, 710K).