Delivering the transit system that the region needs will require an unequivocal commitment of additional resources from internal and external stakeholders. Simply put, the rehabilitation work being accomplished at the time of the writing of this document will not be nearly enough to keep up with the region’s needs, and without additional resources it will be unlikely that the region can continue to enjoy a transit network that contributes to competitiveness and makes the Washington metropolitan area one of the most desirable places to live and work.
Metro – Doing Business Differently
Metro recognizes that rebuilding the region’s transit system also means rebuilding the region’s transit authority – and will continue to be hard at work on this task in preparation for the implementation of Momentum. In the near term this means revamping nuts and bolts elements of the authority, including but not limited to: identifying ways that Metro can do its job more efficiently while increasing performance; evaluating its contracting and procurement philosophy to emphasize lifecycle contract and asset management; engineering a budgeting process that allows Departments to strive to achieve the goals of Momentum within the context of tight fiscal and financial discipline; and a human capital strategy that must have the right talent in-place and in-queue. In the long term, this means completing the journey to a much more business-like operating and execution philosophy for the organization.
Adding special types of tracks at key locations in the system will provide more flexibility to the overall system.
Pocket tracks: allow trains to turn back in the direction from which they came (short-lining), gap trains to be stored until placed in revenue service, and the staging of track equipment until nighttime trackwork
Crossovers: allow trains to single track during incidents or nighttime trackwork
Purpose and Need
The Metrorail system includes various single- and double-crossovers and additional ones will shorten the distance of single tracking. The system also has seven mid-route turnbacks, each of which is configured to operate as a third or “pocket” track capable of storing an eight-car train. To improve efficiency and reduce operating costs, certain lines could utilize a pocket track for a “short-lining” turnback to provide improved service to the highest-demand segments of the line. Other new pocket tracks would allow for storage of gap trains, disabled trains and track equipment. Read more…
Walk access to Metrorail has increased 15% over the last 5 years, especially from those living within a half-mile of the station.
So more rail riders are choosing to walk to their Metrorail station, according to the 2012 Metrorail Passenger Survey. But who are these pedestrians?
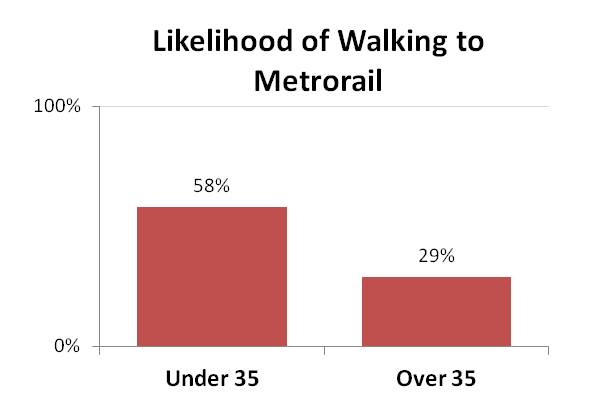
Around 40% of Metrorail customers in the AM peak walk to the station. The survey found that younger people are much more likely to walk, with those under 35 were nearly twice as likely to walk to the train as those over 35:
However, younger Metrorail riders are also more likely to live within walking distance of their Metrorail station. Half of all riders under 35 live within a half-mile Metrorail, while 22% of those over 35 do. Younger people in our region generally are slightly more likely to live near Metrorail – 15% of everyone under 35 in the region lives within a half-mile of Metrorail, 12% for those over 35. The chart below shows how younger riders tend to live closer to Metrorail: Read more…
Walk access to Metrorail has increased 15% over the last 5 years, especially from those living within a half-mile of the station.
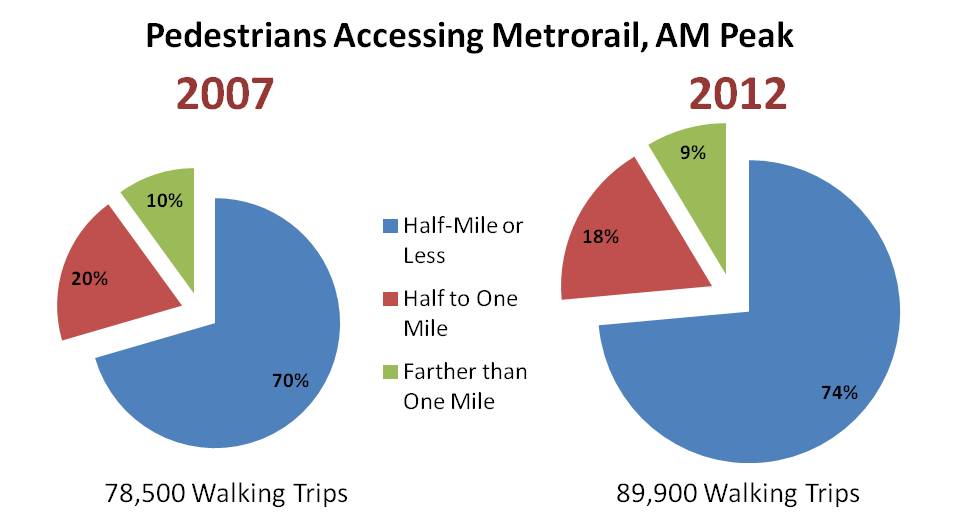
More and more Metrorail riders are lacing up their walking shoes and taking a short walk to their rail station these days. According to results from the 2012 Metrorail Passenger Survey, the number of passengers walking to Metrorail each morning grew by 15% between 2007 and 2012, from 78,500 to 89,900 in the AM peak period – far outpacing overall growth in ridership in the same period.
Where are all the new pedestrians coming from? From stations all over the network, but the growth is strongest among those walking a half-mile or less. Those walking from less than a half-mile rose by over 20% – faster than the overall growth in walk access.
Walk access to Metrorail has increased 15% over the last 5 years, especially from those living within a half-mile of the station.
This video of the Vancouver SkyTrain (Expo Line), then (1986, in time for Expo 86) and now (2012), was making the transit news rounds.
We thought we’d share it, because it reminded us of Arlington, and the growth that’s occurred since the Orange Line opened there in the late 1970s. If the Orange Line was above ground, then someone could’ve made a similar video! In the meantime we’ll have to stick to pictures to compare how the landscape has changed since the introduction of the Orange Line. High rises sprouting up and general development with the addition of rail is the common theme here.
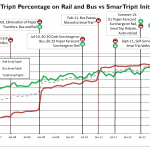
Metro first rolled out SmarTrip® on rail in 1999, breaking new ground as the first contact-less smart card used for transit in the United States. Metro began rolling out SmarTrip® on bus in 2002 and then to Metrorail parking facilities in 2004. While the utility of SmarTrip® was immediately obvious to many customers, others required a bit of encouragement to switch to the fare media that is most cost-effective for Metro and customers alike.
Usage of SmarTrip® on rail has been growing steadily since its launch, but use on bus seemed to plateau around 20% on bus starting in about July 2006 until about January 2008. That was the date when Metro began its first major initiative to encourage people to move to SmarTrip by implementing a $0.10 surcharge for using cash on bus.
Since then, Metro has rolled out new SmarTrip features and additional incentives to continue the increase in SmarTrip use rate.
The chart below illustrates the changes in SmarTrip use rate on both bus and rail, overlaid with the dates of the initiatives and feature releases that helped motivate customers to switch to SmarTrip. The usage rate now is nearly 90% on both bus and rail! Read more…
Metro planning staff have been working to showcase Metro data in new and unique ways. We recently posted a visualization in a calendar format that displayed 9 years of rail ridership in one graphic. We are currently working on animations of ridership data as well. Below is our first volley into that arena, a visualization of one day’s worth of station-level activity in 15-minute intervals.
Before hitting play, please note the following:
The video is available in high definition (720p), which is the recommended viewing resolution.
The dots are sized according to total station volume (entries plus exits) per 15-minute interval.
The color of the dot represents what percent of the volume is entries vs exits. Magenta dots are 100% exits, blue dots are 100% entries, and purple dots are 50/50, with other colors representing ratios between these three.
The visualization is of data from April 10, 2013, which hit the 4th highest ridership mark that day. A combination of cherry blossom peak bloom and two sporting events ratcheted ridership up to 871,000 for the day, compared to an average weekday ridership of around 750,000. Note the high level of activity at the Smithsonian station all day long, and big dots that grow and shrink as the sports games begin and then end near Gallery Place and Navy Yard-Ballpark stations.
What other unique activity can you spot in this animation? What other types of animations of Metrorail and Metrobus would be informative?
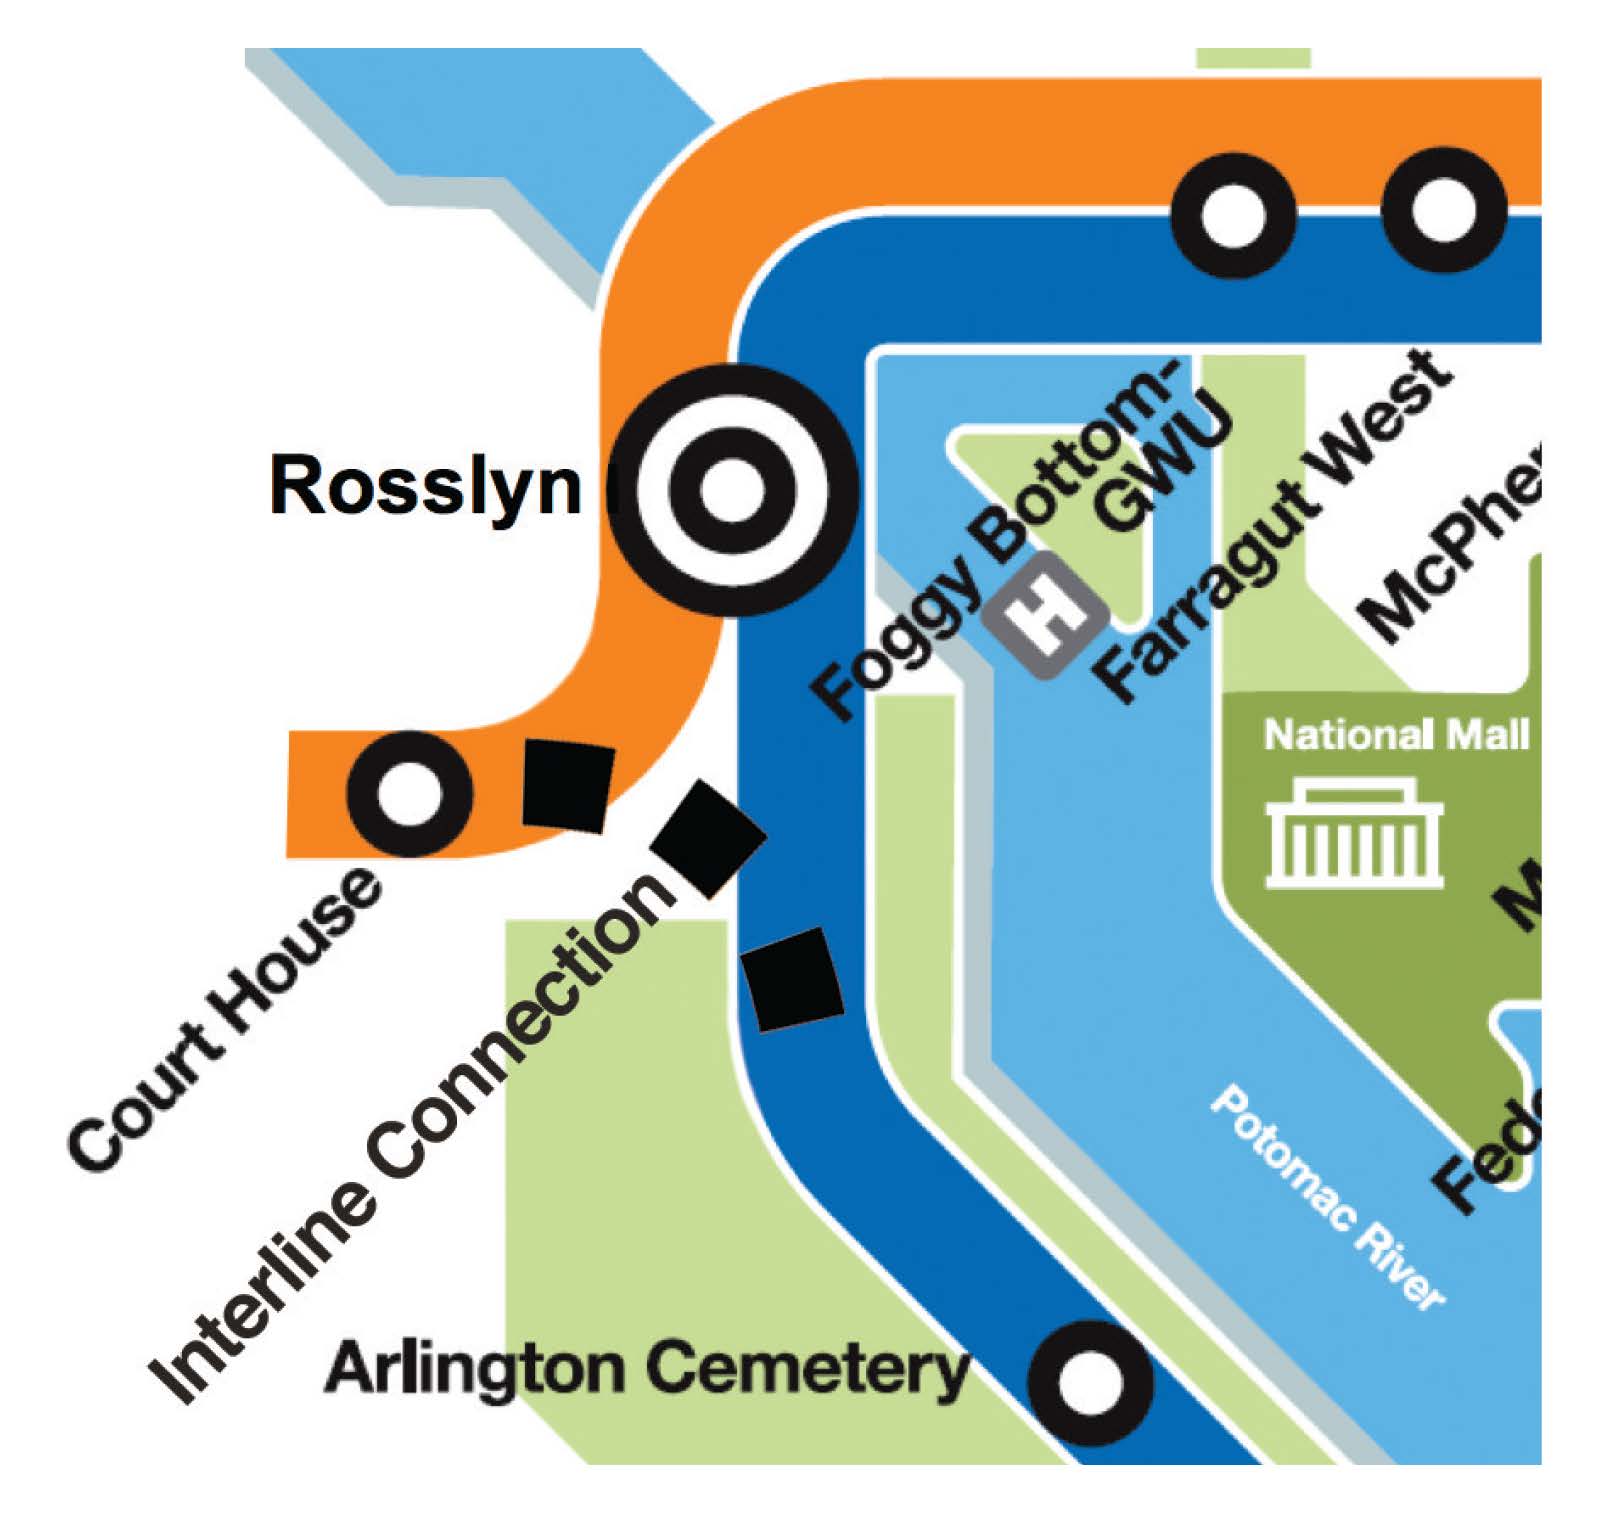
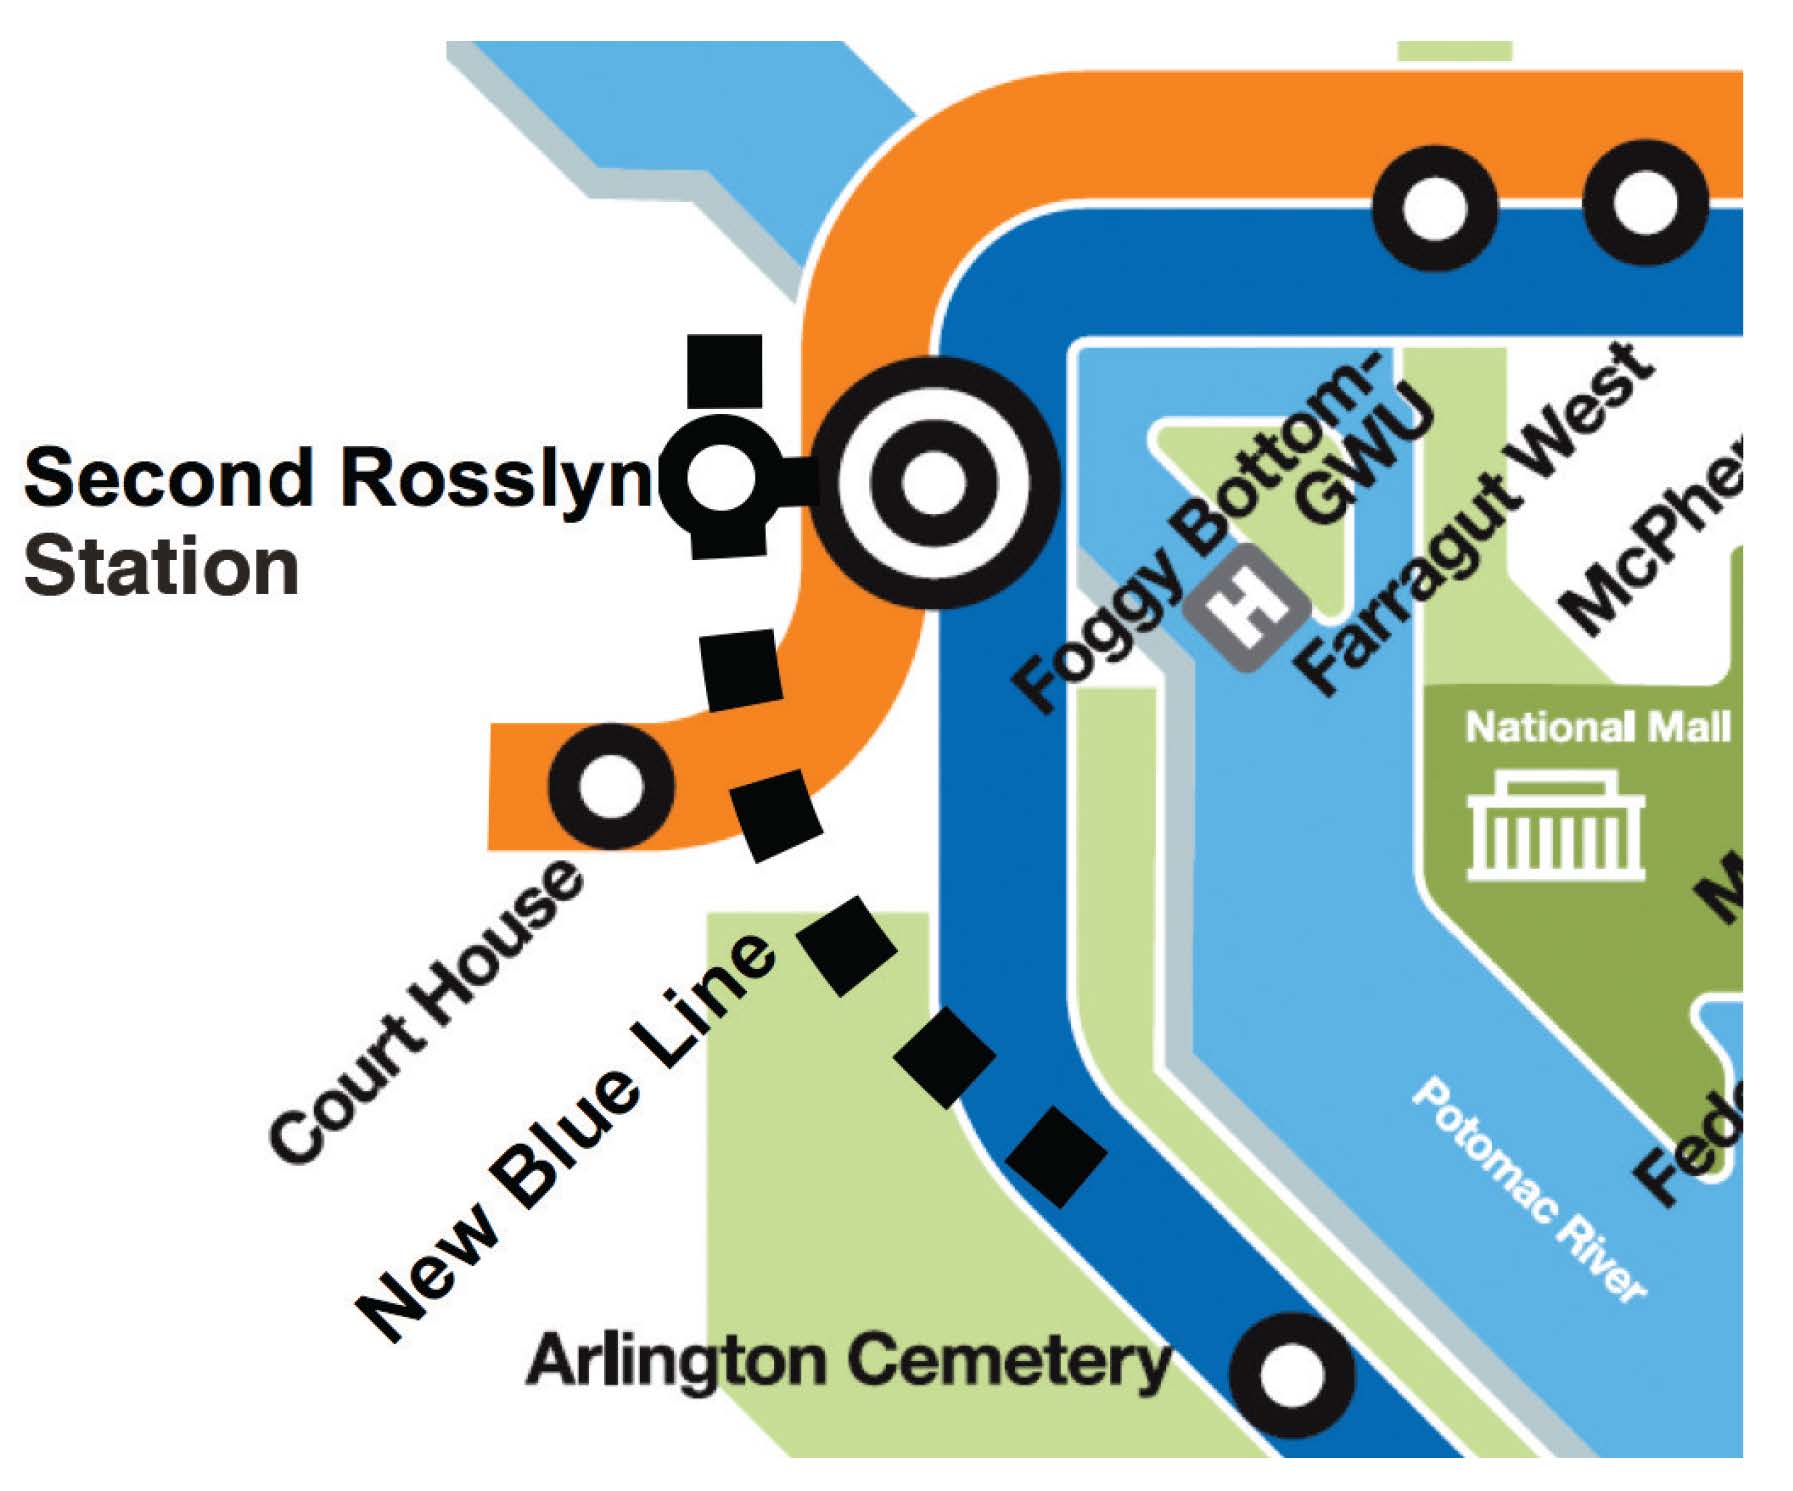
Adding new Blue Line connections seeks to restore train frequencies to every six minutes during the peak period between Pentagon and Rosslyn stations, resulting in less waiting time and crowding for Blue Line riders in Northern Virginia. Once the Silver Line opens, the Blue Line service will operate every 12-14 minutes as opposed to the previous six minutes. The feasibility analysis is currently underway and has identified two potential alternatives to create new connections:
Alternative 1: Add rail track that would create a new connection between the Blue and Orange/Silver Lines, or
Alternative 2: A second Rosslyn Station for a new Blue Line with an underground passageway to the existing Rosslyn station, which would connect to the Orange/Silver Lines with a pedestrian tunnel.
Mary Hynes — Board Member with Arlington County and WMATA Board of Directors Member — was recently featured by Comcast Newsmakers, discussing sustainability efforts as well as Metro’s strategic plan, Momentum.
Ms. Hynes describes Metro’s “Big Ideas” for 2025, including: the need for “all 8-car trains” during rush hour; additional crossovers and pocket tracks to provide more flexibility during peak period operations, emergencies and trackwork; and priority for Metrobus on city streets and highways.
Check out the video below and let us know your thoughts in the comments.
The strongest growth in ridership for Metrorail is coming from the inner jurisdictions of the District of Columbia, Arlington, and Alexandria. In these areas, home to 43% of all rail riders, ridership has grown twice as fast as the system as a whole.
Our 2012 Metrorail Passenger Survey can tell us where rail riders live, which is a key input for determining how Metro is funded by our regional partners. But it also gives us insight into where Metro’s growth markets are and how Metro’s ridership is evolving. Overall, rail ridership in the 2012 survey increased three percent since our prior passenger survey in 2007 – but where do our new riders live?
Where do Metrorail riders live? Ridership growth has been strongest among residents in inner jurisdictions, and has been holding steady in outer jurisdictions.

 the region needs will require an unequivocal commitment of additional resources from internal and external stakeholders. Simply put, the rehabilitation work being accomplished at the time of the writing of this document will not be nearly enough to keep up with the region’s needs, and without additional resources it will be unlikely that the region can continue to enjoy a transit network that contributes to competitiveness and makes the Washington metropolitan area one of the most desirable places to live and work.
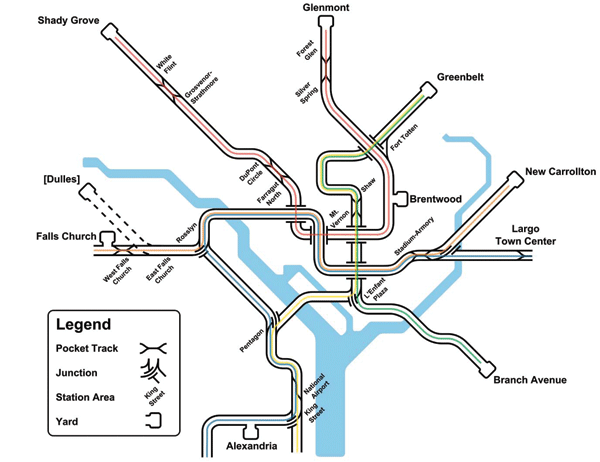


Recent Comments