Rail Car Crowding and SafeTrack – Potential Customer Impacts Analysis Released

June 13th, 2016 1 comment

We have developed a customer impact analysis that shows how and where customers may be impacted in the SafeTrack safety surges, to help guide regional partners plan mitigation and alternatives

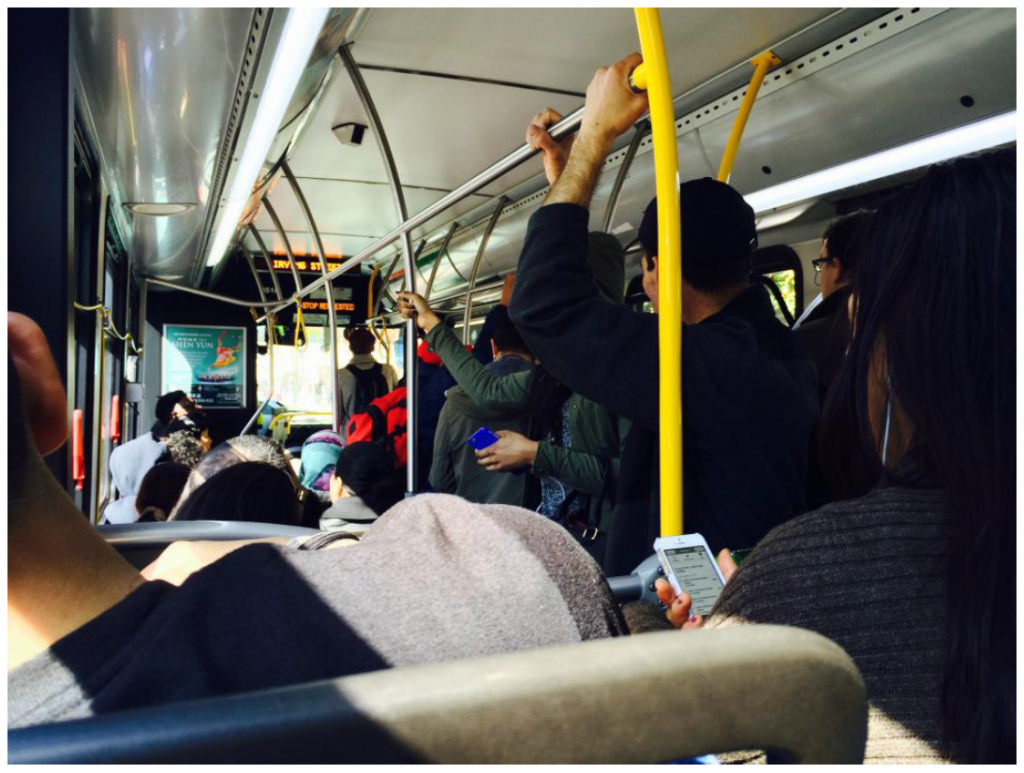
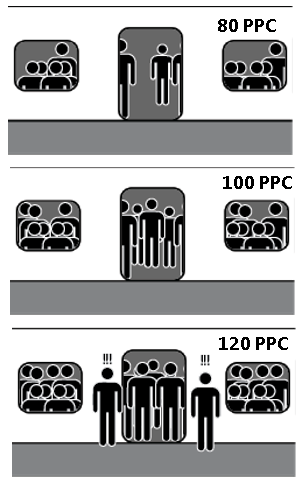
you_down_with_PPCThe first SafeTrack project began on June 4, meaning that Monday, June 6th, was the first day with peak-period service disruptions.  This first safety surge is to accommodate the track improvement project planned for the Orange and Silver lines between East Falls Church and Ballston.  With only one track available for revenue service, we are cutting back to just over 3 trains per hour on each line through the work zone.  When service levels decrease without a decrease in demand, we see an increase in passenger loading on rail cars.  We measure that with a metric called passengers per car, or PPC.

Our rail cars are designed to comfortably transport around 100 passengers each, with most sitting and a few customers standing.  After special events (or any given weekday on some lines) we often find rail cars with much higher passenger loads. From a planning perspective, an average PPC of greater than 120 is considered crowded.  Also, we know that customers don’t evenly distribute themselves across rail cars, so an average PPC of 120 means some cars are much more crowded. Read more…

Categories: Engage Tags: , , , ,

Off-Peak Fare Discounts and their Behavioral Implications

June 8th, 2016 4 comments

Metrorail riders facing a high percentage off-peak discount are motivated to delay their travel and save.

This post is guest-written by Sam Winward, a behavioral economist and Metrorail commuter who lives and works in the District. His analysis of Metro ridership patterns sheds light on the influence of off-peak pricing.

If you’ve ever waited a few extra minutes before swiping through a Metrorail faregate to qualify for the off-peak fare, you’re not alone. Within the afternoon peak / off-peak cusp period, when riders may be somewhat time flexible, Metrorail data from AprilMay 2015 confirms that some riders are delaying entry for savings.

What riders probably don’t know, is that their off-peak pricing discount could be substantially different from the riders around them. In fact, off-peak percent discounts can range from a 19% to 40% reduction of peak fares. Given the varying degree of off-peak incentive, riders are responding as we’d expect when weighing their opportunity cost of time.

As percent savings increase, riders are more likely to delay travel for off-peak fares. The graph below, derived from WMATA data, displays this ridership tendency.

Note the ridership uptick just after 7 pm. This runs counter to the natural pattern of declining ridership over this period, and the uptick steepens as the percent discount facing riders increases.
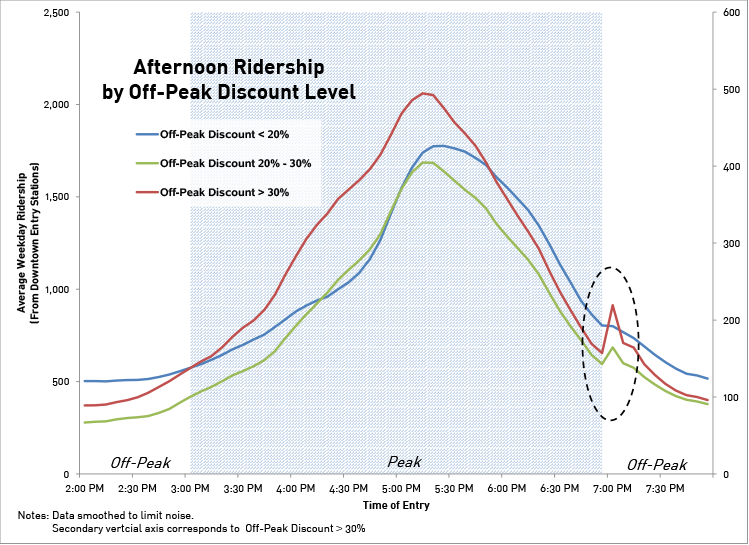
Exhibit 1_Ridership Uptick

So why is there so much variation in off-peak discounts, and who are the lucky riders allowed large savings?

Particular trips, based on mileage between origin / destination stations, are subject to off-peak fare “caps.” WMATA introduced the caps in 2012 when off-peak fares switched to incremental fee-per-mile pricing. Off-peak fares for trips of just under 7 and 10 miles were capped, as these trip distances would have otherwise seen very large increases between the old and new fare structure. A maximum off-peak fare cap of $3.60 was also implemented, affecting riders with trips lengths greater than 11 miles.

The effects of these fare caps remain in the system today, and are not mirrored in peak fares.

As displayed below, the gap between peak and off-peak fares increases over regions subject to off-peak fare caps. This makes off-peak travel more enticing for riders’ whose trip length falls within a green zone.
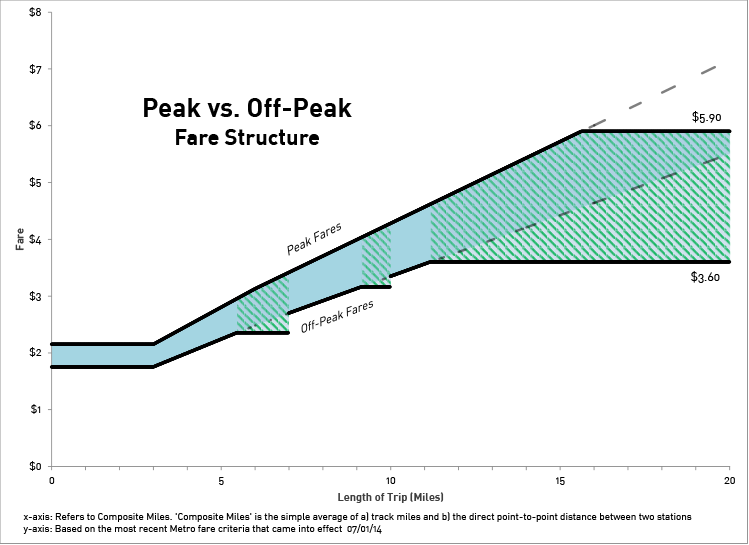
Exhibit 2_Fares

Notably, small tweaks in the fare structure have large behavioral effects.

Even if you decide that added off-peak savings aren’t worth the wait, at least your decision can be informed. To see the off-peak discount applicable to your route, and how it compares to the rest, check out the interactive off-peak discount calculator on my website.

The full story, including the off-peak discount calculator and a formal analysis of the delayed ridership patterns, can be found at Sam’s site.
WMATA Begins a New Capital Needs Inventory

June 6th, 2016 1 comment

Restoring Metro’s reliability and quality requires a comprehensive approach to asset management and reinvestment.

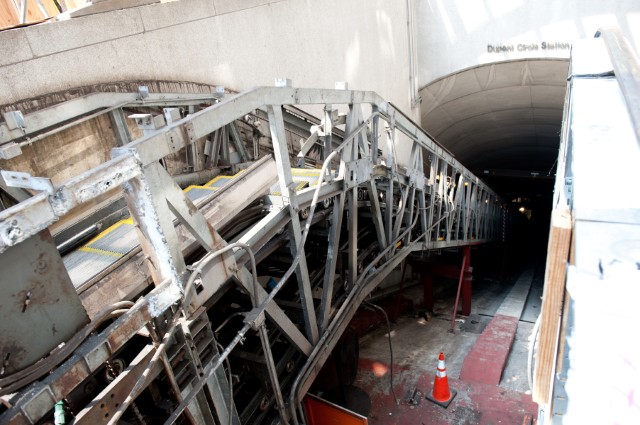
dupont_escalator_replacement

Capital needs include escalator replacement, as pictured here.

In April, Metro staff commenced the important work of updating its Capital Needs Inventory (CNI), a financially unconstrained prioritized plan of capital needs that documents Metro’s infrastructure, vehicle, facility, technology, and system capacity investment needs over an immediate to 10-year horizon, and provides input to the development of the six-year Capital Improvement Plan (CIP).  This document, which itemizes and prioritizes the capital investment needs of the entire Authority over a ten-year period, not only informs our jurisdictional partners about funding needs, but is now also a component of the federally required Transit Asset Management Plans outlined in MAP-21.  Importantly, Metro’s CNI effort is occurring at a critical time both for the Authority and within the transit industry. Concurrent with recent asset-related failures on Metro’s rail system, international standards for asset management (ISO 55000) and Federal Transit Administration (FTA) proposed rules have recently been published that can help guide the methodology and tools used to develop a best-in-class CNI.

Have we done this before?

Awareness of the need to focus on the maintenance and renewal of Metro’s capital assets has existed since the system opened, but a comprehensive approach to long-term planning for the funding and management of capital assets has been lacking for much of Metro’s history. In the early years of Metrorail operations, the focus of funding campaigns was on construction of the full system. Toward the late 1990s, as the 103-mile rail system neared completion, efforts began to quantify capital improvement needs and to increase the size of the capital improvement program budget. Some key milestones during that period included: Read more…

Categories: Engage Tags: , , , ,

Rail Ridership Data to Help the Region Plan for SafeTrack

May 27th, 2016 3 comments

To help the region and our partners plan alternatives and mitigate the impacts of SafeTrack, Metro releases rail ridership data applicable to this important maintenance effort.

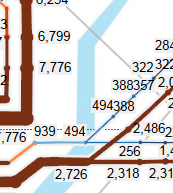
SafeTrack example 2Rail Link Volumes: This data describes the number of customers on board trains between two contiguous stations, for a given hour of the day, then assigned to rail links.  For example, the link volume from Bethesda to Friendship Heights is the sum of everyone who boarded upstream, minus those who exited at or before Bethesda. This can be useful for planning SafeTrack mitigation efforts because it gives a first-order estimate of the potential demand for a bus bridge, for example.

Online Interactive Map of Metrorail Link Volumes, average weekday and Saturday in May 2015

Metrorail Link volumes, average weekday in May 2015, by hour, by line color (580kb, .xlsx)

Read more…

Metrobus Ridership During the Rail Safety Shutdown

May 23rd, 2016 2 comments

When Metrorail closed on March 16th, tens of thousands of rail riders switched to bus, including almost 20,000 riders who took their first bus ride in over a month! Bus-to-bus transfers spiked 45%, and ridership surged in downtown and central areas but fell in the suburbs.

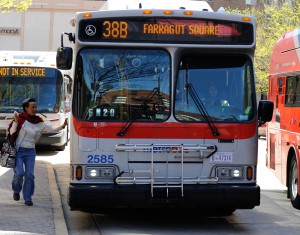
Ballston Bus

Special thanks to the Systems & Performance Analysis team in Bus Planning for their help developing this analysis.

When Metrorail closed on Wednesday, March 16, Metrobus braced for impact as over 700,000 displaced rail trips sought alternatives. But there was little time or capacity to significantly alter bus service. What happened to bus ridership?

Overall ridership as tallied by the farebox came in at just 5% over the monthly average, or about 20,000 additional trips. So the changes look fairly small given the volume of displaced rail trips.

But don’t be fooled by the bottom line.  Underneath that total, a seismic shift was taking place. Read more…

Biking near Buses: Watch Out for Blind Spots!

May 19th, 2016 4 comments

Bus operators are trained to look for cyclists, but they can’t see you if you’re in their blind spot. Come see a bus’s blind spots for yourself at Fort Totten!

Unless you’ve driven a bus (or large truck) yourself, it can be hard to get a feel for where the blind spots are in real life. This Bike to Work Day (May 20th), come see for yourself what bus operators can — and, more importantly, can’t — see on the road. Metro’s Fort Totten pit-stop will feature a live Metrobus demonstration with experienced Metrobus instructors. Hop in the driver’s seat (and who doesn’t want to experience that air cushioning!), check the mirrors, and you’ll know where it’s safe to ride. While you’re there, brush up on your skills securing your bike on the bus’ bike rack.

When buses and bikes share space on the road, visibility is the key to safety. Metrobus operators receive regular training on safety around bicyclists, but they need your help as well.

Remember these tips when riding near buses: Read more…

Categories: In The News Tags: , ,

Bike to Work (or Metro) Day 2016

May 18th, 2016 Comments off

Metro will host three Bike to Work Day pit-stops on May 20th; sign up now!

Friday May 20th is Bike to Work Day 2016, and Metro is gearing up to be part of the fun (Yes, biking to Metro counts!). While it may be appropriate that National Bike Month has opened with rainy Dutch weather, we’re optimistic that the sun will break through in time.

Sign up now and plan to stop by one of the 83 pit-stops across the region. Each pit-stop will be chock-full of food, drinks, giveaways, city cycling safety tips and more. We may be biased, but we think the best pit-stops are at Fort Totten, East Falls Church, and College Park stations.

Hope to see you there!

Categories: In The News Tags: , ,

Designing the SelectPass Test Phase

May 4th, 2016 9 comments

The new Metro SelectPass is structured to to maximize pilot participation while minimizing the risks.  Making that happen involves overcommitting to truth in advertising – and we’re fine with that!

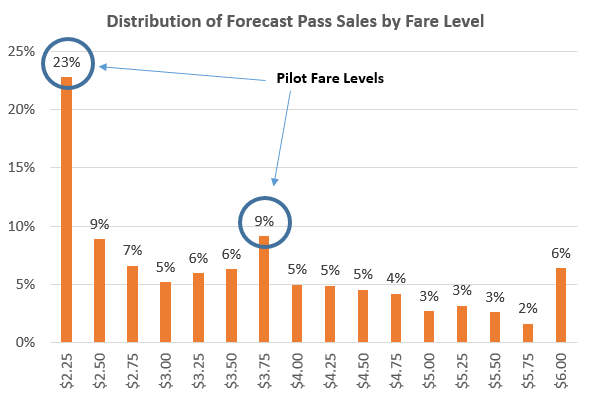
The two most likely fare levels for the SelectPass are $2.25 and $3.75.

The two fare levels most likely to be popular for the SelectPass are $2.25 and $3.75.

We are excited about the launch of the new SelectPass pilot.  As we have begun to roll out this new pass product, we are listening to your questions (via twitter, comments posted to articles, etc.) and we hope to address as many of them through the proper venues.  PlanItMetro seems to be the best forum to answer the persistent question, “Is this really only for two fare levels, and why don’t you tell everyone that they can probably save money?”

Testing the capacity of the Fare System

When we roll out new features, we want to eliminate as many risks as possible before committing to them.  In this case, the primary risk Metro faces is that our aging fare technology might not be able to accommodate a very different fare product such as SelectPass.  So we developed a program to test the pass at two individual “levels” as a proof of concept and not push any limits of our fare collection technology. Read more…

Categories: Engage Tags: , , , , ,

16th Street Plan Offers Big Benefits, Great Value

April 25th, 2016 Comments off

DDOT’s 16th Street transit plan will benefit Metrobus riders, drivers and taxpayers alike and could “break even” in just a year and a half.

We know the problems with buses on 16th Street NW: overcrowding, slow speeds, lengthy boarding times, and bunched buses. While both the District Department of Transportation (DDOT) and Metro have made several small but important improvements in the past two years to improve traffic flow and increase bus capacity on 16th Street, both agencies realize that more needs to be done. Now, after a year of detailed study in partnership with Metro, DDOT has developed a set of recommendations (PDF) that will save time and improve the customer experience in the coming years. As an added bonus, it comes with a relatively cheap price tag, yielding great value for taxpayers.

16th Street Crowding

Riders aboard a crowded S-Line bus (click for study information)

Read more…

Metro is Rebuilding More Sustainably

April 22nd, 2016 Comments off

As Earth Day approaches, we’ve documented the strong foundation of sustainable practices at Metro in our newly updated Sustainability Report.

Metro has launched a rebuilding and service campaign that is aimed to bring riders back to Metro by providing safe effective and reliable service. Because service is one of the biggest sustainability benefits transit provides, rebuilding its ridership will help the authority reach the regional ridership, climate change and connected communities goals as outlined in Metro’s Sustainability Initiative.

Metro’s annual sustainability report provides a rare view into Metro’s efforts to achieve the sustainability goals it set for itself – reporting on successes and setbacks alike. The past and future projects list under each target reads like an encyclopedia of transit agency best practices from testing energy efficient switch heaters to designing pedestrian accessible stations.

Rebuilding sustainably where possible will help Metro achieve long term financial savings while creating a cleaner, more modern, safer, and more reliable system. These investments will help Metro on it’s trajectory to reach its ambitious but achievable sustainability targets. To read more about Metro’s achievements to date and upcoming projects, check out Metro’s 2016 Annual Sustainability Report.

Tell us what you think of Metro’s sustainability efforts. We are always listening to new ideas for potential projects. Submit your ideas online or email them to planning@wmata.com.