Bicycle Parking Census at Metrorail Stations

Bicycle access is a key long-term access strategy to Metro’s services, and we are currently trying to triple the number of bicyclists accessing our network by 2020. As we develop plans for capital investment in bicycle and pedestrian facilities, we need good data on bicycle parking demand to tailor new facilities to each station. Our most recent bike parking counts were from 2006-2007, but a lot has happened since then.
So, taking a cue from from trail count data, we counted bikes and racks at rail stations over a six-week window of peak usage from May 1 to June 15 for a “bike parking census.” Each station was counted on a sunny, warm day typically between 9:30am and 3:00pm. We wanted to learn about the general availability of and demand for bike parking in station areas. For these counts, we specifically excluded bike lockers and the Union Station Bikestation, and focused just on racks. We wanted to know how easy it would be for a new bike-to-rail customer to easily find bike parking near a station. We counted each U-Rack as space for 2 bikes, and used our best judgment for wave, grid, post-and-ring, and other racks.
Overall Findings
- 84 of our 86 stations have bicycle racks (all but Arlington Cemetery and Stadium-Armory)
- Bike-to-rail access seems to be up significantly over the last 5 years
- There is space to park 3,540 bicycles near Metrorail stations, and we saw 2,196 parked bicycles total
- Supply is not always matched to demand at a station-by-station level. Some stations are at or above capacity today, and additional bike-to-rail customers would be unable to find legitimate bicycle parking. Other stations have plenty of underused space. Racks at some stations are not aligned with demand – they have unused capacity on one side of the station, but overflowing racks on the other side.
- Stations where total bikes parked exceeded 100% of rack capacity: 12
- Even though a station may show some “empty spaces,” the racks may still be crowded enough that an average bicyclist would call the rack “full” in all practicality.
- Stations where we observed at least 3 bikes tied to things other than racks: 26
Bike Parking Since Last Count
As shown in the table, bike-to-rail access is significantly higher than the last time we counted parked bicycles on racks nearly 5 years ago. Part, but not all of the increase is because we were more thorough about counting non-WMATA racks near station entrances, so there are some apples-to-oranges issues here. The number of bicycles counted on racks near stations is more than 75% higher. The number and kinds of bike racks in station areas have changed as well (as we replace old Rack III “claw” style racks with inverted-U racks, and as others add racks).
| 2006-7 Count | 2011 Count | % Increase | |
| Bike Rack Capacity Observed | 2,963 | 3,544 | 20% |
| Parked Bicycles Observed | 1,248 | 2,196 | 76%
|
Station-by-Station Findings
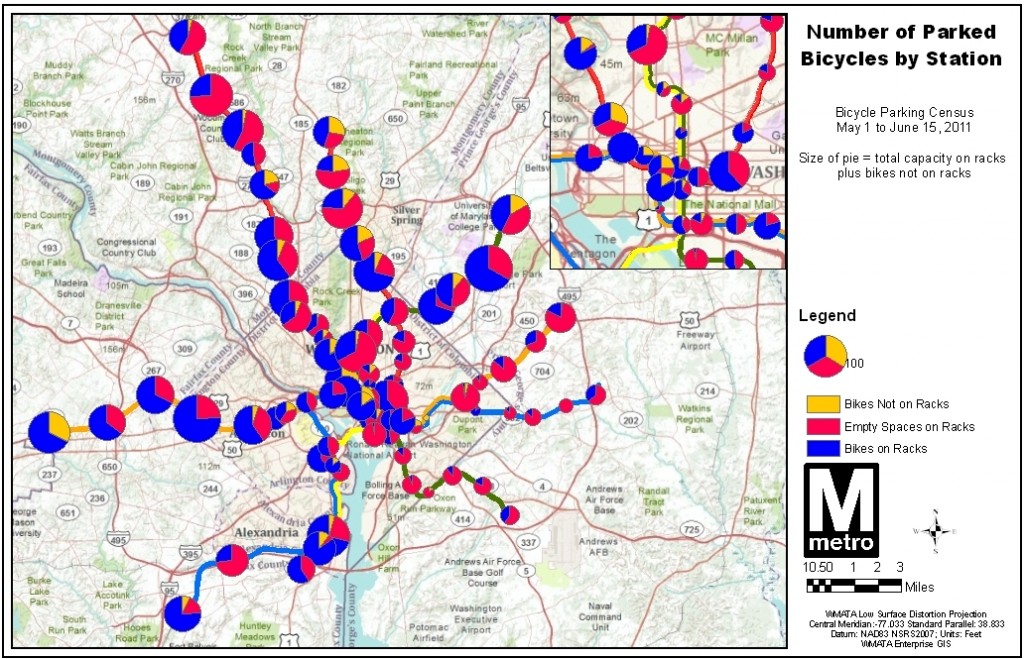
The map below summarizes where we counted bikes on racks, and not on racks, too. Dark blue represents bikes counted tied to the racks identified above, and yellow represents bikes we observed tied to things other than racks – railings, trees, sign posts, etc. Pink represents empty spaces on racks. The size of the pie indicates the total capacity at the station, plus any bikes tied to things other than racks. For example, the racks at Vienna were completely full when we counted, and an additional 31 bikes were tied to railings and other objects. You can download the station-level data for yourself.
Top Five Stations by Rack Parking Available
- East Falls Church, 124
- College Park, 124
- Rockville, 103
- Braddock Road, 96
- Twinbrook, 96
Top Five Stations by Bikes Parked
- Vienna, 96
- East Falls Church, 95
- College Park 83
- Braddock Road, 77
- Takoma, 70
What This Means
Metro will be using these data to inform our decisions about where to fix, upgrade, and expand bicycle parking facilities. These counts, along with locker usage, will serve as a general indication of current bike-to-rail demand. Of course, as a “snapshot” in time, the data don’t capture day-to-day variations in demand for bike parking, and some racks have already been replaced/expanded (King Street, Medical Center, Grosvenor, Georgia Ave/Petworth, and College Park) since we did the counts in May and June.
Finally, we plan to continue making periodic bike counts to track our progress in attracting more bike-to-rail customers.


Thanks for publishing your findings as well as making the data available for download. Is there an inventory of current station bicycle amenities such as covered bike parking, bike friendly station entrances, bike lockers, etc. that you could share?