Changing Outlook on Regional Growth Trends
The Regional Transit System Plan (RTSP) is intended to update the currently adopted Transit System Expansion Plan (TSEP) that was completed in 1999. In its implementation, the RTSP looks beyond the planning horizon of the TSEP by an additional fifteen years and incorporates updated travel demand, population and employment forecasts for the region. The following discussion will look at how much ridership growth has occurred over the ten-year period between 1999 and 2009, and will look at changes in the regional growth projections out to 2040 that will shape future demand for transit services.
Changes in Ridership
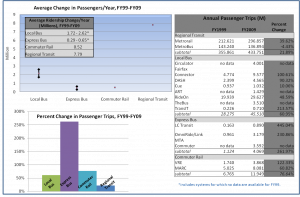
As envisioned in the adopted plan, transit ridership has grown since 1999, and is on the way toward the TSEP goal of doubling ridership by 2025. Annual transit passenger trips throughout the region have increased by about 30% in the first 10 years of the 25 year planning horizon. However, this growth in ridership has not been consistent across the region: close inspection of these data shows that ridership growth is happening at a faster rate on local feeder bus, express bus, and commuter rail services than for regional Metrorail and Metrobus services, although Metro accounts for the majority of the growth in absolute terms. The growth in ridership on local and commuter transit services highlights the need to create a transit plan that looks beyond the services provided only by Metro and to focus on the region at large.
Changes in Cooperative Population and Employment Forecasts
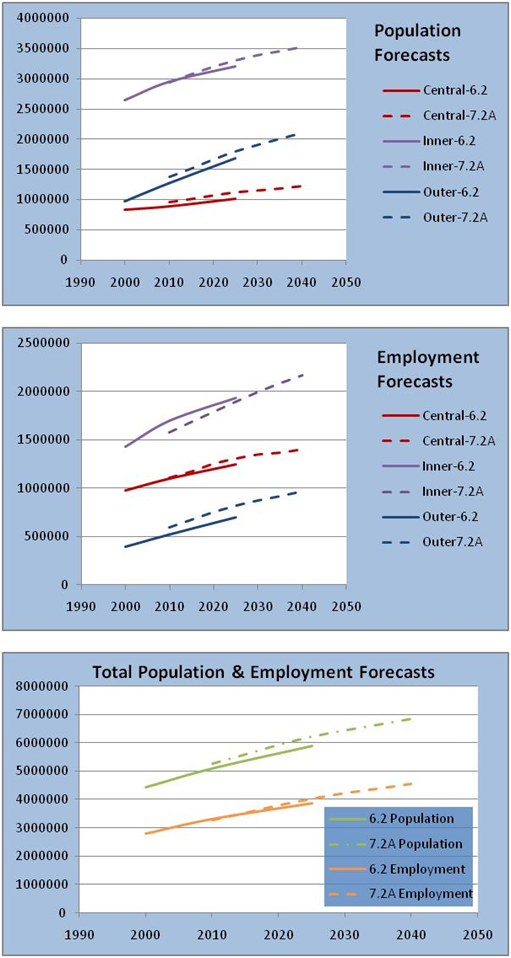
During the late 1990’s when the TSEP was developed and subsequently adopted, the current regional land use forecast was Round 6.2, in which the outer suburbs[1] and inner suburbs[2] were expected to experience the fastest rates of population and employment growth, respectively, while the region’s central jurisdictions[3] were predicted to grow more slowly. A decade after the Round 6.2 forecasts, Round 7.2A forecasts show that while this will remain the trend the two forecasts differ in the degree to which this growth is anticipated. For instance, even as the central jurisdictions grow at a slower rate in both forecasts, the change in growth rates between forecasts differs by +17% in population and -8.5% in employment. This means that the rate at which the population was previously expected to grow in areas where transit captures a major percentage of trips is now forecast at an even higher rate, yet the rate of employment growth in this same area is lower. This is offset by a comparative 12% and 13% decrease in population growth rates in the inner and outer suburbs, respectively, as well as a small employment growth rate jump in both. A comparison of the forecasts shows a shift in expected population growth toward the central jurisdictions and a shift in expected job growth toward the inner and outer suburbs.
Both Round 6.2 and Round 7.2A forecasts show that the outer suburbs have relatively more population growth than employment growth, and that the central jurisdictions have relatively more employment growth than population growth. A shift in forecasting trends is seen, however, in the inner suburbs where population growth was previously forecast higher than employment growth but the more recent forecast shows more employment growth than population growth. Also, although both population and employment are forecast to grow significantly throughout the region over the next 30 years, slower growth for each is anticipated.
Impacts of Growth

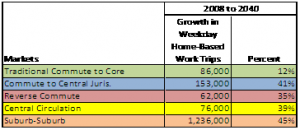
Figure 3. Projected growth in trips. Source: RTSP TAG presentation
The demographic growth predicted by the Cooperative Land-Use Forecasts has a direct impact on travel patterns. From these predictions, we see that different growth rates across the region have implications for transportation. The changing growth patterns show that the traditional transit market of commuting trips to the core will not grow as fast as suburb-to-suburb trips. Serving suburban activity centers, typically not as dense or walkable as the downtown core, will be a significant challenge for the region’s transit system.
An Updated Solution
Regional trends shown by increased ridership, dispersed ridership growth and travel patterns, and the degree to which population and employment growth rate predictions have changed since the TSEP was adopted call for an update to the regional transit long range plan. This update, provided by the RTSP, will incorporate regional issues with consideration of the regional transit system, the customers it serves, and the metropolitan community at large.
[1] Outer suburbs: Calvert, Charles, Frederick, Loudoun, Prince William and Stafford Counties, and cities surrounded by them
[2] Inner suburbs: Montgomery, Prince George’s, and Fairfax Counties, and cities surrounded by them
[3] Central jurisdictions: District of Columbia, Arlington County, and City of Alexandria


How accurate is it to describe these projections as forecasts? My understanding is that the trends in total regional population and employment is forecast by COG staff; however the distribution of the total among the various jurisdictions is determined by aggregating the forecasts developed by the land-use regulators of those jurisdictions in connection with their zoning decisions. If this is correct, the numbers we are looking at would represent a mixture, partly forecast of the future, partly economic development strategy, and partly a projection of existing land-use regulations into the future.
I’ll try to give a concrete example of the problem. Sprawl-type development in Montgomery County is typically \by right,\ so development of that kind would be included in the projections far into the future. On the other hand, development around Metro stations is typically not added to Master Plans until an area is \ripe\ for redevelopment. Thus much future transit-oriented development, maybe most of the development in the 2030-2040 period, is not yet in master plans. If I understand the system correctly, county planners aren’t allowed to include that in their projections. That would bias the \forecasts\ to underestimate transit-oriented development and overestimate sprawl.