
Survey Analysis Details Non-Work Trips on Metrorail
Almost one in five trips on Metrorail are NOT work-related. Who is making these trips, and where and why are they making them?
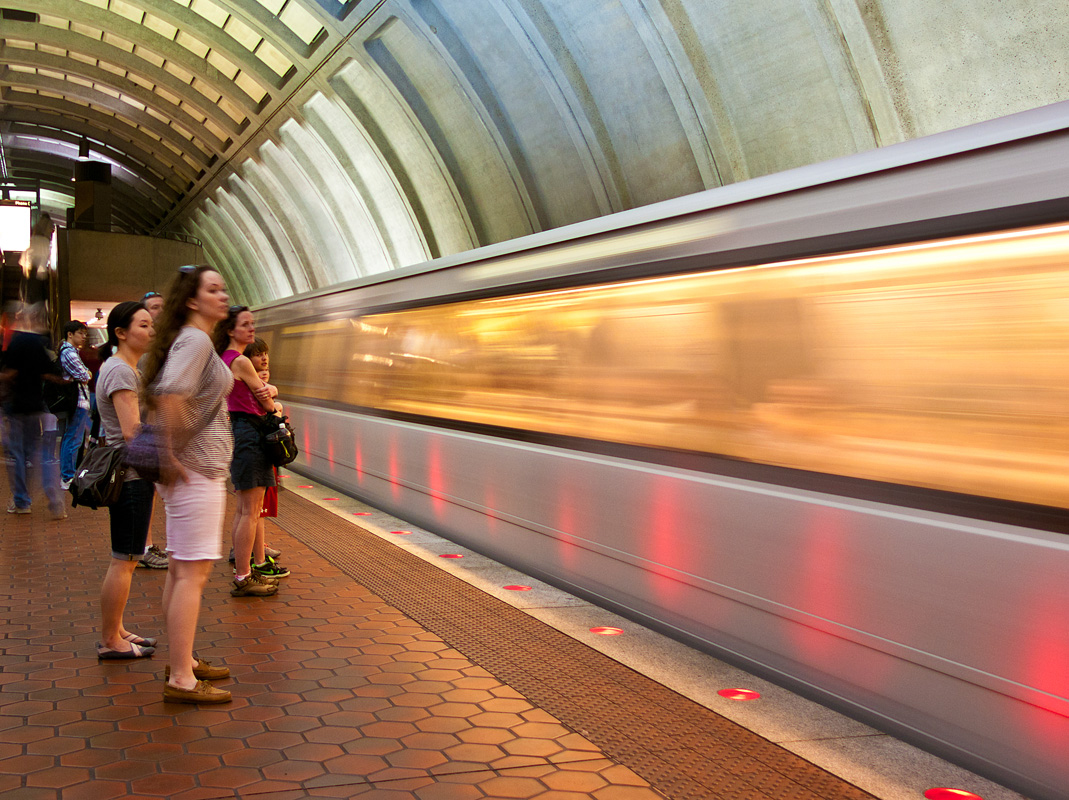
Metrorail is how many of us in the region get to work. But, as we will illustrate below, many of us also use it to do other things.
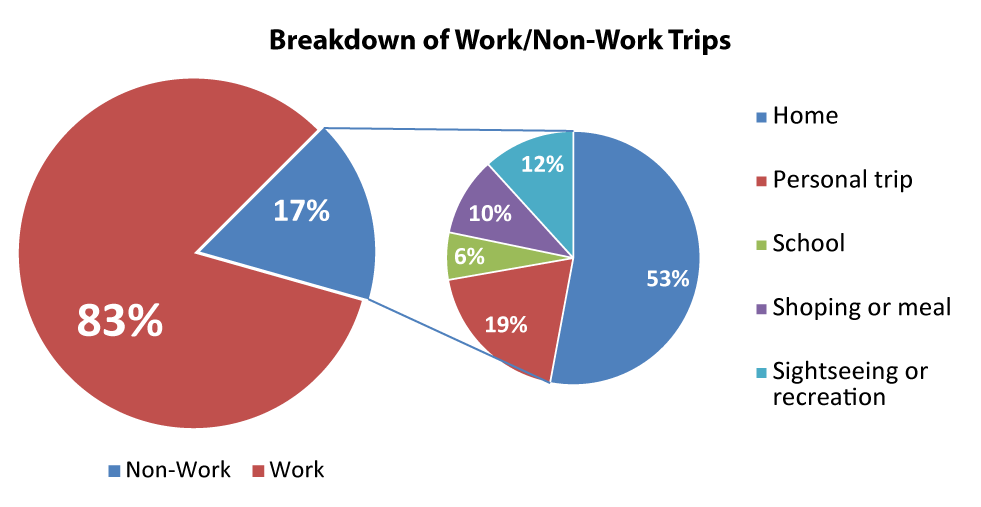
Using data from the 2012 Metrorail Passenger Survey, we were able to determine that about 125,000 or 17% trips on an average weekday do not involve travel either to or from ones’ place of work. This is virtually identical to the results from the 2007 survey. In order to understand how people use the system for non-work trips, we sorted out everyone who is either going to or coming from work from everyone else. For example, a trip stopping off at the store after work would not be counted; however, a trip starting out at home and traveling to school would be counted. In terms of where these non-work trips are going, most are returning home followed by “personal trip” and “shopping or meal.”
When Are Non-Work Trips Made?
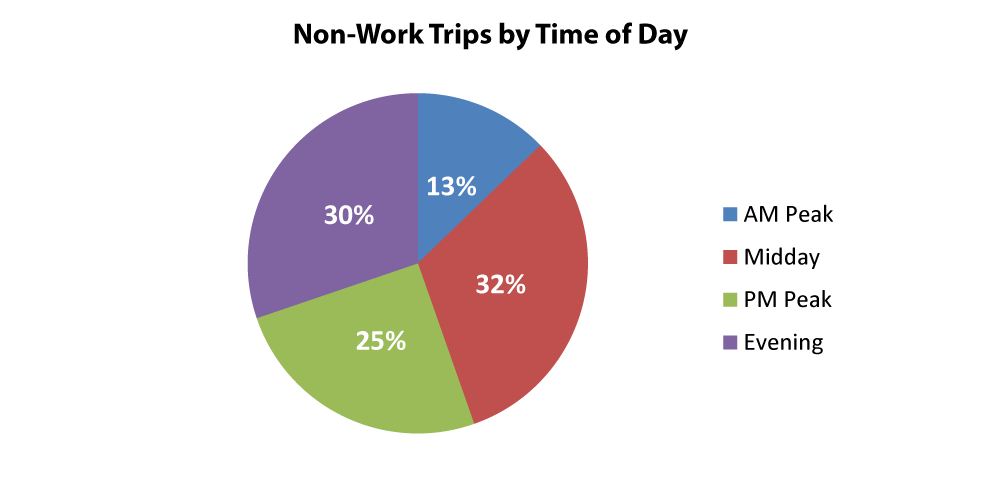
Over 60% of non-work trips occur during off-peak times. Off-peak, non-work trips are spread fairly evenly between the midday and evening time periods. However, peak-period, non-work trips are far less common: only 13% of non-work trips occur between system opening and 9:30 AM and 25% of tips occur between 3 PM and 7 PM.
Where Are Non-Work Trips Starting and Ending, and Why?
First, we created a list of the top ten stations where non-work passengers enter the system—
| Station | Number of Non-Work Trips |
| Gallery Place-Chinatown | 9,225 |
| Union Station | 5,232 |
| Dupont Circle | 5,047 |
| Foggy Bottom-GWU | 4,014 |
| Pentagon City | 3,897 |
| Columbia Heights | 3,251 |
| Metro Center | 2,996 |
| Smithsonian | 2,791 |
| Bethesda | 2,739 |
| Farragut North | 2,333 |
We then looked at where these people are traveling to, with the idea being that a customer came to one of these stations to shop or eat, then used Metrorail to return back home. On a station-by-station level, no specific patterns emerged. For example, the 9,225 trips at Gallery Place were spread between 75 of the system’s 86 stations, with the single biggest station contributing only 6% to the total.
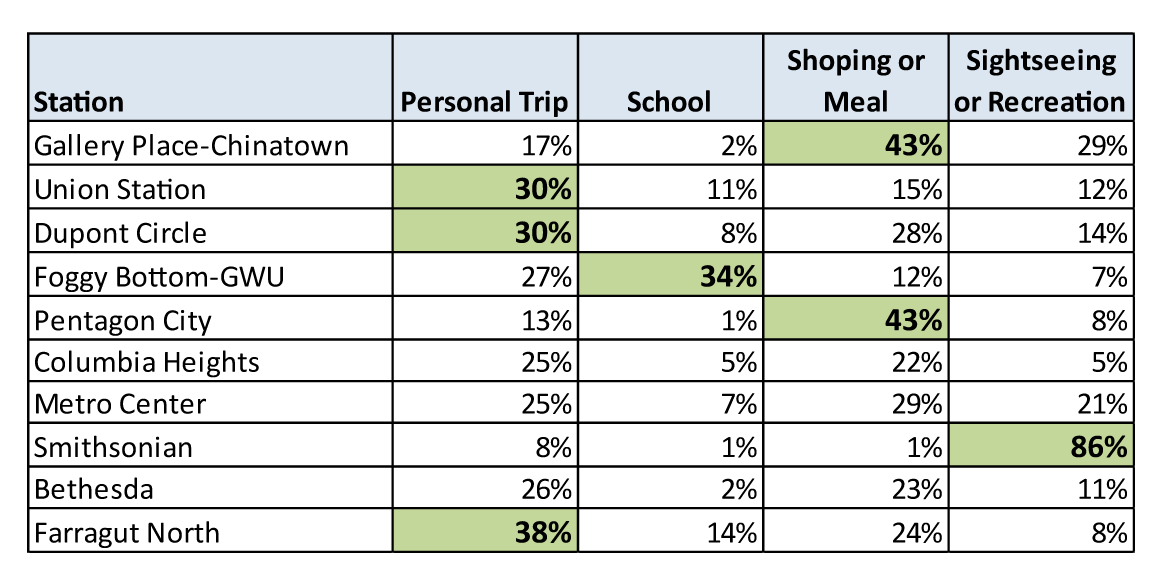
However, when looking at trip purpose, some patterns emerge. The table below shows the top-ten stations where non-work trips began, and what they were doing before arriving to that station. Sightseeing was the top activity before entering the Smithsonian station. Shopping or dining was the top activity before entering at Gallery Pl-Chinatown and Pentagon City. Personal trips, including medical appointments, brought customers to Union Station, Dupont Circle and Farragut North. School was the top activity for Foggy Bottom-GWU.
Where Do Non-Work Trip Takers Live?
When we examined jurisdiction of residence, some trends emerged as well. DC residents tend to use Metro somewhat more for non-work trips. Approximately 23% of trips made by DC residents are “non-work” compared to the 17% system average. The ridership levels for the other jurisdictions are at or below the system average.
At Gallery Place, 46% of the 9,225 non-work trips live in the District of Columbia. Another 19% live in Montgomery County and 10% in Prince George’s County. Close to 80% of non-work riders at Columbia Heights live in the District.
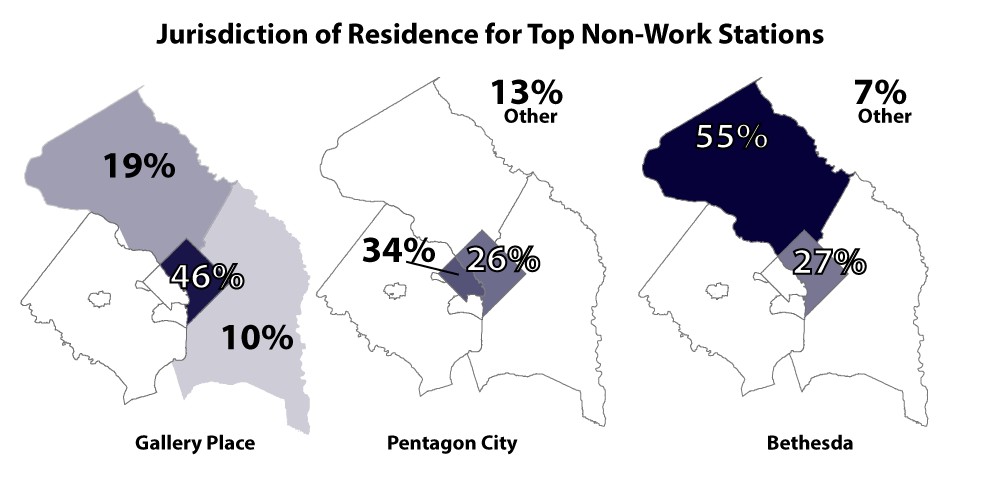
At Pentagon City, 34% of non-work riders come from Arlington and 26% from the District while at Bethesda, 55% of non-work riders come from Montgomery County and 27% from the District, indicating that although many non-work trips are local, many come from other areas as well.
Also of note, tourists (riders who do not live in DC, Maryland or Virginia) make up a sizable portion of Smithsonian’s and Union Station’s non-work trips, at 44% and 14% respectively, even though they make up only a small fraction (3%) of the system’s total, all day ridership.
What are your thoughts on what these trips mean for Metro? How often are you in the 17%?

Home seems like a pretty broad category. Are these all the return trip ends from shopping (which should have 2 Ps in your figures), school, etc trips, or are they from something else? And if so, why’s there a noticeable imbalance between outbound and inbound non-work trips – you’d think that the non-home trips would be higher because of a small but measurable amount of chained trips. Maybe lots of people are coming from work?
I think it’d also be interesting to get some idea of what the work/non-work split is like on weekends. Service industry people have got to get to work somehow, even if Metrorail isn’t really an option before 7:30am.
I wonder how much the 3% tourist figure varies month to month. Three percent in December makes sense, but I bet it may double in March-June.
It almost seems high, this number. Thanks to Metro basically abandoning every weekend to focus (on likely needed) track work, I have not used it – it is too inconvenient.
This doesn’t seem to include weeknights when a Nats game is occurring–surely more than 2000 folks take the train to Navy Yard and go home after. Based on the post, the work-to-game trip would be considered a “non-work” trip and it’s unclear if the game-to-home trip is work or non-work.
I’m generally pretty unsure how reliable the ridership survey data is. I just can’t believe the respondents are a random sample of passengers.
Can you say more about the methodology of the ridership survey? How did you ensure that you were getting a representative sample of Metro riders?
The 2012 Metrorail Passenger Survey was designed to achieve a high level of confidence by sampling a large number of Metrorail system riders. Close to 300,000 surveys were distributed to weekday riders over the course of a six week period in spring of 2012. By the end of the survey, over 68,000 surveys were returned. Given this large sample size, the standard error on a given question is +/- 0.4 percentage points.
The survey attempted to capture a “typical service day.” The survey was conducted after the Cherry Blossom Festival and was not administered at stations during scheduled track work. In addition, the survey was not conducted at Navy Yard during a Nationals home game. Since this only happens 80 times a year, the survey focused on ridership at the station during non-game days.
@Sandy As Matthew notes above, the rail survey is a pretty robust sample size. We counted every station entrance and every time period as well, and weighted the results based on the rider counts from the faregates. So if one station-time had a lower response rate than another, we adjusted for this statistically to be sure we got a complete picture of all riders. And, in some situations we went back out and re-sampled to be sure the survey met at least a 95% statistical confidence level. Does this help?
@Matthew
Thanks for your response, Matthew. It seems to me that not taking into account sporting events and major tourist events is a bit shortsighted, given how often such things occur. The Nationals play 81 home games per year, the Wizards and the Caps 41 each, and DC United 17 or more. Even allowing for some overlap on the days when multiple venues are used simultaneously, that’s at least one-third of all the days in the year that DC is hosting a major sporting event. Add in 4th of July, Cherry Blossoms, DC’s two marathons, and other events, and “normal” ridership days don’t seem like they’re much more common than non-normal ones.
Let’s remember, of course, that those events primarily happen on weekday evenings and weekend afternoons–exactly when those non-work trips are most likely to be happening. My friends and I all live car-free in DC, and rely on Metrorail and Metrobus, not just to get us to and from work, but also to get us to our favorite bars, restaurants, stores, and entertainments. Metro seems increasingly invested in ferrying rush-hour commuters into and out of the city, and uninterested in providing the off-peak service that we all rely on. It should not take an hour to get from Van Ness to Eastern Market on a weekend afternoon on Metrorail, but it does. As much as you try to justify it with posts like these, Metro’s off-peak headways are atrocious and unacceptable in a major city. Remember, you can’t measure the trips we don’t make because they take too long.
On a weekend without construction-related service changes I don’t think it would take an hour to go from Van Ness to Eastern Market. The Red line frequency on Saturdays is about every 8 minutes maximum and the combined Blue-Orange headway (MetroCenter to Eastern Market) is 6 minutes.
You can’t have a good discussion of weekend headways without a discussion of weekend train loading levels. WMATA does not provide data on weekend loading at this time.
It seems like one missing piece of information is the jurisdiction of residence for non-work trips. You did show that only two stations outside of DC are in the top 10 stations for non-work trips. Where are the non-work trip riders coming from? It would also be useful to separate out tourists and riders from outside of the Compact area.