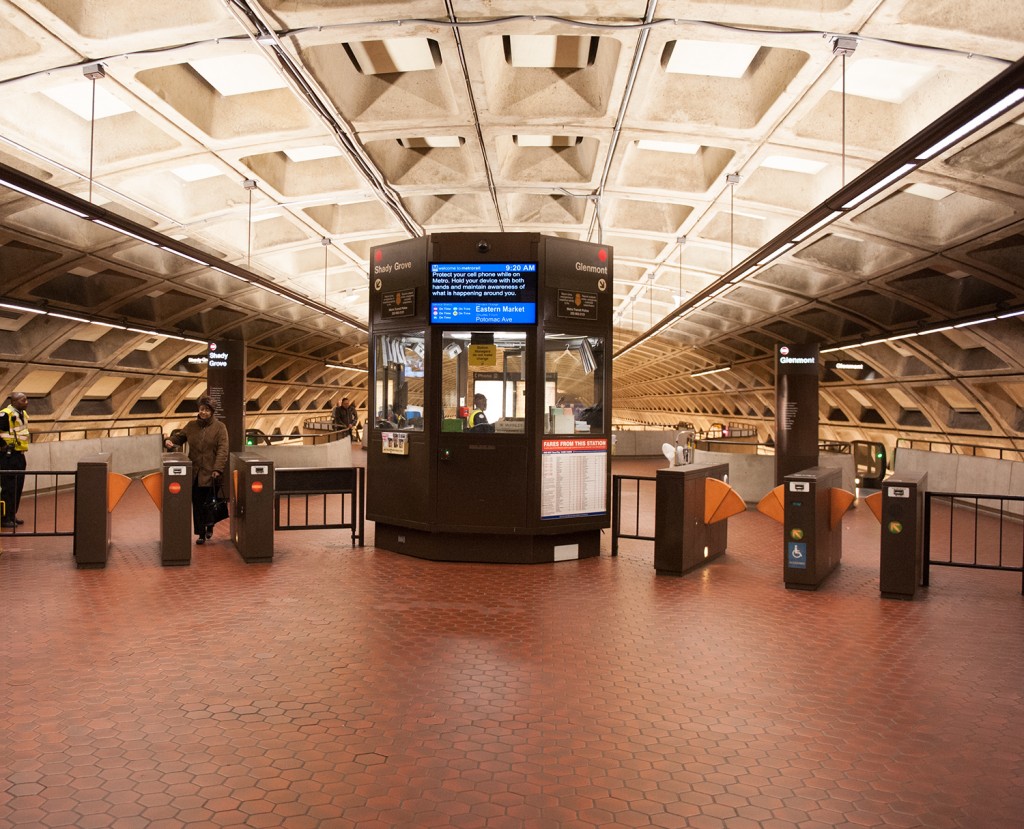
New Station Lighting at Judiciary Square. Click image for larger version.
Pilot upgrades using energy-efficient lighting at three stations have been a success, so Metro is planning to ramp up the effort to 41 more stations by 2015.
Metro recently completed retrofitting the mezzanine-level lights at Judiciary Square, Gallery Place, Bethesda, Smithsonian and Metro Center. Through careful fixture selection, the new fixtures provide a higher quality of light with an improved Color Rendering Index (CRI) thereby improving both lighting levels and overall visibility. Significantly, the new lighting design offers better light levels without compromising the integrity of the original lighting design and station aesthetic. The retrofits also provide significant lifecycle cost savings for Metro through reduced energy consumption and maintenance requirements.
Following these successes, Metro General Manager/CEO Richard Sarles today that it plans to upgrade mezzanine lighting at the 41 remaining underground Metrorail stations by 2015. In addition to the five already completed stations, one station, L’Enfant Plaza is currently under construction. Read more…
The Silver Line will relieve traffic congestion on the Dulles Toll Road and I-66 when it opens in 2014.
This post is a continuation of our series that answers questions about the new Silver Line.
It’s no secret that the Washington region has some of the worst traffic in the country. Listeners to “drive time” radio are bombarded with rapid-fire traffic reports noting congestion on major regional highways, often caused by “nothing but volume”. This expression means there is no traffic accident, weather incident or excessive sunshine slowing cars down. Instead, too many cars are trying to squeeze into too few lanes at critical interchanges, resulting in traffic queues that can extend for miles and miles.
Not surprisingly, the highways along the Silver Line corridor are some of the region’s most congested. The merging of I-66 and the Dulles Toll Road was ranked fourth worst congested location (PDF) in the MWCOG Spring 2011 Traffic Survey. The survey showed the toll road has three major congestion spots in the AM Peak: the toll plaza, the interchange with the Capital Beltway and the merger with I-66. In all three cases, the recurring congestion was caused by vehicles weaving and merging.
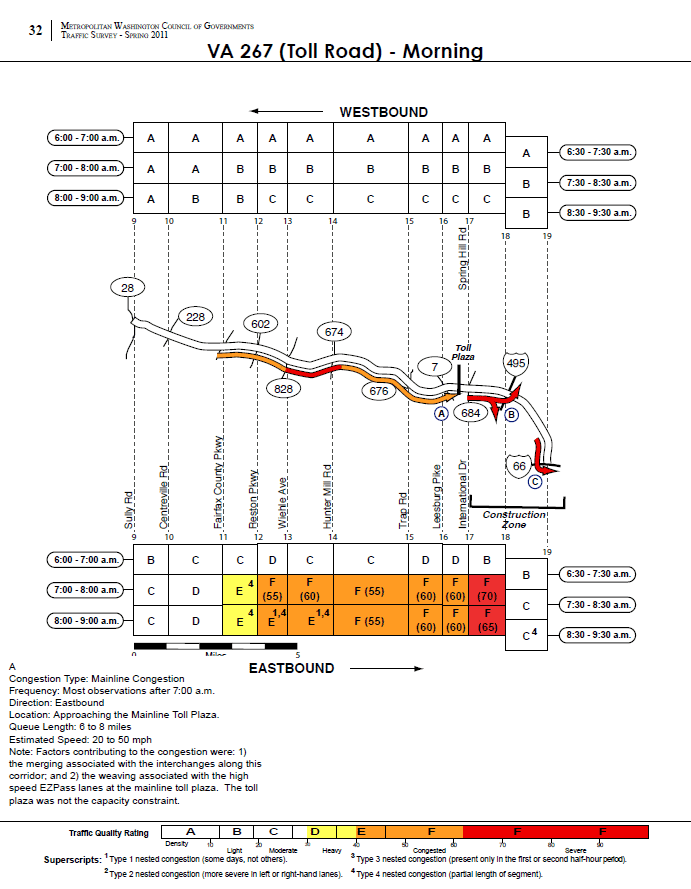
Surveyed morning traffic conditions on the Dulles Toll Road, from the MWCOG 2011 Traffic Survey. Image links to PDF report.
According to the MWCOG report, the speed in the traffic queue is between 20 and 50 MPH. This would result in between 2 and 12 minutes of delay per vehicle joining the back of the queue heading to the toll plaza. Assuming a duration of 2 hours for the queue, average vehicle occupancy of 1.1 and 1,900 vehicles per lane per mile, this results in between 560 and 3,300 person-hours of delay per day, up to 840,000 person hours per year. Read more…
 The District Department of Transportation (DDOT) is hosting its third and final round of public workshops in October to discuss moveDC, DDOT’s initiative to develop a strategic, multimodal long range transportation plan for the District. The public is encouraged to attend a workshop to review the draft plan and help prioritize the transportation options. The October workshops will enable you to:
- Share your ideas and observations on future plans for transportation;
- Learn how three approaches to a future DC transportation system perform;
- Review the results of our survey research;
- Provide input into the draft transportation plan; and
- Learn more about the moveDC local bus study.
Online Survey
Throughout October, you are also invited to participate in a survey to comment on and critique three approaches that have the potential to transform the way people travel in the District.
Public Meeting Dates and Locations
Monday, October 21
7:00 a.m. to 6:00 p.m.
Union Station
625 First St NE
Tuesday, October 22
6:30 p.m. – 8:30 p.m., with a formal presentation 7 p.m.
Dorothy I. Height/Benning Neighborhood Library
3935 Benning Road, NE
Saturday, October 26
1:00 p.m. – 4:00 p.m.
DCUSA Retail Center, 2nd Floor, between Target and Best Buy
3100 14th St. NW
Wednesday, October 30
6:30 p.m. – 8:30 p.m., with a formal presentation 7 p.m.
Petworth Neighborhood Library
4200 Kansas Ave., NW
Web Meetings
Visit www.wemoveDC.org for more details and to sign up.
October 24, noon – 1:00 p.m.
October 28, 7:00 p.m. – 8:00 p.m.
Categories: In The News Tags: access, bike, bike parking, BRT, bus, meetings, Metrorail, pedestrian, planning, plans, presentations, public comment, rail, stations, tod
The stations on the new Silver Line are two minutes apart in the Tysons area, and the Tysons-area stations are eight minutes away from both East Falls Church and Wiehle-Reston East.
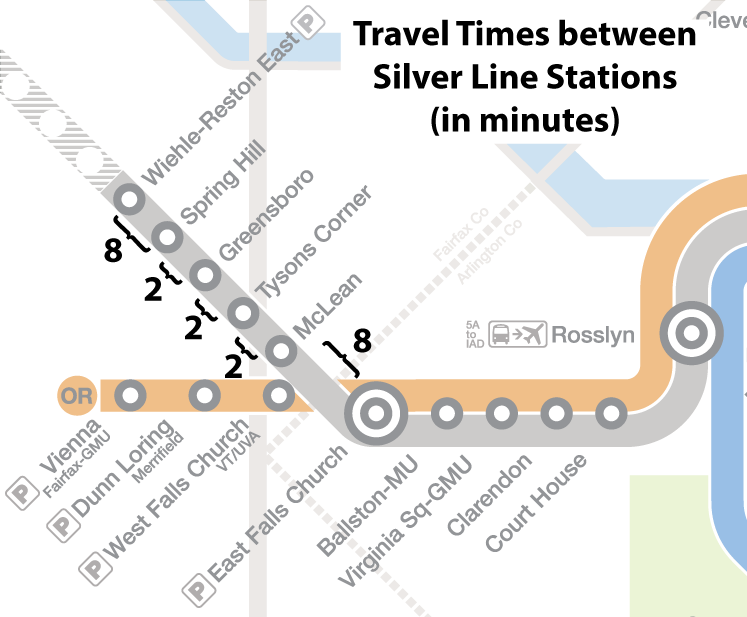
Draft travel times for the new Silver Line stations.
Earlier this year we published a series of posts about the region’s newest rail line, the Silver Line, due to begin service in early 2014. Those posts included answering the questions, “Where will it go?“, “What will happen to rail schedules?“, and “What will happen to bus schedules?“.
Now it’s time to talk about preliminary travel times between Silver Line stations. The map above illustrates the estimated travel times between the five new stations. These times are preliminary and may be refined after operational testing has been completed.
Below is a widget that can be used to look up the travel times between any two stations, including the five new Silver Line stations.*
Read more…
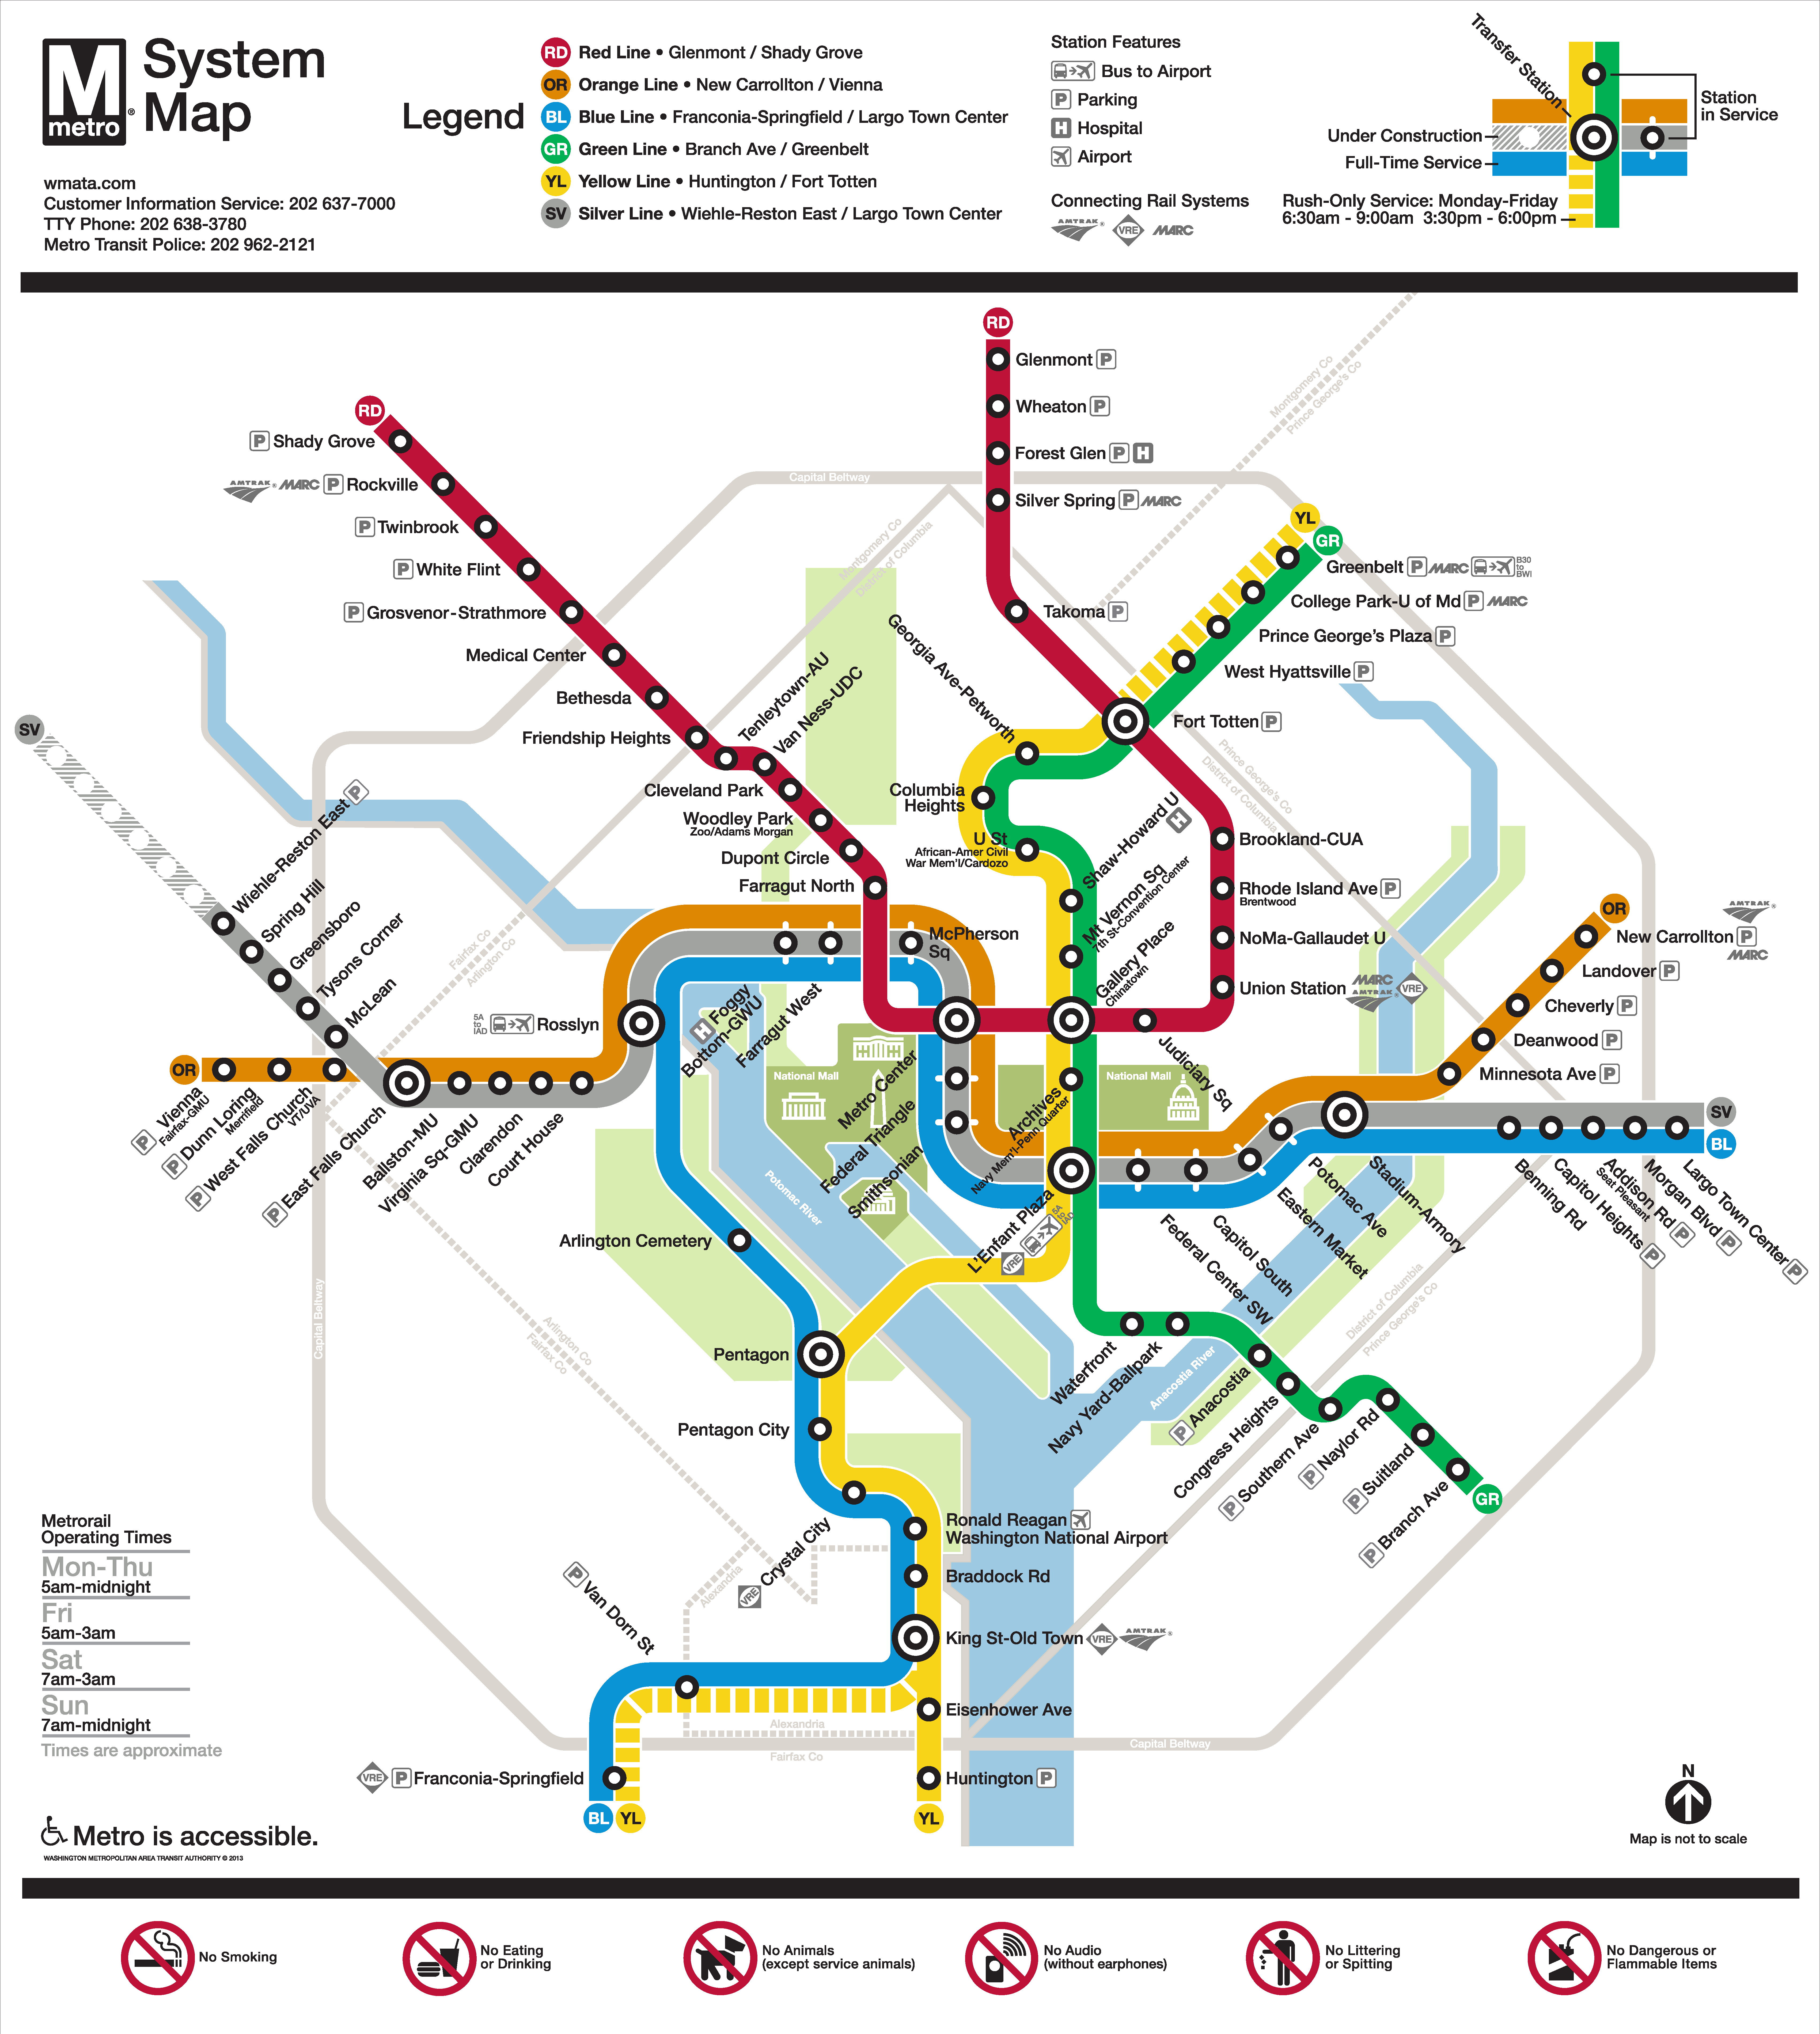
Metro is pleased to release the update to the Metrorail system map that shows phase one of the Silver Line in service and phase 2 under construction.
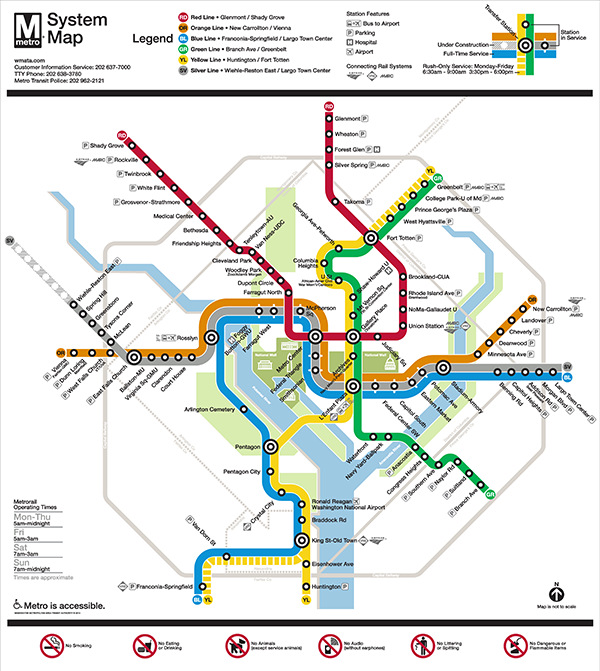
Final Silver Line Phase 1 system map. Click for high resolution version.
Metro’s original system map designer, Lance Wyman, began working with Metro again a few years ago when we needed to update the system map to accommodate the “Rush-Plus” service plan. Since then, the team has been working to incorporate the Silver Line onto the system map. After several months and extensive customer feedback, Metro is pleased to release the updated map, above. Read more…
Metro is addresses crowding, integration of Purple Line in new Silver Spring Capacity Analysis.
Metro staff have recently kicked off a capacity analysis of the Silver Spring station. The purpose of this study is to evaluate how well the station is functioning currently in terms of access and egress, vertical circulation, and faregate crowding. The study is also looking at how to accommodate growth in demand due to the opening of the Purple Line as well as increasing job and household density in Silver Spring and the region between now and 2030.
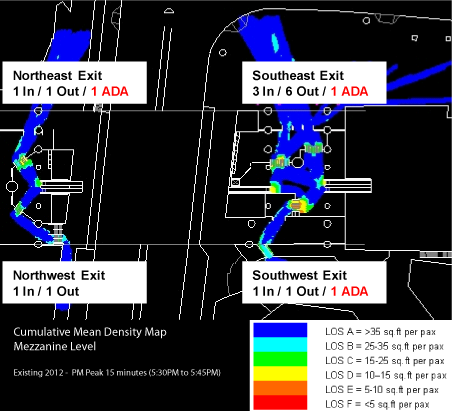
The current conditions assessment is nearly complete, and shows that the station is performing well under normal conditions. The graphic above is a cumulative mean density map, illustrating the average amount of “elbow room” each passenger has during the peak 15 minutes. It shows that the current configuration of faregates at the two mezzanines (north is to the upper left corner) is adequate to service PM peak period demand, with only a little crowding (orange) near some faregates.
This post focuses on the PM peak period because Silver Spring has more station exits in the PM peak than the AM peak: exiting passengers all disembark the train at the same time, which can cause queues to form at escalators and faregates. Passengers entering the station, however, tend to trickle in and don’t put as much of a strain on station facilities. These passengers can crowd the platform waiting areas, which will also be evaluated under this study.
Read more…
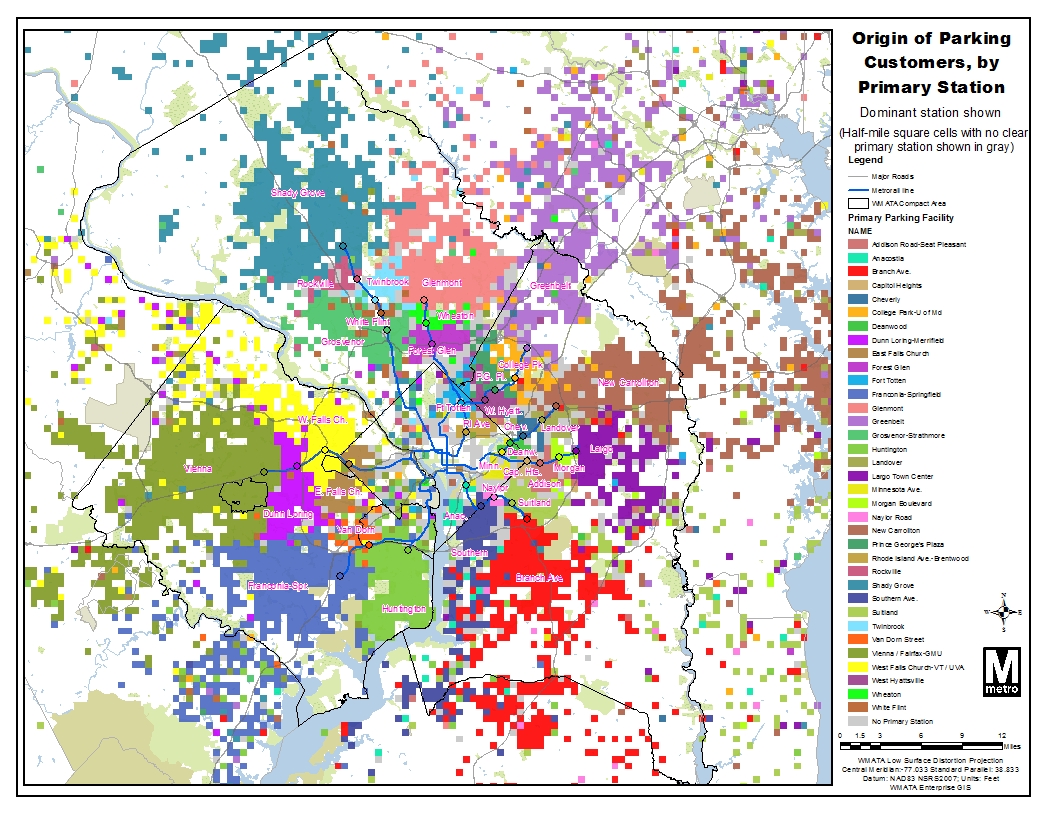
A handful of end-of-line stations’ parking facilities are doing the lion’s share of extending the reach of Metro across the region, while parking at most other stations primarily serves nearby residents.
Parking at rail stations is traditionally thought to extend the geographic reach of transit in the region, by giving longer-distance commuters a way to access a rail station. Based on an analysis of Metro parking customers’ origins, a handful of large end-of-line Metro parking facilities perform this function, but most Metrorail parking facilities do not. Nine Metrorail stations are capturing 70 percent of all customers who drive from more than three miles to park-and-ride, while the 26 other Metro parking facilities primarily serve the surrounding neighborhoods.
Our map of parking customers’ origins showed how far Metro’s reach extends across the region. Now, this map shows the dominant station among Park & Ride customers, by half square-mile, for a typical weekday:

Map of dominant station of Park & Ride customers, highlighting each station’s “catchment area.”
Areas where there is no clear primary station are shaded gray: for example, the dividing line between Southern Ave. and Branch Ave. stations. The dominant station is shown, regardless of how many Park & Ride customers there are for a square. There is some noise in this data, but two “flavors” of parking emerge: Read more…
The number of Metrorail customers riding their bike to the train station increased by 50% over the last 5 years, as Metro makes progress towards its 2020 goal to attract more bicyclists.
More cyclists are accessing Metrorail by bike than ever before. According to results from the 2012 Metrorail Passenger Survey, the number of riders bicycling to Metrorail in the morning rush hour increased from around 1,550 to over 2,380 per day between 2007 and 2012. Bike access to Metrorail now accounts for 1% of entries each morning, which moves us closer to our Board-adopted goal of over 2% (over 7,000 bicycles!) by 2020.

In this survey, riders who access rail by bicycle in the morning peak could be taking Capital Bikeshare to the station, riding and parking their own bike at the station, or bringing a folding bike on-board. The Passenger Survey is one way we measure bicycle access. We see a similar pattern in our annual count of bike racks at stations each spring (currently nearing completion for 2013, stay tuned).
The growth in bike access has happened at the same time as bicycling is increasing generally in the region, and as Metro has added more bike racks at stations to accommodate and encourage bicycling, including a secure Bike & Ride parking prototype facility at College Park station.
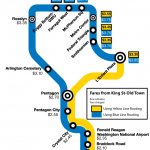
Metrorail charges you the lowest possible fare, even if other trips that seem longer are less expensive.
Recently a Twitter user asked a simple question: when traveling from King St-Old Town why does it cost more to travel to McPherson Sq than to Metro Center? As a straight shot on the Blue Line, McPherson Sq is closer than Metro Center, so why is the trip to Metro Center cheaper?
We recently described how Metrorail fares are calculated. However, the previous post failed to mention is that when there are two or more routes to travel between any pair of stations Metro uses the least expensive one.
For the example above, there are a few routes to travel between King St-Old Town and McPherson Sq. The shortest trip when considering the miles on the railway is to take Yellow to L’Enfant Plaza and then transfer to Blue or Orange, which results in 8.12 miles and a peak fare of $3.65. The fare to Metro Center is only $3.55, because it is only 7.82 miles from King St-Old Town via L’Enfant Plaza. For a rider taking the Blue Line to McPherson Sq, it might seem unfair that customers traveling one additional stop pay $0.10 less. Read more…
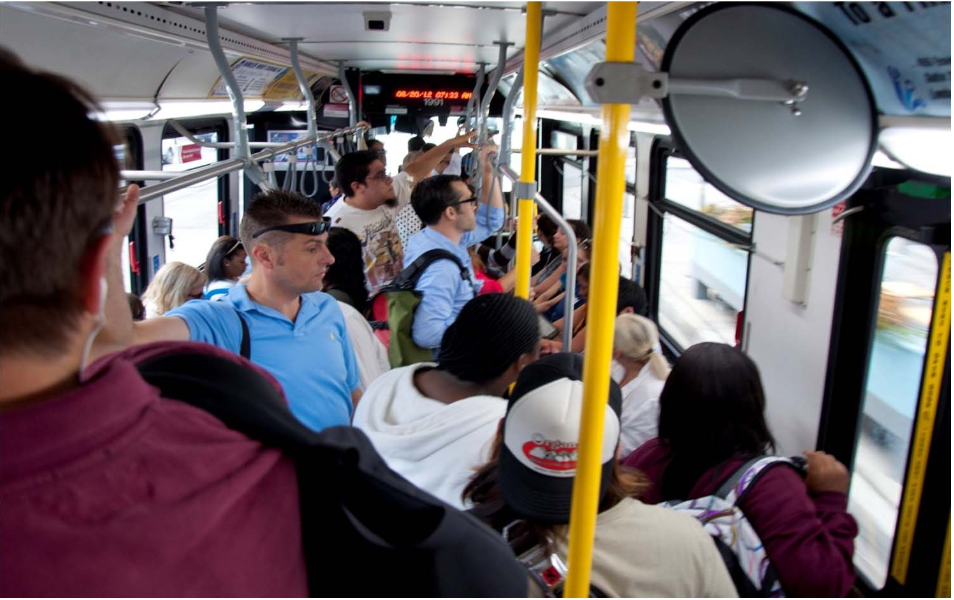
The Chicago Transit Authority (CTA) proposed a decrowding plan last fall, and after one quarter, it appears to be working.
Source: CTA Crowding Reduction Plan: http://www.transitchicago.com/assets/1/miscellaneous_documents/Public_hearing_presentation_FINAL_090412s.pdf
They proposed the plan to reduce crowding and meet growing ridership needs (In September, they announced that “CTA ridership has risen 16 straight months, adding 22 million riders since June 2011.”) The original plan essentially:
- added service to 48 high ridership bus routes
- added 17 rail trips to the Red, Blue, Green, Purple, Brown, and Orange lines during weekday rush hour
- added rail trips to the Red, Brown, and Blue lines during weekend service
- discontinued service on 12 low ridership bus routes (or duplicative)
- discontinued service on 4 bus route segments (the entire bus route was not axed).
These service changes went into effect mid-December, 2012. The reasoning behind the addition of service and discontinuation of service was justified by the fact that the high ridership bus and rail routes represent more than 75% of the average daily ridership while the discontinued routes only represented less than 2% of its average daily ridership. Additionally, for the discontinued routes, there was another transit option nearby, such as a rail line, or another bus route. These cuts were also closely coordinated with the suburban bus company, Pace.
Read more…


Recent Comments