To help the region and our partners plan alternatives and mitigate the impacts of SafeTrack, Metro releases rail ridership data applicable to this important maintenance effort.
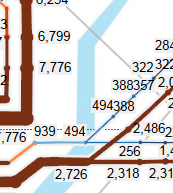
 Rail Link Volumes: This data describes the number of customers on board trains between two contiguous stations, for a given hour of the day, then assigned to rail links. For example, the link volume from Bethesda to Friendship Heights is the sum of everyone who boarded upstream, minus those who exited at or before Bethesda. This can be useful for planning SafeTrack mitigation efforts because it gives a first-order estimate of the potential demand for a bus bridge, for example.
Online Interactive Map of Metrorail Link Volumes, average weekday and Saturday in May 2015
Metrorail Link volumes, average weekday in May 2015, by hour, by line color (580kb, .xlsx)
Read more…
 See how seasons, land use, and service drive trends in rail ridership at the station level, in this new data download.
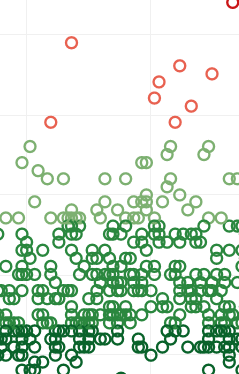
This latest data download shows Metrorail ridership by station, by month, for the last five years or so. It hints at the complex factors driving rail ridership – from short-term effects like weather or service changes, to long-term trends like real estate development and office relocations.
We see a few tidbits in this data:
- Seasonal trends: rail ridership follows a predictable pattern each year – peaking in the summer and around Cherry Blossoms, and reaching lows around the holidays. Compare the high seasonality of Arlington Cemetery to a more commuter-oriented station, for example. Ridership in the summer at that station can quintuple over its winter base.
- Weather impacts: see how the blizzard this past January lowered the average for the month as service was shut down.
- Service changes: See how the opening of the Silver Line shifted riders from Orange to Silver in July-August 2014.
- Land Use is key! Look at the recent growth rates at stations like Navy Yard and NoMa (formerly New York Ave.), reflecting the new jobs and residences near those stations.
Metrorail Ridership, by Station by Month, 2010-2015, Average Weekday (.xlsx, 120kb)
Metrorail Ridership, by Station by Month by Period, 2010-2015, Average Weekday (.xlsx, 630kb) (Added 3/30/2016)
Notes: these numbers are raw entries for an average weekday in the month, including snow days, excluding holidays when we did not run a weekday schedule. The numbers are for trend analysis and will differ slightly from those we report in financial statements, which undergo additional data scrubbing and normalization.
What do trends you see?
 Rail Link Volumes: This data describes the number of customers on board trains between two contiguous stations, for a given hour of the day, then assigned to rail links. For example, the link volume from Bethesda to Friendship Heights is the sum of everyone who boarded upstream, minus those who exited at or before Bethesda. This can be useful for planning SafeTrack mitigation efforts because it gives a first-order estimate of the potential demand for a bus bridge, for example.


Recent Comments