Author Archive

Metro 2025: Why Now?

March 11th, 2014 1 comment

Four reasons why we need to begin the Metro 2025 investments now.

1. Because Metro 2025 is critical for growth. For the last three decades, the Washington region has grown in lockstep with an expanding transit system.  Since Metrorail opened in the late 1970s, the system has grown steadily, and in 2014 Metro provides two to three times more service (rail and bus vehicle-miles) than it once did.

For decades, this region has grown in lockstep with Metro.

Today, no significant new Metro service is planned beyond the Silver Line, yet MWCOG estimates that the region will continue to grow at a steady clip for years to come.  The only transit expansion projects that are planned complement and depend on connections to Metro, such as the Corridor Cities Transitway or Columbia Pike Streetcar, and may even increase the strain on Metrorail’s core.

2. Because we could lose jobs.  Without investment in the region’s transit backbone, economic growth and prosperity is threatened. In fact, studies have shown a clear link between growing congestion and declines in job growth. Without Metro 2025, this region could stand to lose nearly 133,000 jobs by 2040.

3. Because Metrorail is crowded, and it will get worse without Metro 2025. Today, Metrorail is reaching its capacity in many places. On the Blue and Orange lines for instance, Metro is running trains every 2.5 minutes, which is the most the infrastructure can handle, but even so, many trains are too full to board, or experience uncomfortable levels of crowding. Lines form at many stations to get through escalators, elevators, and fare gates.

Without eight-car trains and fixing station bottlenecks, crowding and congestion on Metrorail will continue. The map below shows our projections of crowding (passengers per car) into the future, if we don’t undertake Metro 2025:

Crowding on Metrorail will worsen without the investments in Metro2025.

Crowding on Metrorail will worsen without the investments in Metro 2025. (Animated.)


4. Because Metrobus is stuck in traffic and needs relief. Metro’s buses are frequently caught in street traffic, which increases travel times, degrades reliability, and increases Metro’s operating costs just to maintain frequencies.

Bus-Speeds

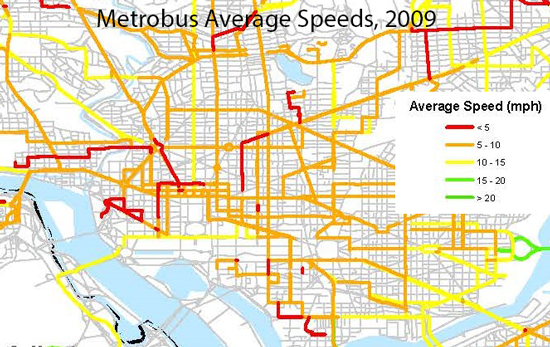
Illustration of Metrobus speeds from 2009. The red is 5 MPH or less. Click for full version.

In fact, numerous Metrobus corridors operate at speeds of less than 10 MPH, and several showed speeds of under 5 MPH.  On many corridors, buses operate at a brisk walking pace even though they are carrying many more passengers than the traffic around them.  On H and I Streets NW, buses carry 40% of the passengers but are only 2% of the vehicles. On 16th Street NW, buses carry 50% of the passengers, despite using just 3% of the vehicles.

To increase bus service, speeds, and reliability, we need to invest in bus-only lanes, bus priority at traffic signals, and additional buses.


What Are the “Metro 2025” Projects in Momentum?

March 6th, 2014 1 comment

Metro’s Momentum plan calls for seven medium-term capital initiatives – known collectively as Metro 2025.  And last week, Metro applauded a funding agreement from Maryland, Virginia, and the District of Columbia for $75 million as a “down payment”  to begin work on Metro 2025.  This is welcome news, indeed, and allows Metro to prepare to begin work on much-needed capacity increases to support the region’s growth.

Those of you who are less familiar with Momentum may be wondering: “What exactly are these projects?”

In a nutshell, the Metro 2025 initiatives are:

M25 Icons_All 8s

Eight-Car Trains

Today, most Metrorail trains have only six cars, and that means crowding  – which is only projected to worsen.  This project would enable Metro to run all eight-car trains in the peak period, which are the longest possible in our stations, and add 35% additional capacity to the rail network. It would expand the rail fleet and yards, and improve the power and signal infrastructure to handle the load.

M25 Icons_PCN-01

Core Station Improvements

If we lengthen the trains, we need to expand key stations as well! Since-eight car trains add capacity for 35,000 more trips per hour, 80% of rail customers transfer or alight in the core, and most of these core stations are already over capacity, we need more core station capacity. This project would enlarge platforms, and add escalators, elevators, stairs, and pedestrian passageways to 15 stations.

M25 Icons_Bus Fleet

Bus Priority Corridors and Fleet Expansion

The Priority Corridor Network would construct bus-only lanes, give buses priority at traffic lights, and bring service similar to MetroExtra to 24 lines throughout the region. The PCN will take tens of thousands of cars off the road, add 100,000 riders, moving buses 50% faster, and cut fuel costs.

In addition, this project would expand Metro’s bus fleet by around 400 buses, allowing us to increase frequencies.

M25 Icons_New Blue Line Options

New Blue Line Connections

Metro faces a bottleneck at Rosslyn station, where three lines (Orange, Silver, Blue) converge. This major project would try to fix this bottleneck, and restore six-minute Blue Line frequencies between Pentagon and Rosslyn stations. We are analyzing the feasibility of a few options, including a second Rosslyn Station that would enable underground transfers between the two stations.

M25 Icons_NexGen Communications

Next Generation Communications

This program would expand our current communications infrastructure to provide an integrated one-stop communication hub for the regions’ transit customers. Improvements would include: radio system upgrades, real-time bus information at bus stops, and new public address system at stations.

M25 Icons_Pocket Tracks

Pocket Tracks and Crossovers

This project would add special trackwork at key locations in the rail network to give us more flexibility with Metro’s two-track system. These new tracks would allow us to turn trains around, add system flexibility to Metro’s two-track system, and store trains at important locations.

Categories: Metro 2025 Tags: , ,

Yesterday’s Metrorail Ridership: Recovering from a Snowstorm

March 5th, 2014 3 comments

Yesterday, as everyone recovered from a snowstorm, here’s what happened to Metrorail ridership.

After Monday’s snowstorm, yesterday the federal government in the Washington region issued a two-hour delayed opening, and many schools opened with a delay or remained closed. Metrobus began the morning operating on a snow emergency plan, but by afternoon had restored full service.  Here’s what that meant to Metrorail ridership:

Metrorail ridership on Tuesday, when the federal government and many schools opened with a 2-hour delay.

Metrorail ridership on Tuesday, when the federal government and many schools opened with a 2-hour delay.

Note: the prior Thursday (Feb. 27, 2014) stands in as a typical weekday above, for comparison.

It looks as if the apex of the AM peak period occurred 15 minutes later than usual.  Many riders appeared to delay travel in the morning, resulting in a much more gradual end to the morning peak.

How was your commute different on March 4?

This data is available for download (.xlsx, 13kb).

Categories: Impact Tags: , , , ,

Transfers: Part of Every Rail Transit System

February 6th, 2014 5 comments

About a third of Metrorail customers transfer between lines to complete their trip, and this is not too far off many of our peer transit agencies.

Everyone would prefer a “one-seat ride” (aka “transfer-free ride”) from origin to destination, but for many, transfers are a necessary part of commuting life. In fact, transfers may be even beneficial. Transfers are a part of nearly every large rail transit system with multiple lines, including Metro.  As the chart below shows, 35% of Metrorail passengers change trains at some point during their journey, and that’s slightly higher – but not wildly different from – many of our peer transit systems in the U.S.

(same scale for all images) City Customers Transferring *
cities__0002_Layer-5

New York City Subway

pct-01
 cities__0003_Layer-4

WMATA Metrorail

pct-02
cities__0000_Layer-2

Boston MBTA, Subway

pct-03
 cities__0001_Layer-6

Philadelphia, SEPTA

(excl. Regional Rail)

pct-04
cities__0004_Layer-3

Chicago Transit Authority, Rail

pct-05
* Estimated rail-to-rail transfers per boarding. Data from NTD and agencies. Maps from Fake Is The New Real.

Read more…

Silver Line Already Spurring Massive Development

January 16th, 2014 Comments off

In anticipation of the Silver Line, nearly twenty development projects, with an estimated value of more than $18 billion, are underway near the Metrorail stations,  helping attract riders and generating valuable benefits for Fairfax County.

Anticipating the Silver Line, 20 development projects are underway around the new stations

Ahead of the Silver Line, many development projects are underway around the new stations. Image from Cushman and Wakefield, click link at left for full report.

In a new report, the real estate firm Cushman & Wakefield documented twenty real estate development projects “in the pipeline” near the five new Silver Line stations. Some are under construction now, others are in the approvals process, and a few are on hold, but together they total:

  • Over 20 million sq. ft. of new office space, which would increase the total office space in the Tysons area by 40%.
  • Over 2 million sq. ft. of new retail space. That’s more than twice the size of the Tysons Galleria mall.
  • 17,800 new residential units, or more than double the current population of the Tysons area.
  • 9,300 hotel rooms

Metro estimates that these projects are valued at more than $18 billion, and will generate millions per year in tax revenue for Fairfax County (estimated using industry-standard construction costs). Some of this tax revenue will be captured by special tax districts in the Tysons and Silver Line areas.  In 2011, we estimated that Fairfax County received around $30 million in tax revenues from properties within a half-mile of its five existing non-Silver stations.

The development brings great benefits to Fairfax County and will encourage riders to use the Silver Line, but there remains a strong need to improve the walking and biking environment near the new stations. Pedestrian and bicycle access will be key to meeting our ridership goals for the new Metrorail line, but walking and bicycling conditions remain challenging in the area.


Categories: In The News Tags: , ,

Significant Property Tax Values Generated near Metro Stations

December 12th, 2013 Comments off

New buildings right near Metrorail stations are 23-30% more valuable than buildings farther away, showing that our funding partners can generate significant property tax revenues from Metro.

A recent study shows that Metrorail stations in Arlington’s Rosslyn-Ballston corridor are powerful anchors for economic development and value. The report, by the real estate firm Cushman & Wakefield, showcases the substantial value the region can realize with good transit-oriented development policies near stations. Among the report’s findings:

Offices in the Rosslyn-Ballston corridor right near Metro command higher rents.

Offices in the Rosslyn-Ballston corridor right near Metro command higher rents. Source: Cushman & Wakefield via washingtonpost.com.  Click for original context.

  • Being able to walk to Metro is worth a lot. New office buildings within 500 feet of a station in Arlington’s Rosslyn-Ballston corridor are earning a 30% premium over buildings under construction just a quarter-mile away. For apartment buildings, the premium is 23%. No wonder walk access to Metrorail is on the rise, especially from those close by the station!
  • 92% of over 20 million square feet of office space under construction in the Rosslyn-Ballston corridor is within a quarter mile of a Metrorail station.
  • Conversely, new office buildings built farther than a quarter-mile from Metro are worth 18% less in rent.

These “rail premiums” of 23-30% are significantly higher than the 7-9% we found in our “Business Case for Transit” study, because of several significant differences in methodology. We looked at the assessed value, not the market/rental rate of property. Also, we looked at all properties in the region, rather than just those under construction in one corridor.

Although the presence of Metrorail creates this value premium near stations, Metro does not receive any of these revenues directly, even though continued rebuilding and improvements are needed to address state of good repair and relieve capacity issues in the corridor.

Nevertheless, this report certainly confirms that Metrorail increases property tax revenues, and shows just how big that value can be in certain markets.

Where Are Low-Income and Minority Metrorail Riders?

October 9th, 2013 5 comments

The demographics of Metrorail riders change dramatically station to station, and reflect the race and income divisions of our region.

As part of Metro’s Title VI program, we spend time making sure we don’t disproportionately impact low-income and minority riders when we change and deliver service, change fares, and other policy changes. Our 2012 Metrorail Passenger Survey tells us a good deal of information about the race and income ranges of our riders, by where they are going, and when they travel.  We conduct this research ourselves, giving us an extremely robust dataset on our riders. These survey responses are a key source of data underlying our Title VI analyses. In many ways, these results confirm that our region remains a Region Divided by income and race – across a noticeable east-west divide.

The map below shows low-income Metrorail riders by origin station, for a typical weekday in May 2012. Metro defines low-income as a rider with a household income less than $30,000 per year. Low-income ridership is somewhat concentrated in several areas, such as the inner southeast Green Line, and inner stations on the eastern Blue and Orange lines. The Green Line between Prince George’s Plaza and Shaw-Howard is also home to relatively large proportions of low-income riders.

No single station is more than 45% low-income.

hghg

Average Metrorail ridership is 11% low-income, but can range from 3% to 40% station to station.

The next map shows minority Metrorail ridership by origin station, again for a weekday in May 2012. For Title VI purposes, a minority is defined as anyone who self-identifies as other than White, Non-Hispanic on our passenger survey. Minority ridership is concentrated most heavily on the eastern side of the rail network, but is also spread across other areas of the network as well – e.g., Wheaton and Glenmont, the Green-Yellow line. No single station is less than 22% minority.

Average Metrorail ridership is 42% minority, but the rail system shows an east-west divide, similar to the divisions facing our region. Some stations are over 90% minority ridership, while others are as low as 22%.

Average Metrorail ridership is 42% minority, but the rail system shows an east-west divide, similar to the divisions facing our region. Some stations are over 90% minority ridership, while others are as low as 22%.

We remain mindful of the travel patterns of low-income and minority riders, and use this data to help avoid disproportionate impacts to these riders when we make changes to the system. For example, we analyzed the impacts of the Silver Line at the passenger-trip level, looking at impacts and demographics at the individual origin-destination (O-D) pair level.

What patterns do you see here? Does anything jump out at you?

Categories: Metrorail Studies Tags:

How Do Metrorail Riders Get to Their Station in the Morning?

September 30th, 2013 3 comments

Peds_CrystalCityTwo-thirds of Metrorail riders take transit, walk, or bike to Metrorail for their morning commute.

Every morning, thousands of people walk through the faregates and into Metrorail. Did you ever wonder how they get to their station? Our 2012 Metrorail Passenger Survey tells us the answer to this question, for the morning rush:

  • More than a third (38%) of Metrorail riders get to the station in the morning by walking or biking.
  • Another quarter arrive by bus – Metrobus, as well as other bus operators in the region.
  • Another third arrive by car – most by parking at or near the station, but some by getting dropped off.
  • Finally, about 4% of riders arrive via commuter rail – mostly at Union Station.

Of the 25,000 or so daily riders who access rail by “Other Bus,” the top three contributors are Fairfax Connector (6,700), Montgomery County’s RideOn (5,700), and private shuttles (4,900). Of those who parked at their station, one-third were driving from less three miles away. Carpooling to Metrorail is very low – we estimate average vehicle occupancy at 1.03 passengers per parked car.

Systemwide_Metrorail_AccessMode_May2012

The map below shows how the answer to “How Did They Get to the Station?” varies dramatically station to station. (For the sake of legibility on this map, I’ve simplified the access modes into 4 groups). Read more…

2013 Bicycle Parking Census at Metrorail Stations

September 9th, 2013 6 comments

Bicycles parked at racks at Metrorail stations inched up again this year, and Union Station is now Metro’s number-one station for bicycle access.

Union Station is now the busiest Metrorail station for bicycle access.

Union Station is now the busiest Metrorail station for bicycle access.

Using bike rack counts – one of two ways we gauge bike-to-rail access – bikes parked at Metrorail stations increased by 1% in the last year.  The number of bike racks increased 20% over the same time period. (The second measurement of bike access from theMetrorail Passenger Survey was published last week here).

Some highlights:

  • Overall bikes parked is up slightly above 2012.  However, we observed each station only once or twice, so it is difficult to discern long-term trends from short-term variation so far.
  • Union Station is now the single biggest station for bicycle access, not including bikes parked  inside the BikeStation there. We counted 130 bikes at that station, well beyond the capacity at racks.
  • Bike parking capacity is up 20% since 2012, including the College Park Bike & Ride. Metro now has space for over 5,000 bicycles at stations. We (and our partners) continue to add bike parking capacity to stay on track to reach our goal of 7,000 bicyclists by 2020.
  • Bike use increased at several major stations such as East Falls Church, Vienna, Greenbelt, and NoMa, but decreased at other stations such as King Street, Braddock Road, and Franconia-Springfield.
  • Bicycle numbers remained about even at several perennial heavy-hitters like Medical Center, Takoma, Grosvenor, and Columbia Heights.
2011 2012 2013 2011-12 Change 2012-13 Change
Parked Bicycles 2,196 2,271 2,285 3% 1%
Bike Rack Capacity 3,544 4,239 5,136 20% 21%

Read more…

Categories: Planning Studies Tags: ,

Metro’s Two Flavors of Parking

September 4th, 2013 4 comments

A handful of end-of-line stations’ parking facilities are doing the lion’s share of extending the reach of Metro across the region, while parking at most other stations primarily serves nearby residents.

Parking at rail stations is traditionally thought to extend the geographic reach of transit in the region, by giving longer-distance commuters a way to access a rail station. Based on an analysis of Metro parking customers’ origins, a handful of large end-of-line Metro parking facilities perform this function, but most Metrorail parking facilities do not. Nine Metrorail stations are capturing 70 percent of all customers who drive from more than three miles to park-and-ride, while the 26 other Metro parking facilities primarily serve the surrounding neighborhoods.

Our map of parking customers’ origins showed how far Metro’s reach extends across the region.  Now, this map shows the dominant station among Park & Ride customers, by half square-mile, for a typical weekday:

Map of dominant station of Park & Ride customers, highlighting each station's "catchment area"

Map of dominant station of Park & Ride customers, highlighting each station’s “catchment area.”

Areas where there is no clear primary station are shaded gray: for example, the dividing line between Southern Ave. and Branch Ave. stations. The dominant station is shown, regardless of how many Park & Ride customers there are for a square. There is some noise in this data, but two “flavors” of parking emerge: Read more…