
Buses and Trains and Vans, Oh My! – How Metro’s Operating Budget Pays for Service
Ever wondered how much service your transit fares pay for, or how your tax dollars are spent? Read all about the intricacies of Metro’s operating budget!
How to Get Involved
Do you want a say in Metro’s budget? A public comment period on the FY17 budget (both capital and operating) is now open, and it will end 9am on Monday, February 29th. Please submit your feedback the following ways:
- Take an online survey at wmata.com/budget.
- Email your written comments at writtentestimony@wmata.com.
- Attend a formal public hearing at Metro Headquarters, 600 5th St NW, Washington DC, on Monday, February 22. An Open House will begin at 6 p.m. and the Public Hearing will begin at 6:30 p.m.
Additional communications and outreach efforts will continue over the next few weeks, including notification to local stakeholders and community based organizations; signs posted in Metrorail stations, Metrobuses, and MetroAccess vehicles; surveys sent to a statistical sample of registered SmarTrip® cardholders; ads in local English and non-English publications; and other media efforts including advisories, press releases and social media. The online survey and legal notice will also be available in seven languages.
Staff will summarize and present community feedback to the Board in March, and the Board will use that feedback as a vital input in budget negotiations before adopting a final budget in April.
So be on the lookout for opportunities to learn more about next year’s budgets and to have your voice and ideas heard!
Operating Budget Basics
This is the last of three related posts that attempt to simplify the complex world of transit system funding, and to give Metro’s riders and regional residents some tools to engage in budget discussions. The first post focused on the Capital Funding Agreement (CFA, PDF) and the Capital Improvement Program (CIP, PDF), which together establish a six-year framework for funding projects that improve the Metro System’s safety, reliability, and performance. The second post focused on the annual capital budget, and this post discusses the annual operating budget.
If you walk away from this post with nothing else, the graphic below summarizes the most important points about Metro’s operating costs and who ends up paying the bills:
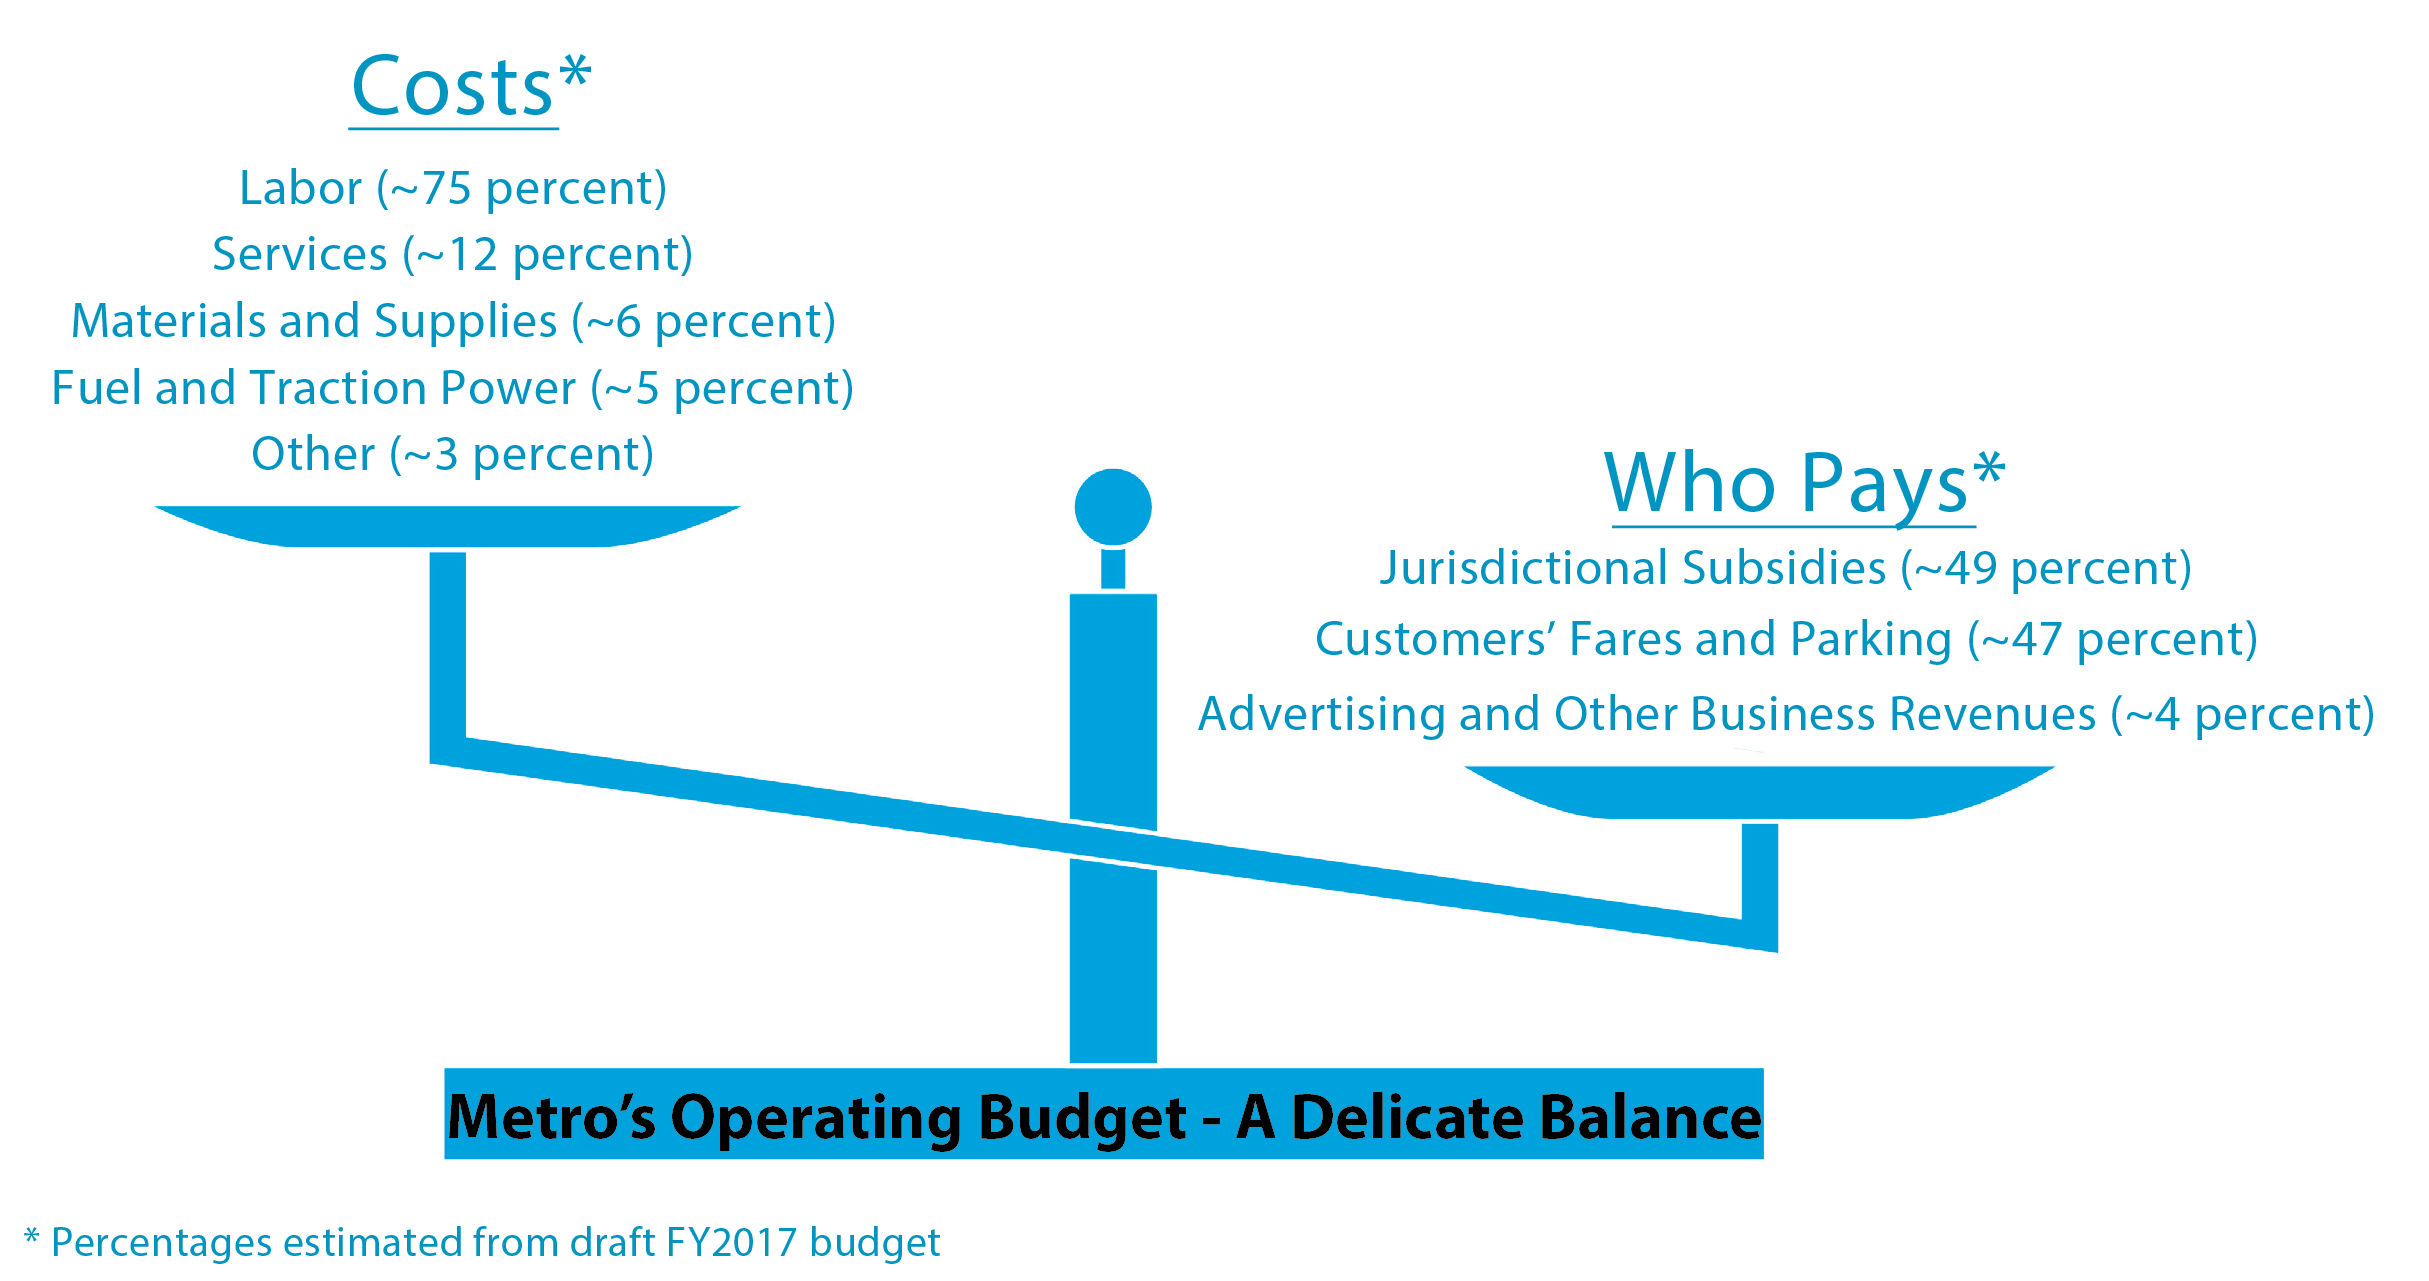
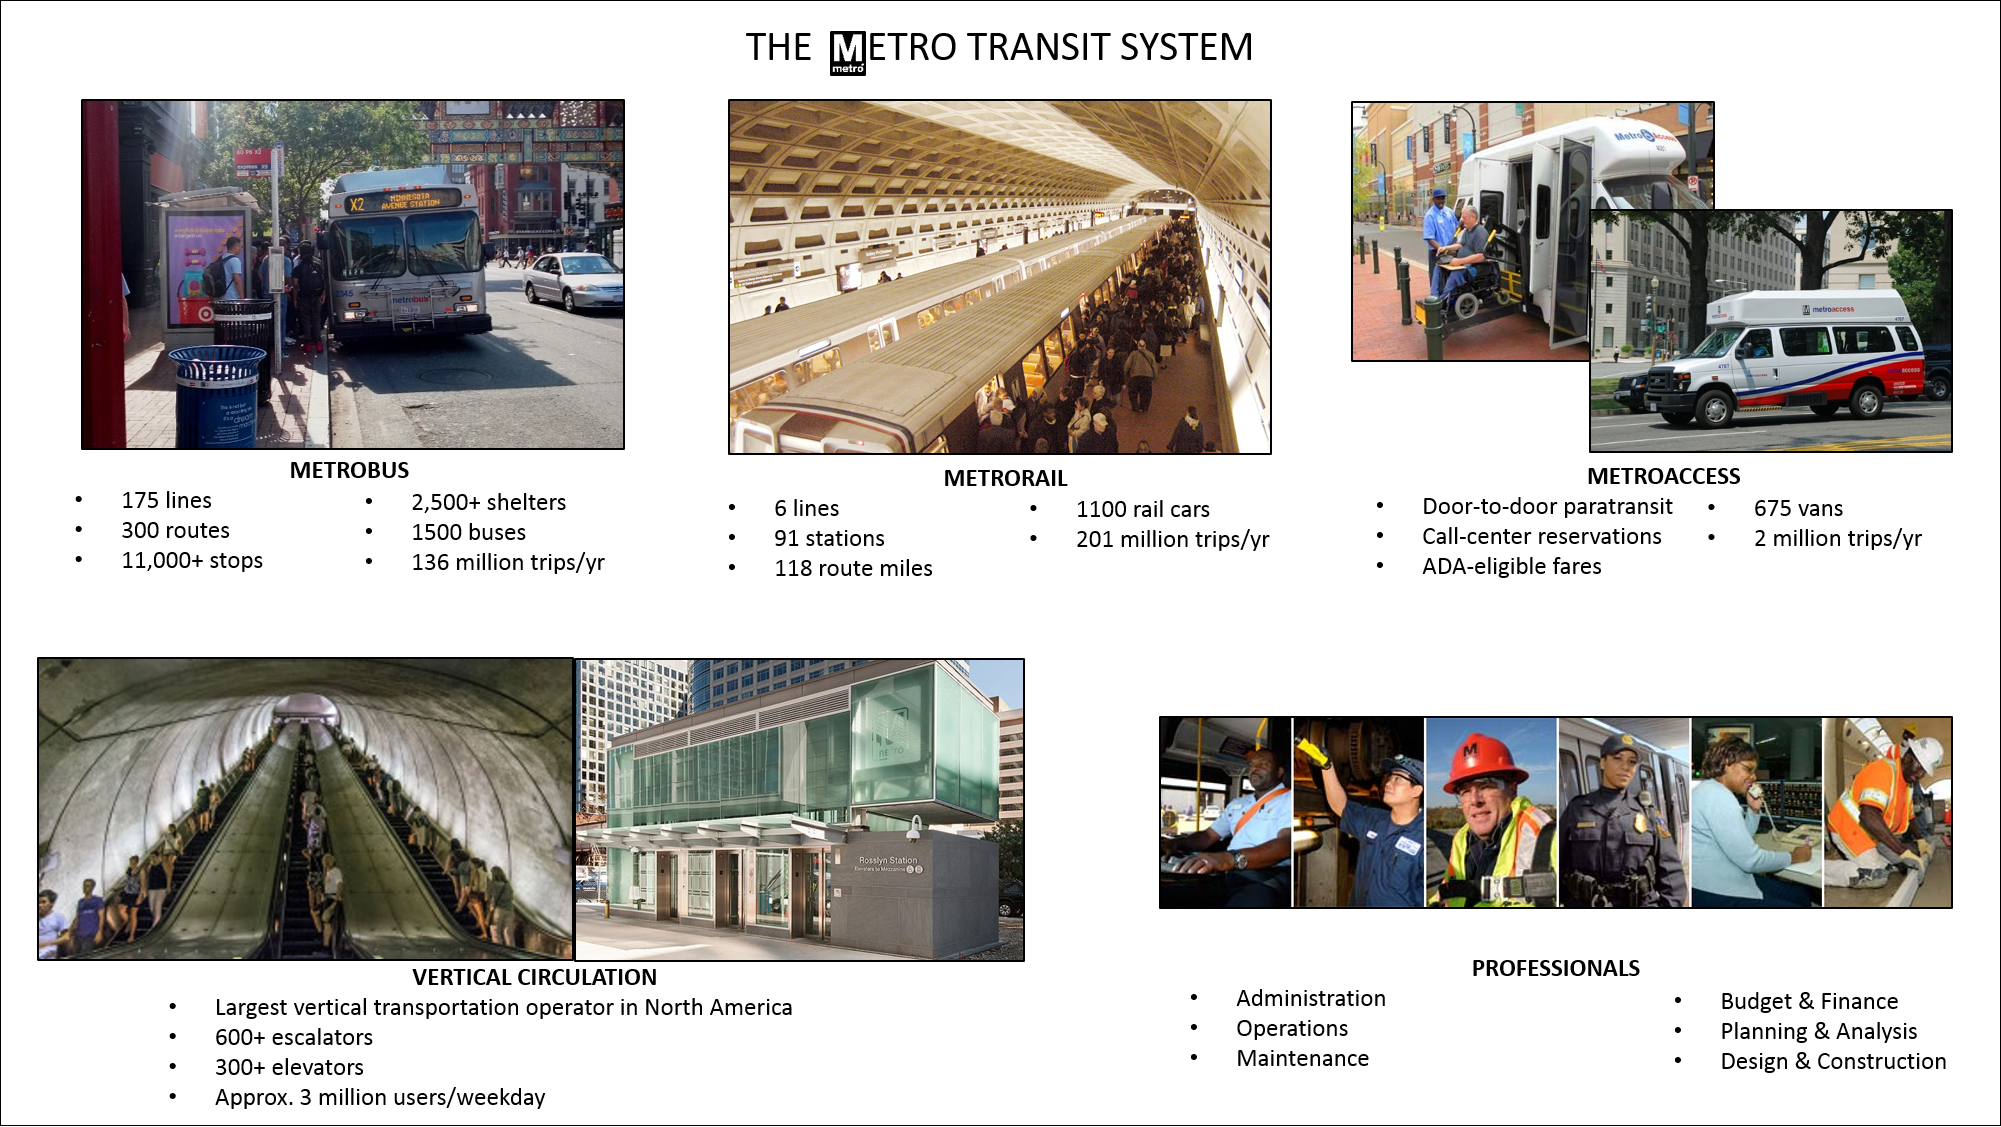
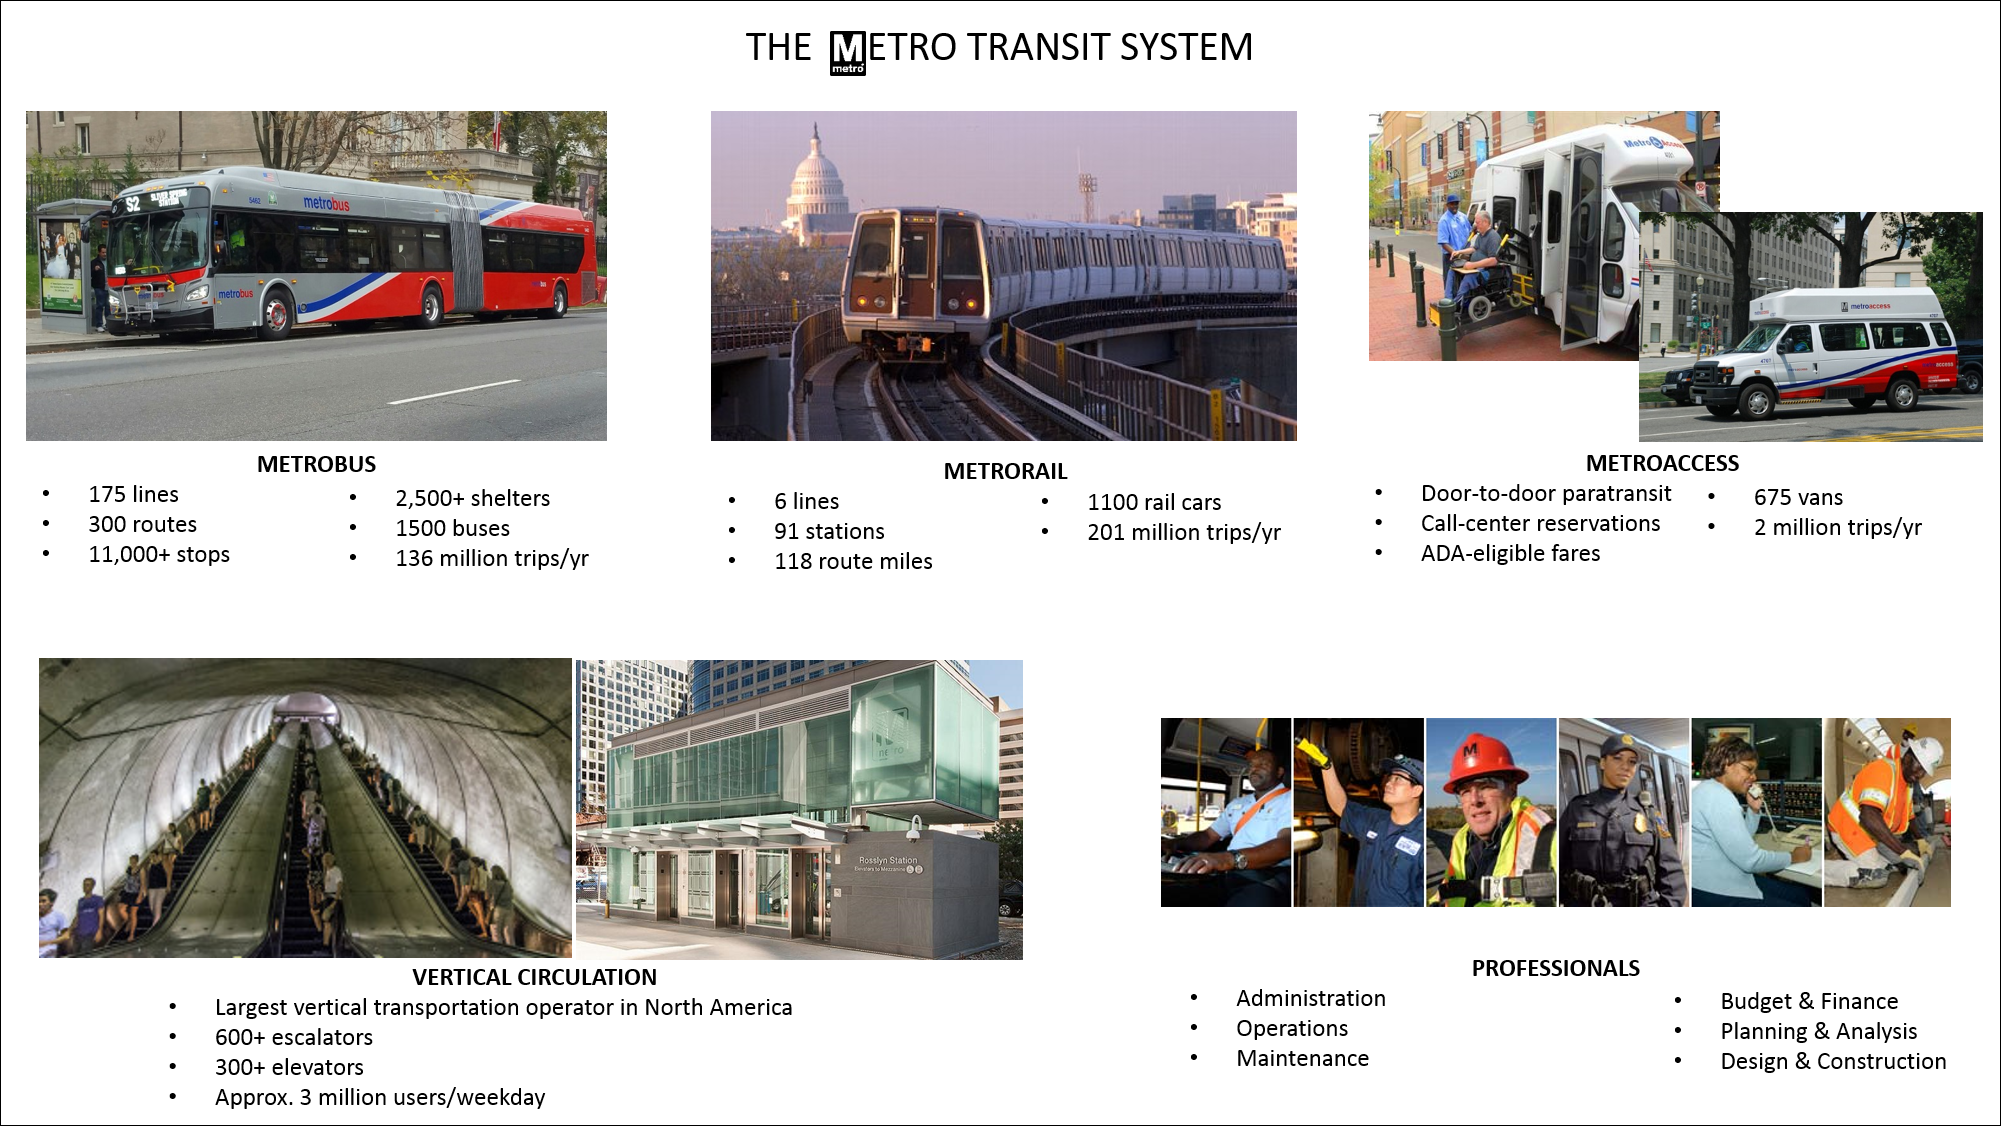
The capital budget pays for projects where Metro is building something or buying equipment: purchasing new buses and rail cars, building a new station entrance, improving a bus stop, or buying new parts for escalators. The operating budget pays the costs (salaries, fuel, utilities) of running the system on a daily basis, including all the customer services highlighted in the graphic below:
Metro’s costs of doing business have been rising steadily every year, but unfortunately Metro’s revenues have either grown at a slower pace or been flat. This dynamic tension has created an intense need to fill the gap between costs and revenues, but that need runs up against an opposing pressure not to reduce service levels, increase fares, or impose higher costs on the counties and cities Metro serves (the Compact jurisdictions). Metro staff have developed a draft FY17 budget that appears to balance these conflicting forces, and we are currently running a public engagement process to gather feedback on that recommended budget.

Recent Comments