
BART’s Core Capacity Challenge
Regular readers of this site know that Metro is developing a Strategic Plan, Momentum, which makes the case for additional major capital investments we’ll need to accommodate the region’s growth by 2025. For those of you unfamiliar with the details of Momentum, one of the driving factors behind many of the initiatives is the need for improved core capacity to boost Metro’s ability to carry more riders in the system’s core.

BART System
What you may not know is that Metro isn’t the only transit system experiencing a rail capacity crunch. In the San Francisco Bay Area, Bay Area Rapid Transit (BART) is tackling the issue. One of Metro’s sister systems, the 104-mile BART system is experiencing significant crowding near the core of the heavy rail system. The most congestion is experienced on the segment from downtown San Francisco stations (Montgomery Street and Embarcadero shown on the system map), through the Transbay Tube to West Oakland. It is along this segment where four different BART lines merge to provide service between San Francisco and the East Bay. By comparison, today no set of Metrorail tracks serve more than two lines, although that will change soon with the introduction of the new Silver Line.
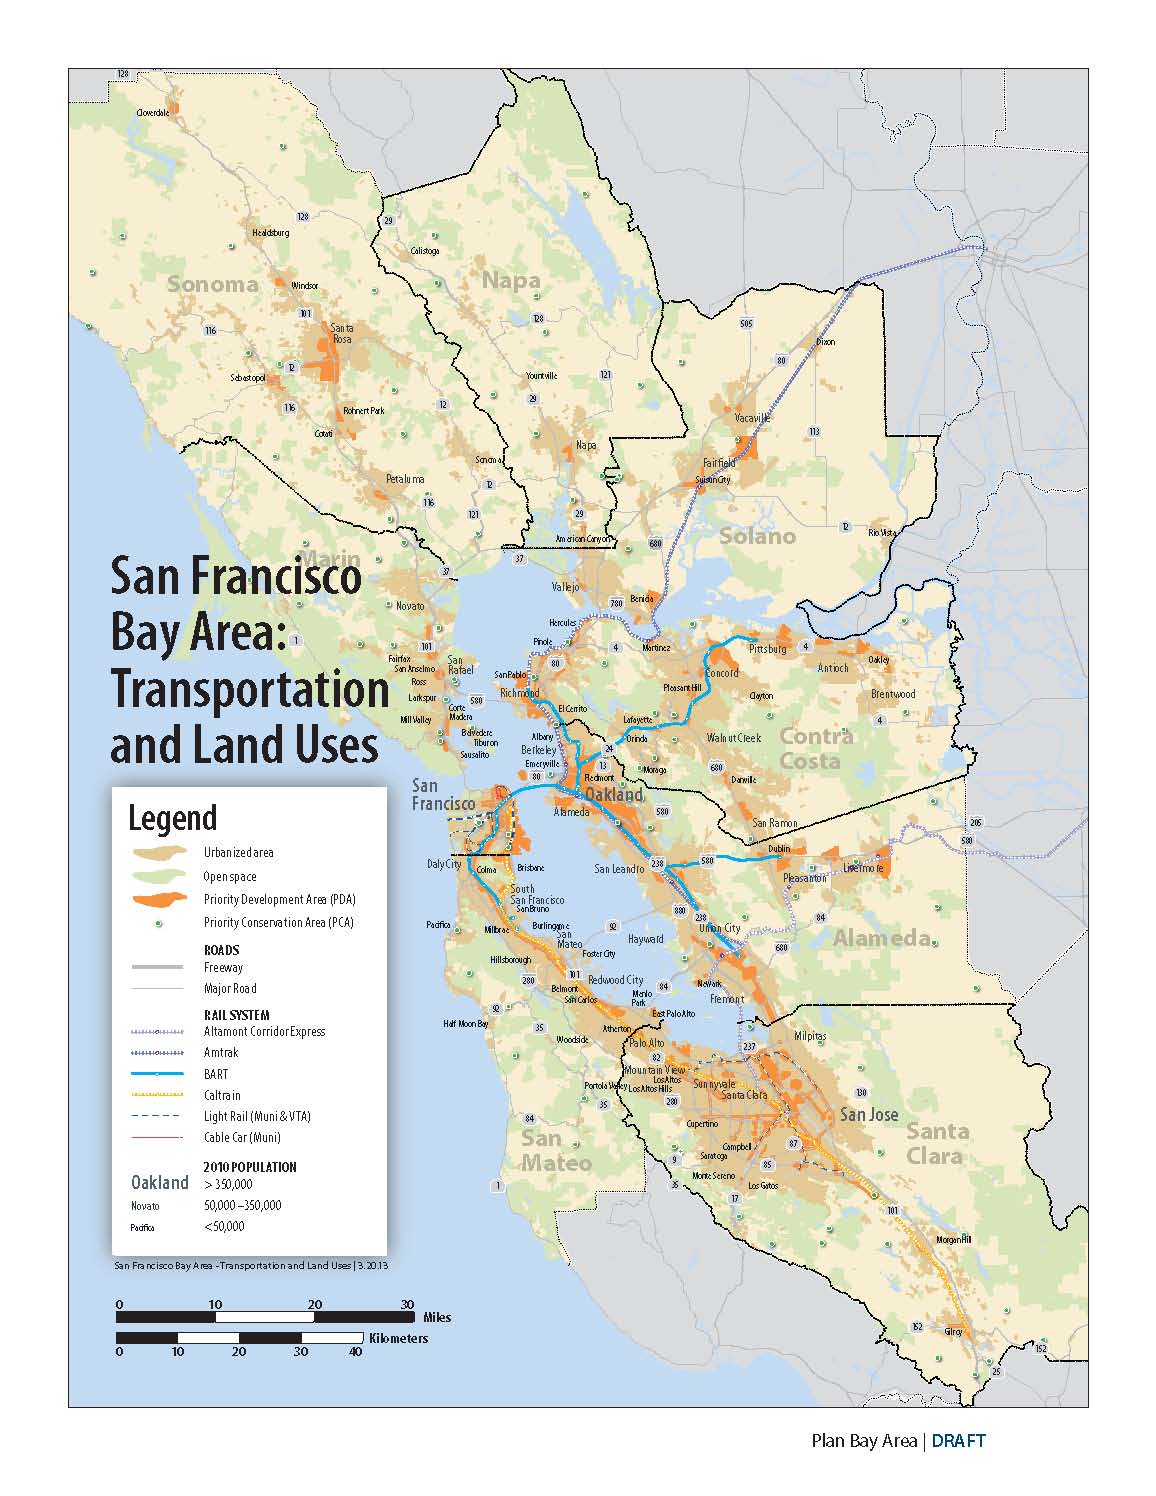
As in the DC area, the natural growth of the rail system and trends favoring more compact, urban development close to the inner San Francisco-Oakland area have contributed to increases in BART core ridership. But unlike the Washington area, the Bay Area must also specifically address the challenge of climate change as called for in California’s SB375 legislation. The 2008 law requires each of the state’s major regions to “prepare a sustainable communities strategy (SCS) that demonstrates how the region will meet its greenhouse gas reduction target through integrated land use, housing and transportation planning.” The response to SB375, Plan Bay Area (now in draft form), calls for the region to focus much of its future growth into existing urban areas (areas shaded in orange in the above map) well served by the region’s existing transportation system, including near current and planned BART stations.
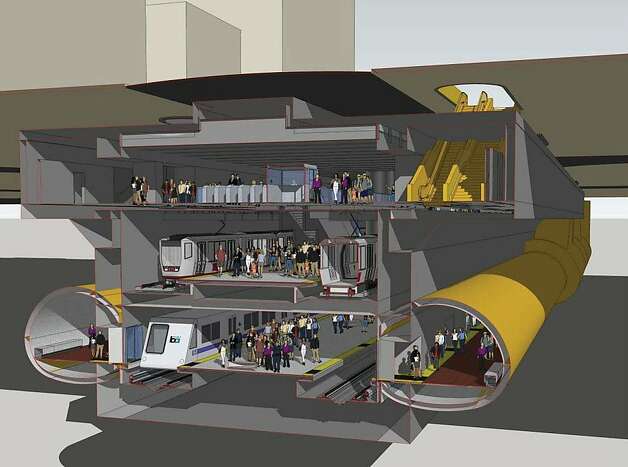
Rendering of proposed expansion of the BART Embarcadero Station
Though it is designed to support a healthier more sustainable region, Plan Bay Area will turn up the pressure on BART to handle even more riders in the San Francisco-Oakland core. And with more development of all types built around the stations, ridership is expected to increase not only during rush hour, but also in the mid-day, evenings, and on weekends, supporting more spontaneous travel for a variety of trips. In addition to upgrading station capacity, BART is investigating potential improvements through their BART Metro (PDF) study. The BART Metro initiative includes some familiar projects, such as:
- Fleet expansion, traction power upgrades and rail yard expansion to allow operation of more 10-car trains to alleviate train crowding
- Expansion of core system stations such as Montgomery and Embarcadero to reduce crowding (depicted above)
- An upgrade of BART’s automatic train control system to boost throughput from the current 23 to a potential maximum of 27 trains per hour
- Building additional track infrastructure, such as pocket tracks and crossovers, to allow BART more flexibility to better match ridership demand with service supplied
Like BART, Metro is studying ways to address many of these same rail capacity and operational challenges through various elements of Momentum, now being evaluated by the Board of Directors. Continue to follow Momentum’s next steps through this blog and Metro’s homepage.
| Quick Facts | |||
| Transit Agency | WMATA | BART | |
| Service Area (UZA Sq Miles) | 1,322 | 524 (SF/Oak only) |
|
| Region’s Population (2010 Census UZA) | 4,586,770 | 3,281,212 | |
| Annual Ridership (Unlinked Passenger Trips in 000’s) | Rail* | 287,304.3 | 108,298 |
| Bus* | 128,443.9 | n/a | |
| Paratransit* | 2,121.8 | n/a | |
| Fleet Available for Maximum Service | Rail* | 1,106 | 668 |
| Bus* | 1,495 | n/a | |
| Paratransit* | 740 | n/a | |
| Operating Budget ($m)** | $1,580.5 | $672.9 | |
| Capital Budget ($m)** | $848.7 | $869.2 | |
| Full Time Employees** | 12,332 | 3,352.5 | |
| *Data from APTA 2012 Public Transportation Fact Book | |||
| ** Data from most recent agency budget online | |||

While we’re working on a new map, why don’t we look at something like BART’s above? It is not pretty, I’ll admit that, but it easily shows multiple color lines and leaves plenty of room for signaling nearby amenities, attractions, etc. The markers for stations and transfer stations also are smaller and thus do not contribute to as much clutter as we have on our map.
I agree that BART’s map works well for them. One difference between the DC system and the Bay system that might make those suggestions more difficult or impossible is merely the number of stations: BART has 44, Metrorail has 86. That’s a lot more information on one map. @JDC