
Buses and Trains and Vans, Oh My! – How Metro’s Operating Budget Pays for Service
Ever wondered how much service your transit fares pay for, or how your tax dollars are spent? Read all about the intricacies of Metro’s operating budget!
How to Get Involved
Do you want a say in Metro’s budget? A public comment period on the FY17 budget (both capital and operating) is now open, and it will end 9am on Monday, February 29th. Please submit your feedback the following ways:
- Take an online survey at wmata.com/budget.
- Email your written comments at writtentestimony@wmata.com.
- Attend a formal public hearing at Metro Headquarters, 600 5th St NW, Washington DC, on Monday, February 22. An Open House will begin at 6 p.m. and the Public Hearing will begin at 6:30 p.m.
Additional communications and outreach efforts will continue over the next few weeks, including notification to local stakeholders and community based organizations; signs posted in Metrorail stations, Metrobuses, and MetroAccess vehicles; surveys sent to a statistical sample of registered SmarTrip® cardholders; ads in local English and non-English publications; and other media efforts including advisories, press releases and social media. The online survey and legal notice will also be available in seven languages.
Staff will summarize and present community feedback to the Board in March, and the Board will use that feedback as a vital input in budget negotiations before adopting a final budget in April.
So be on the lookout for opportunities to learn more about next year’s budgets and to have your voice and ideas heard!
Operating Budget Basics
This is the last of three related posts that attempt to simplify the complex world of transit system funding, and to give Metro’s riders and regional residents some tools to engage in budget discussions. The first post focused on the Capital Funding Agreement (CFA, PDF) and the Capital Improvement Program (CIP, PDF), which together establish a six-year framework for funding projects that improve the Metro System’s safety, reliability, and performance. The second post focused on the annual capital budget, and this post discusses the annual operating budget.
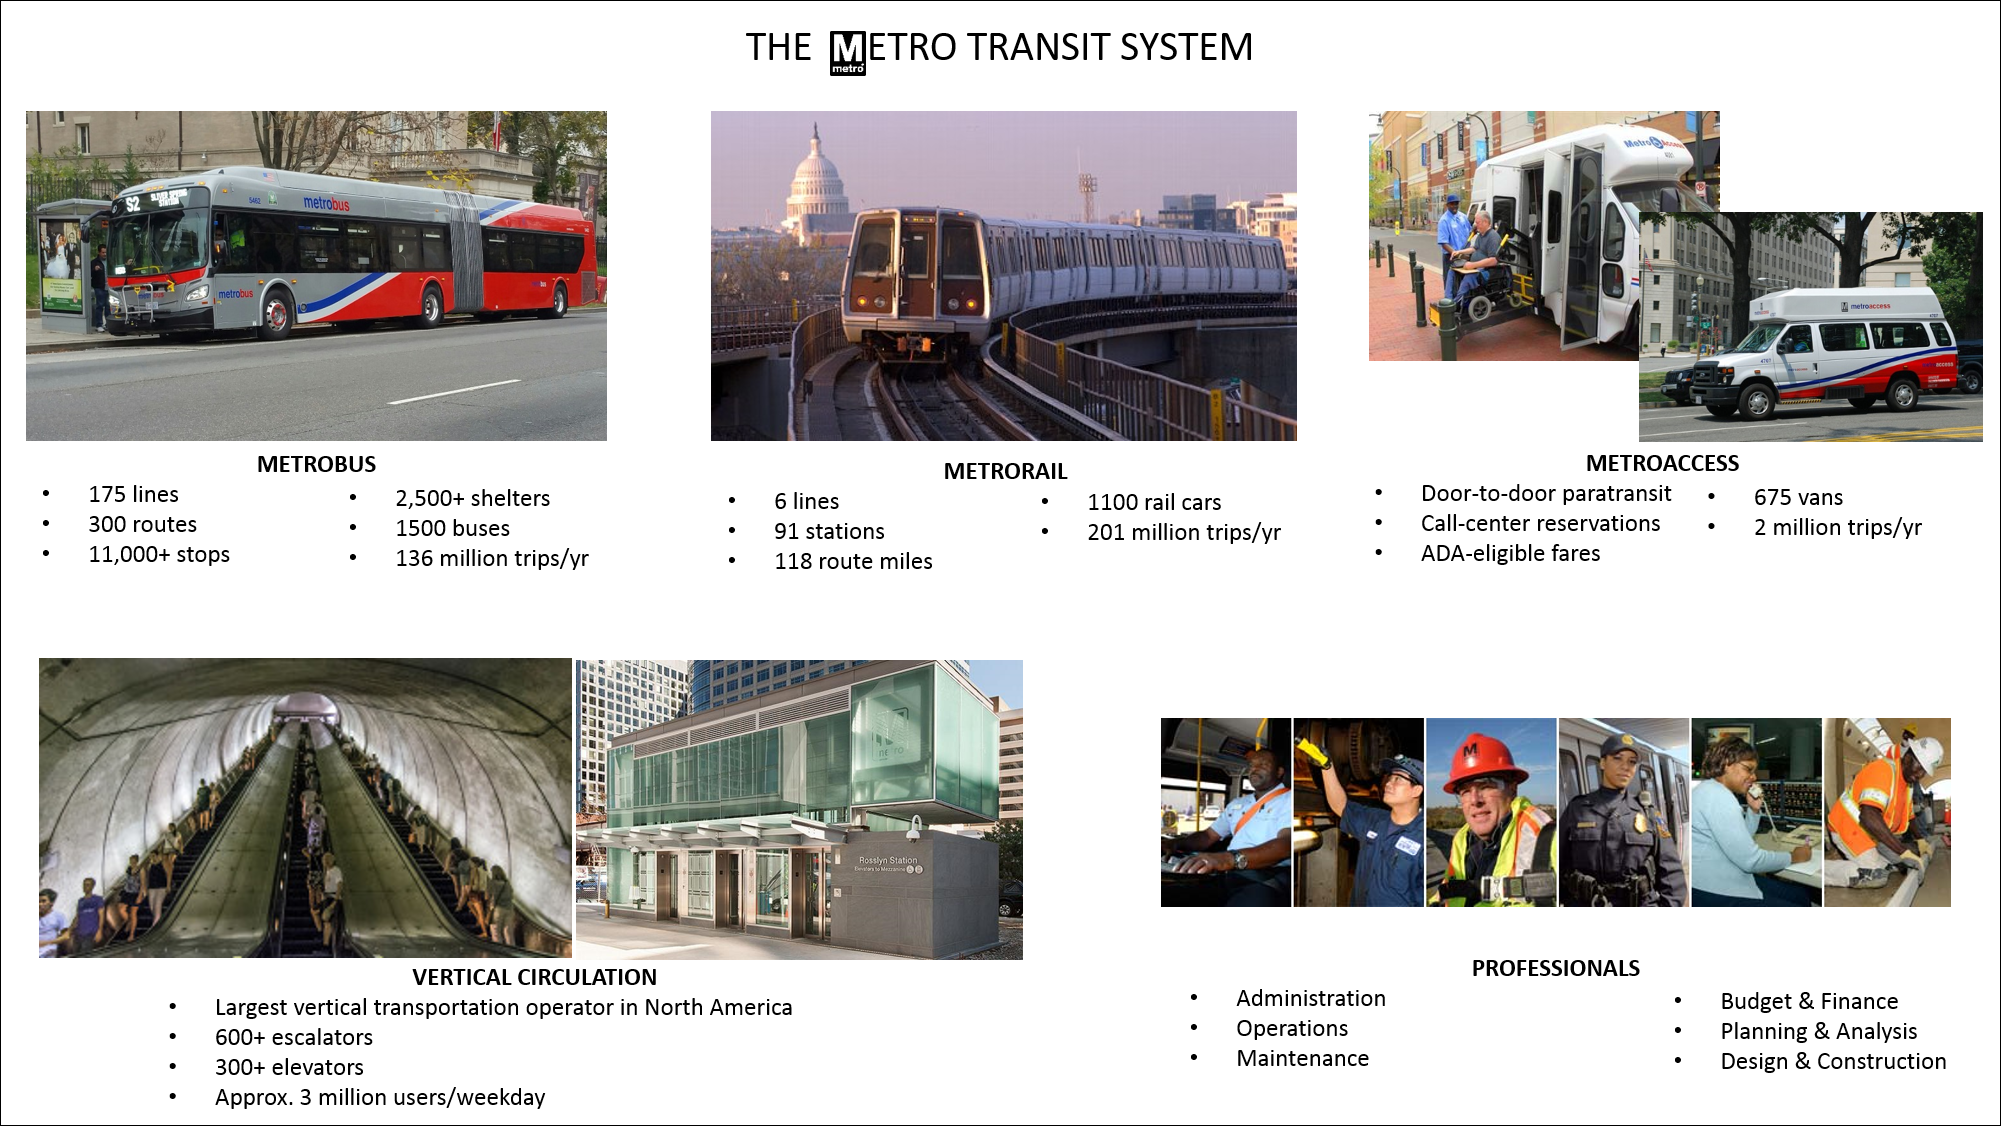
If you walk away from this post with nothing else, the graphic below summarizes the most important points about Metro’s operating costs and who ends up paying the bills:
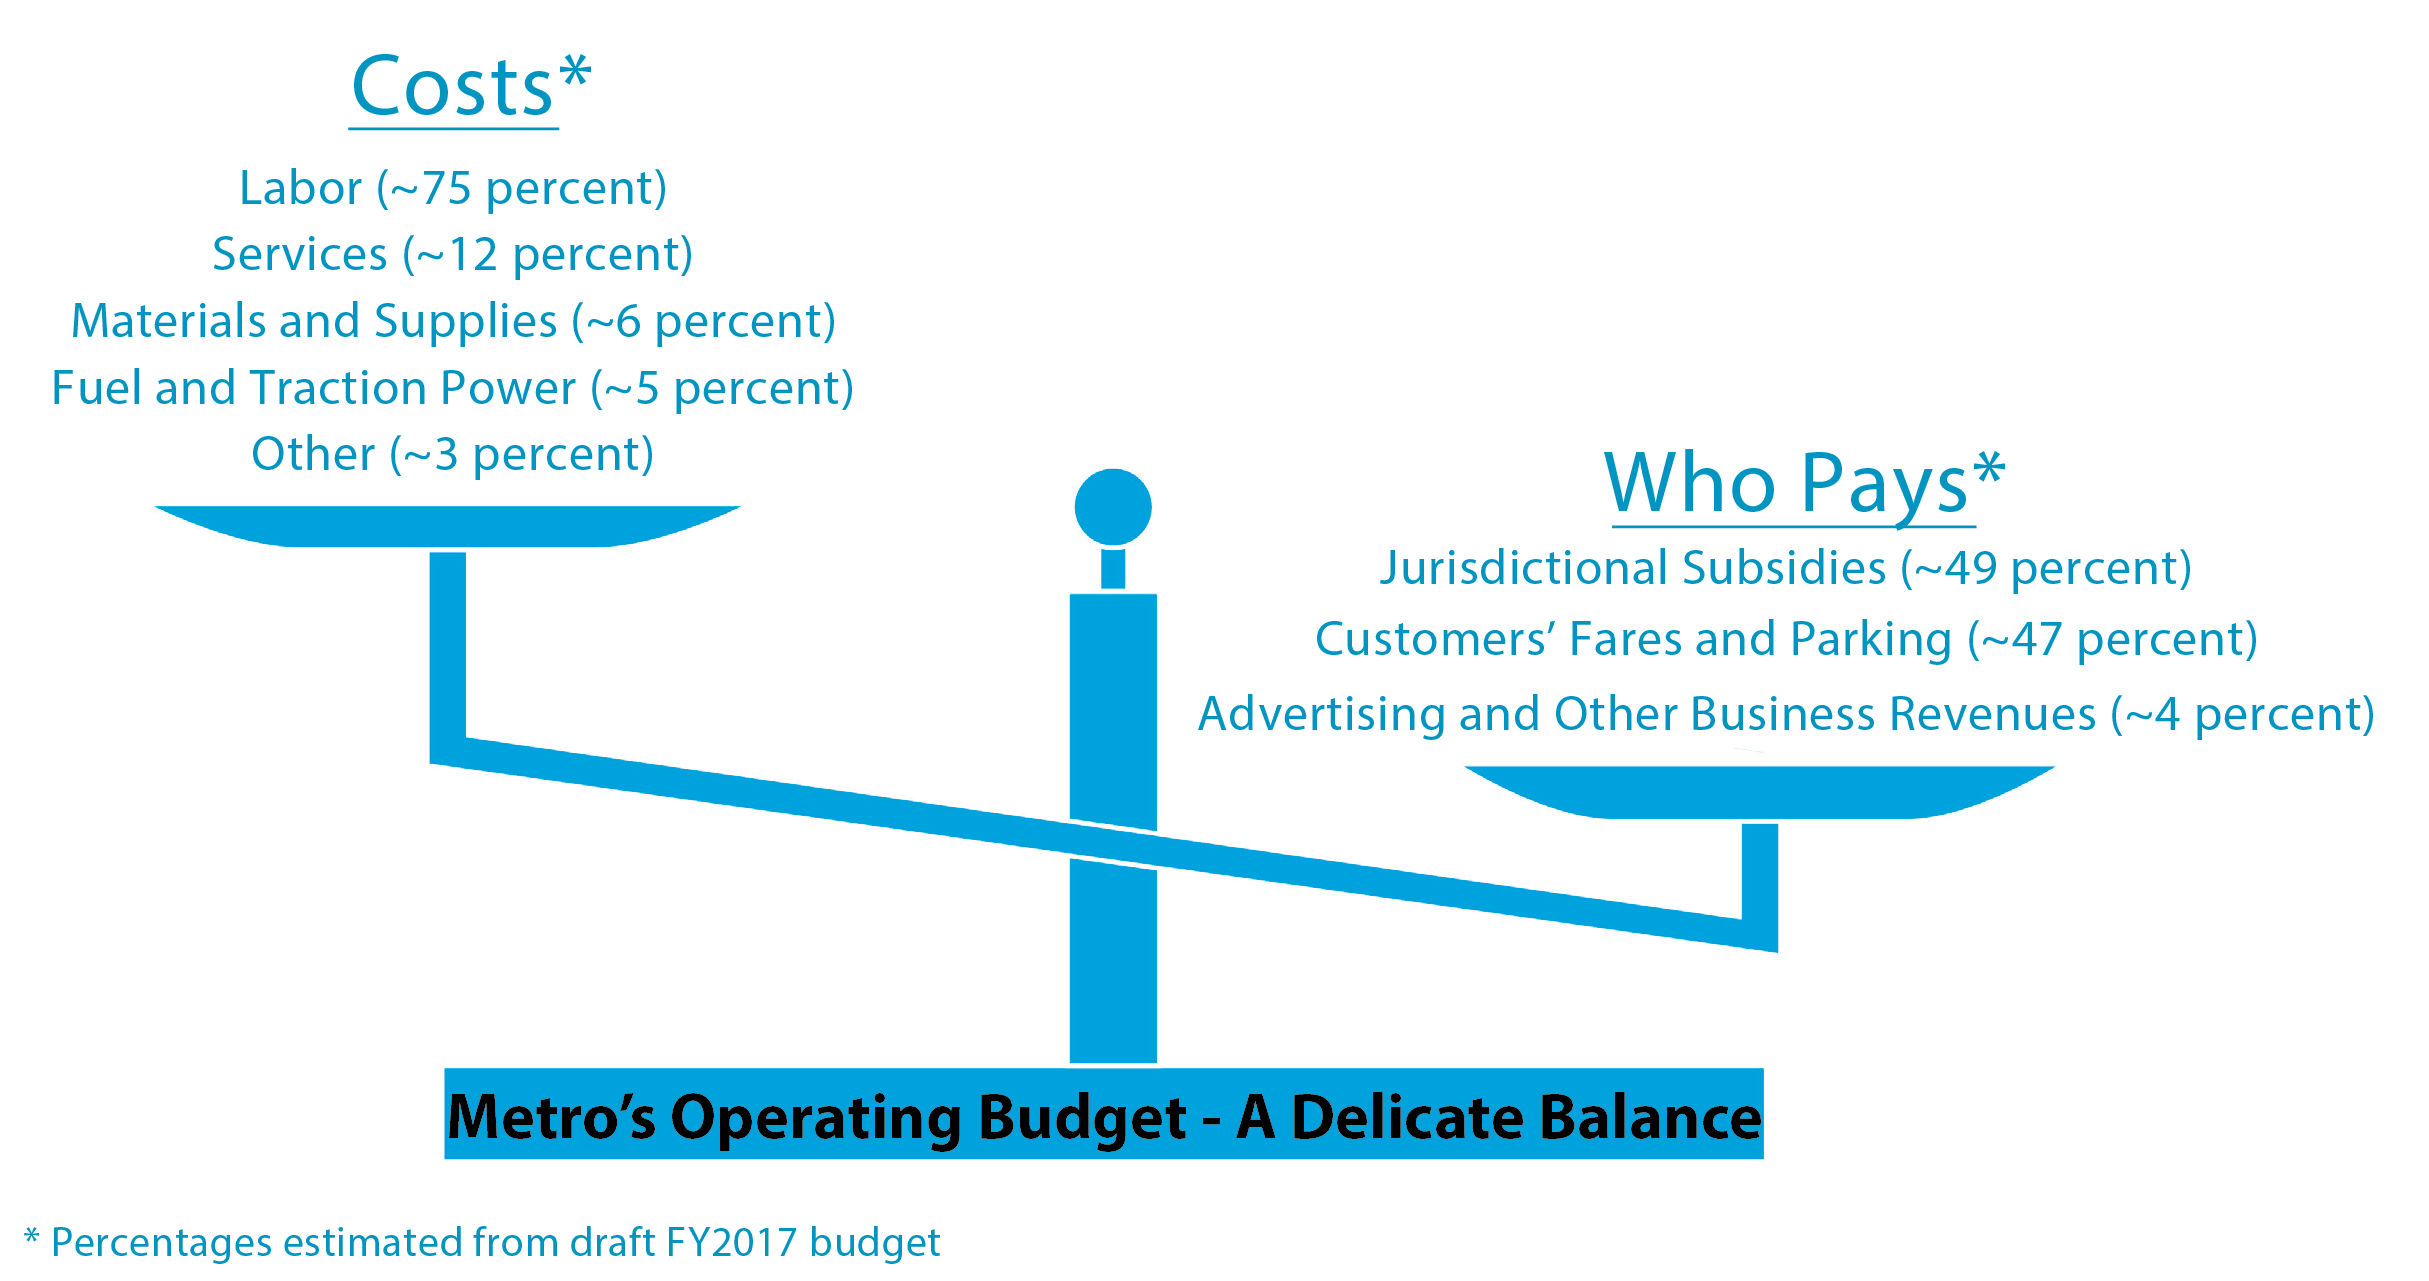
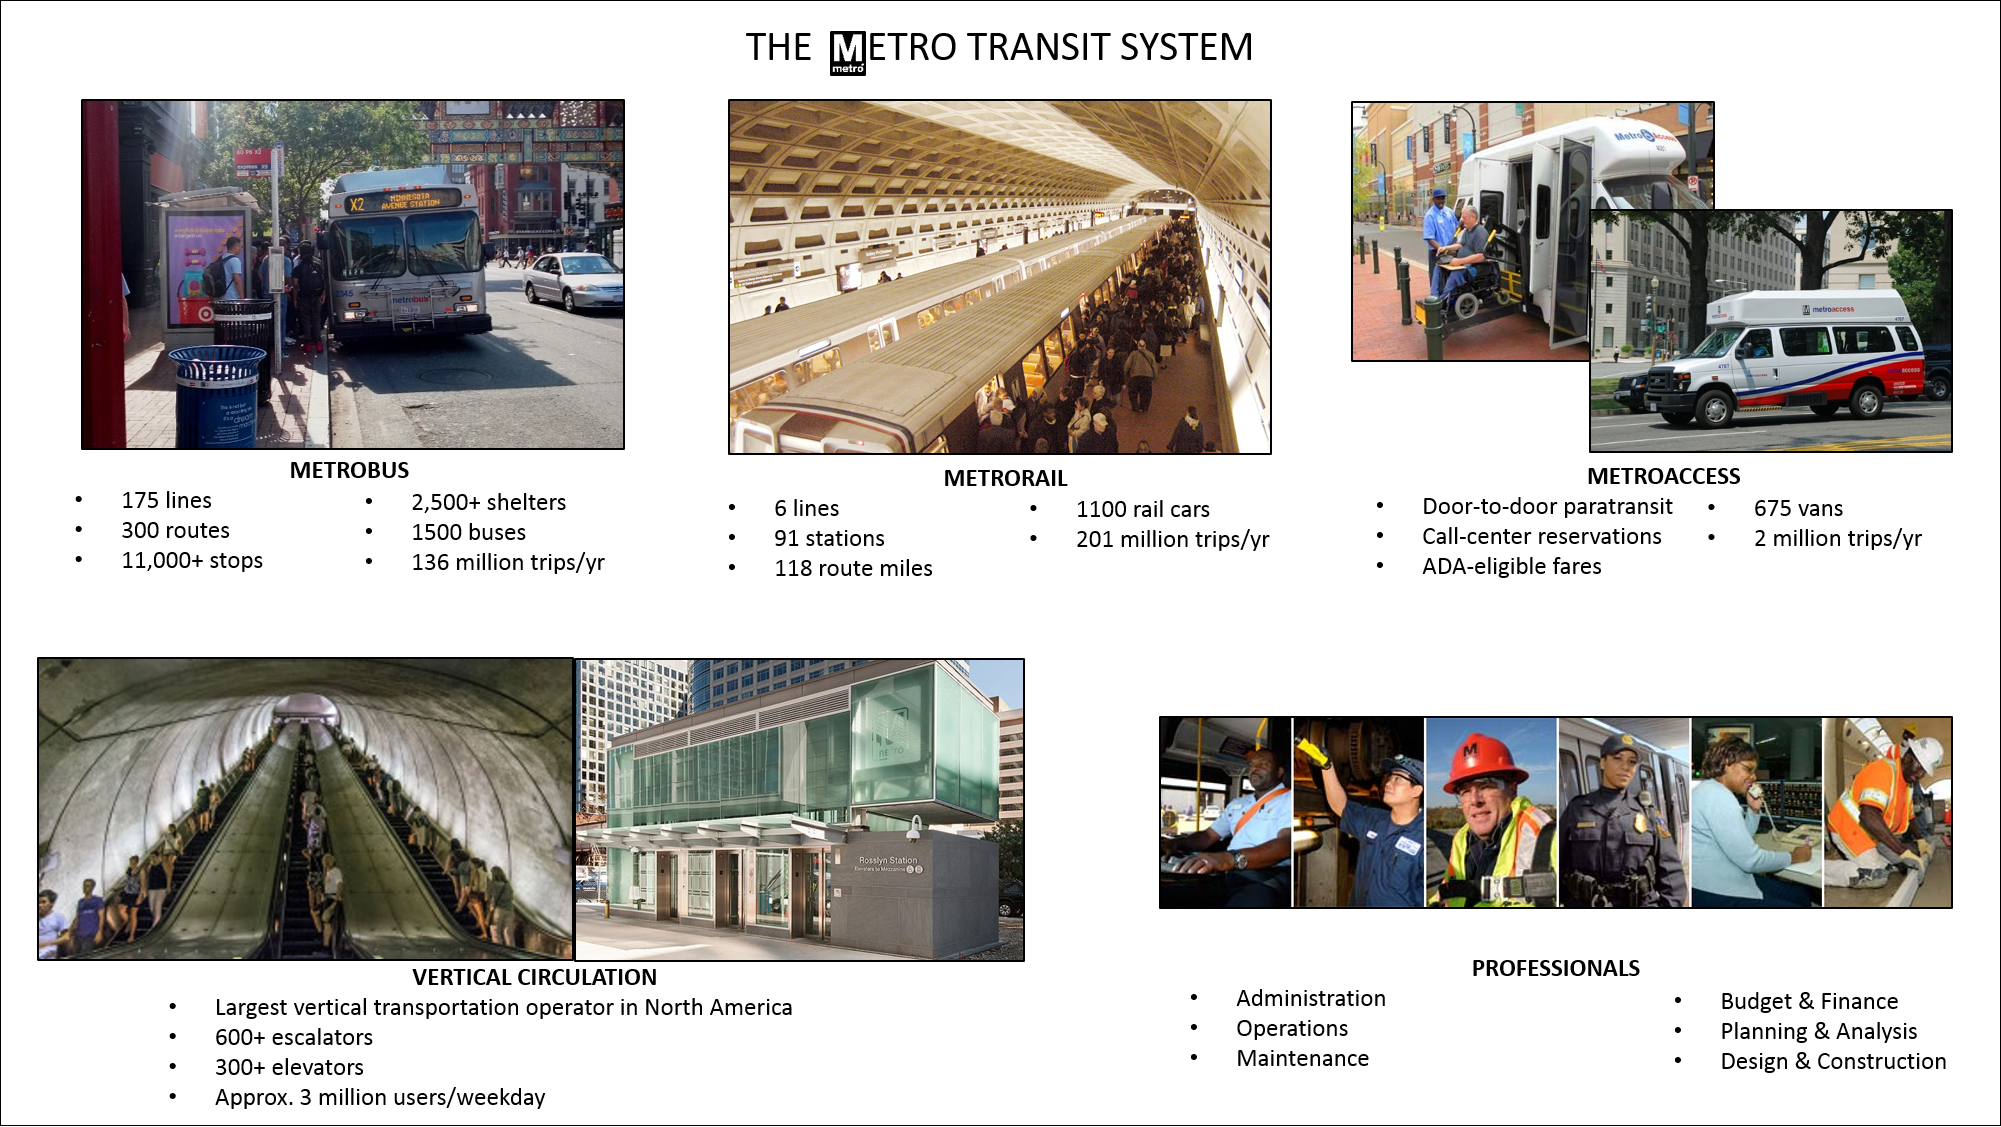
The capital budget pays for projects where Metro is building something or buying equipment: purchasing new buses and rail cars, building a new station entrance, improving a bus stop, or buying new parts for escalators. The operating budget pays the costs (salaries, fuel, utilities) of running the system on a daily basis, including all the customer services highlighted in the graphic below:
Metro’s costs of doing business have been rising steadily every year, but unfortunately Metro’s revenues have either grown at a slower pace or been flat. This dynamic tension has created an intense need to fill the gap between costs and revenues, but that need runs up against an opposing pressure not to reduce service levels, increase fares, or impose higher costs on the counties and cities Metro serves (the Compact jurisdictions). Metro staff have developed a draft FY17 budget that appears to balance these conflicting forces, and we are currently running a public engagement process to gather feedback on that recommended budget.
FY17 Operating Budget Summary
The most important thing to know for this budget cycle is that, despite falling ridership and revenue, the current draft budget includes no fare increase, no service reductions, and no increase to the jurisdictional subsidy.
To pay the bills, the operating budget has to match revenues and other funding sources to the costs of things like salaries for bus and rail operators, maintenance workers, and administrative staff; the electricity to run trains (traction power); fuel for buses and vans; maintenance for all vehicles, tracks, stations, escalators and elevators; utilities; and healthcare and retirement benefits. All those costs for FY 2017 are projected to total $1.75 billion. That amount will support projects, policies, and service strategies that focus on several broad goals:
- Funding critical safety and security investments
- Improving service reliability
- Regaining customers’ trust and boosting ridership
- Reducing costs and improving efficiency
- Maintaining current fares, service levels, and jurisdictional subsidies
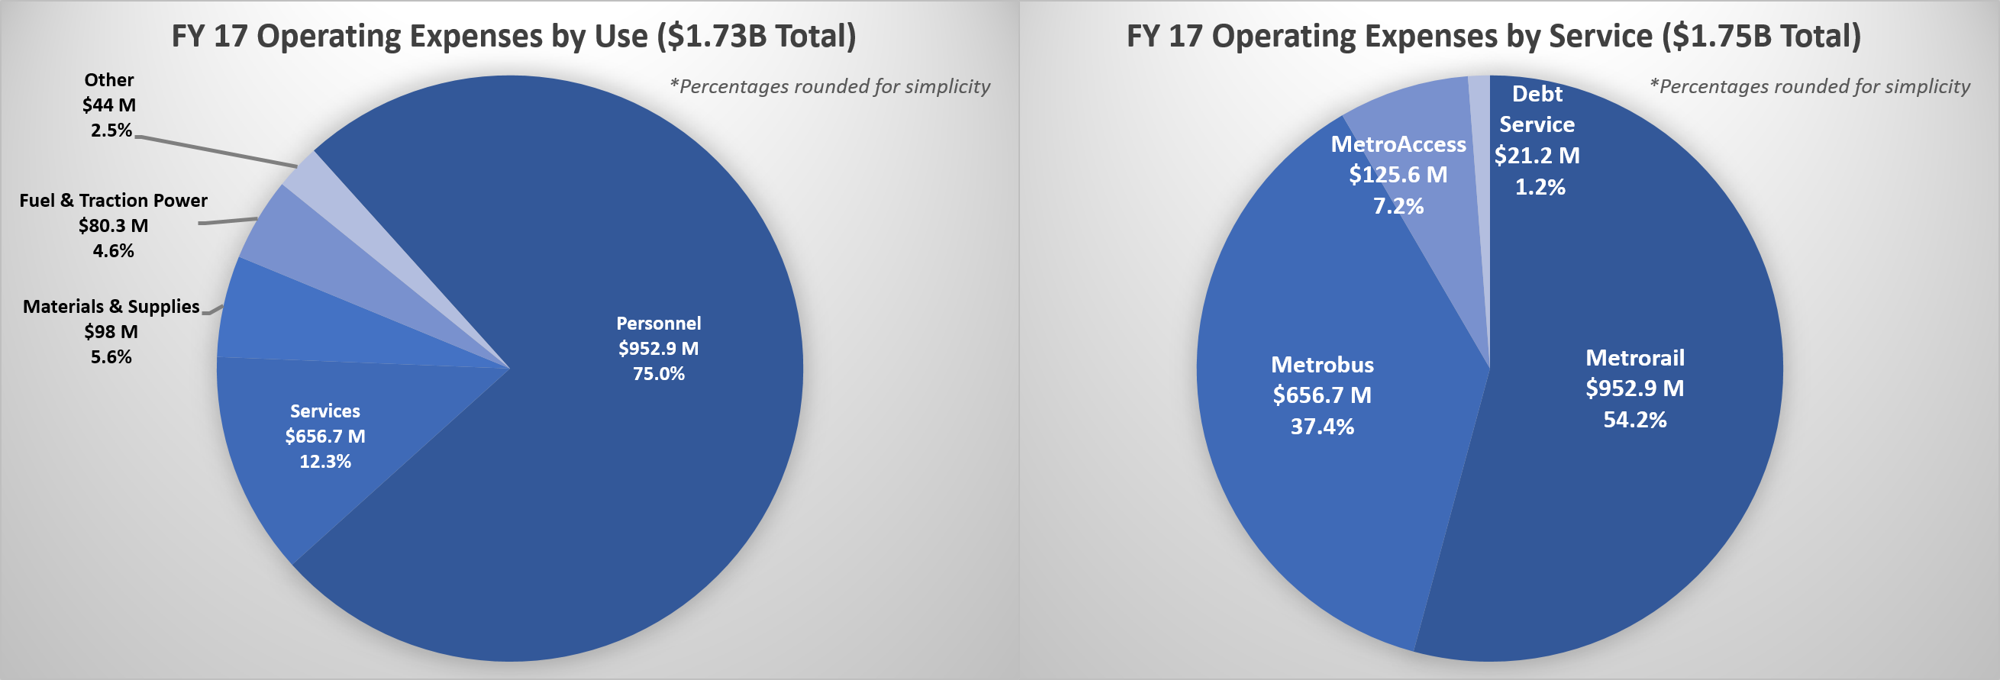
So what’s actually in the proposed operating budget? How much will Metro, its customers, and the Compact jurisdictions pay to keep the system running? As you can see in the charts below, the costs of operating the Metrorail system are just over half of the entire operating budget. At a systemwide level, personnel is the largest cost category at 75% of the projected budget, which includes all the people who plan, operate, maintain, and repair Metro’s trains, buses, vans, stations, and bus stops. The second largest cost category is associated services, which includes actual delivery of the MetroAccess paratransit service, followed by parts, supplies, fuel, and rail traction power.
One new operating expense for FY17 would be hiring 62 additional staff to meet new safety mandates from the Federal Transit Administration (FTA). These new positions would be in three broad job categories: rail training and recertification, rail maintenance, and bus operational testing and safety compliance. The budget also includes additional resources for the Metro Transit Police Department (MTPD) to deploy concentrated safety and fare evasion sweeps on both Metrorail and Metrobus.
However, even with those additional staff resources, total expenses of the recommended budget are $79 million less than last year’s approved budget, a decrease of 4.3%. These cost savings are due to $22 million in staff and administrative expense reductions, as well as the shifting of some preventative maintenance costs from the operating to the capital budget, which allows those expenses to be funded by FTA grants.
The draft budget also includes several initiatives to improve the customer experience and begin rebuilding trust in the Metro brand. Metro has been tracking substantial losses in ridership on Metrorail for the past half-year. That reduced demand has many related causes – years of lowered commuter tax benefits for transit riders (recently restored), fare increases passed in FY15, the expansion of alternative options for shorter trips such as bike-share and ride-hailing, and safety and reliability concerns. Metro is working with the FTA and its Compact partners to improve safety and reliability on several fronts (such as replacing old rail cars with the new 7000-series and reworking its track problem identification processes), but the Board also wants to pursue initiatives that might induce those people to come back to the Metro system and even attract new riders. Options recommended for further exploration in FY17 include:

Metro will also explore options for improving the Metrobus customer experience by greatly reducing boarding and travel times. A central strategy for that effort would be moving cash transactions from the farebox to either SmarTrip® kiosks at bus stops or vending machines at retailers, such as CVS and Giant Foods. Metro staff is still assessing options for off-board fare payment and analyzing costs and benefits, and will provide regular updates to the Board and the public.
So how does Metro actually pay for these services? How does Metro estimate how much revenue will be generated by fares and fees, and whether those revenues will cover expenses? The budget creation process begins in September of each year, with staff from Metro, Compact jurisdictions, and the FTA working together to forecast population growth, job growth, transit ridership, and fare and parking revenues. Staff then use those projections to determine what percentage of the operating costs are likely to be covered by revenues. Downward trends in ridership were factored into the FY17 projections, which are summarized in the table below:
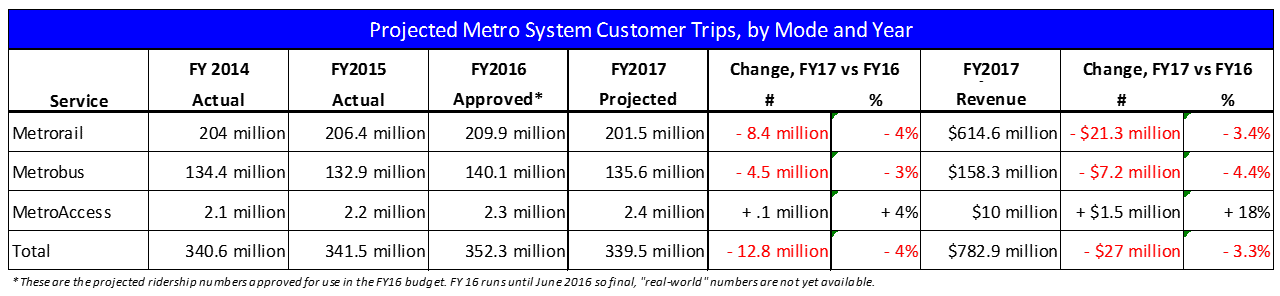
As you can see in the table above, Metro expects to generate $782.9 million in passenger revenue from all three services in FY17, even after factoring in lower ridership. That fare revenue will be combined with $46.1 million in parking fees, for a total of $829 million in passenger fares and parking fees. That’s a lot of money, but it’s around $30 million less than budgeted for FY16 (remember we’re still in FY16, so final ridership and revenue figures aren’t available yet). Other projected revenues include $47 million from advertising, fiber optic cable leases, and joint development, as well as $14 million in a range of miscellaneous revenues. Anticipated revenue sources are summarized in the chart below:

It’s important to note how much of the operating cost for each service is actually covered by the fares customers pay. Based on the costs and revenues projected for FY17, “farebox recovery” (the percentage of costs covered by fares) will be 74% for Metrorail, 27% for Metrobus, 8% for MetroAccess, and an overall average of 51% for the entire system.
Metro has a standing policy to direct customer fares and parking fees back into the transit services our customers use. But because Metro does not have its own dedicated funding source, any operating costs not covered by fares and fees must be covered by the Compact jurisdictions; that amount is labeled “Jurisdictional Subsidies” in the chart above. These costs are billed to the jurisdictions according to an Allocation Formula established by the Compact (PDF) and Capital Funding Agreement (PDF), and are paid for by a range of local taxes. The Allocation Formula, which is outlined in the graphic below, takes the operating costs for each mode and subtracts the revenues associated with each, resulting in net operating cost (costs minus revenues). The formula then distributes that net operating cost among the Compact jurisdictions according to different subformulas for each mode.
The table below summarizes the results of the Allocation Formula as applied to the FY17 cost and revenue assumptions:
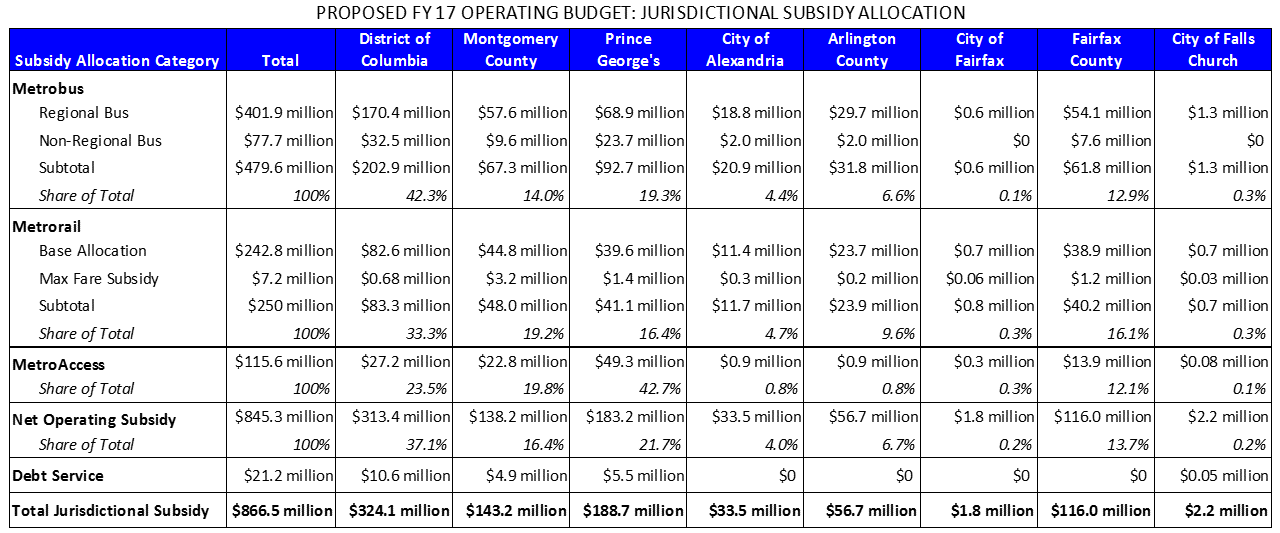
Keep in mind, all of this is just what Metro’s staff and General Manager are proposing. It still needs to be reviewed and commented on by you, Metro’s customers and Compact residents, and approved by Metro’s Board of Directors. The Board seeks to approve a final version of the CIP and annual budget in April every year. It must be adopted by June in order to be ready for the start of Fiscal Year 2017 on July 1st, 2016.

Recent Comments