
Right Underneath our Feet – How Planning, Zoning, and Development Influence Metrorail Ridership
Metrorail ridership is heavily-determined by station-area land use patterns, so attention to land use as a transportation strategy will be important to sustaining Metrorail’s long-term ridership growth.
There has been a tremendous amount of attention recently paid to Metrorail’s ridership trends. While history tells us that the current ridership snapshot – which shows that ridership has essentially flatlined – is quite normal given the cyclic nature of ridership growth, Metro’s Office of Planning has been exploring why certain station areas and rail segments have seen ridership gains during the downturn, while other station areas and segments have seen losses.
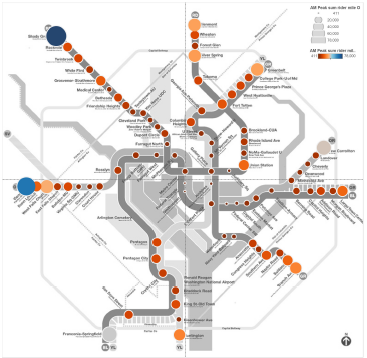
Passenger Miles Traveled by Trip Origin at Each Metrorail Station, AM Pea, Full-Fare Riders with no Transit Benefits. One of the inputs from this study.
The questions we sought answers to included, for instance:
- Why is it that while system-wide ridership declined last year, we saw ridership gains at stations with lots of transit-oriented development, such as NoMA, Columbia Heights, and Navy Yard-Ballpark?
- How much of an impact does transit-oriented development have on overall ridership, and can that impact be measured, both in terms of new ridership as well as in terms of net new farebox revenue?
- With so many ways to get around – including walking and biking and Uber and Lyft – and gas prices at near historic lows, how does a Metorail trip compare to other ways of getting around in terms of overall competitiveness?
- Does the location of a transit oriented development project matter in terms of how much ridership it generates? Does that vary by the type of project (i.e. office, retail, residential, etc)
We pored through hundreds of millions of transactions and enlisted the statistical help of the University of Maryland’s Center for Smart Growth to find out. The findings from their exhaustive statistical analysis revealed that in fact there are science-based answers to our questions above, and that the impact that local land use decisions have on Metorail ridership are quite profound.
The full report is available online (PDF, 9M), but the quick summary of the report tells us that:
- The location of jobs and households in the region fundamentally shapes the demand for ridership on the Metrorail system
- Ridership is strongly shaped by the spatial distribution of jobs and households and by the cost of alternative modes of travel
- Short trips are likely have more viable substitutes: walking, biking, Uber, taxi, or a bus when in the city center. In contrast, it is more difficult to find alternative modes of travel that are efficient and affordable for long-distance trips. It is likely that the high cost of parking in the city center plus traffic congestion on freeways and major arterials combine to make it difficult for people to switch from Metrorail to a private car
- Estimates of fare elasticity — customers’ sensitivity to the price of transit trips — vary little between peak and off peak periods, but some nuances afford pointing out. In particular:
- Like others, our estimates of fare elasticity vary by distance traveled: elasticities are high for short distance trips (-1.02), mid-range for middle distance trips (-0.36), and low for long distances (-0.12)
- Riders with subsidized fares (senior and disabled riders) or transit benefits have higher elasticities in all three time periods than full-fare riders without benefits
- Full-fare riders with a transfer on both ends of a Metrorail trip have lower elasticities, while travelers making no transfer or one transfer from rail to bus show elasticities higher in all three time periods
- Riders that travel long distances during peak periods have “inelastic” demands. Therefore, potential increases in fares will more than offset the decrease in trips – a finding which has been consistent with prior years fare actions
- As long as households remain located in the suburbs, jobs remain concentrated in the central city, traffic congestion slows travel speeds by car, and parking remains scarce in the central city, the demand for long-distance ridership on the Metrorail system will remain strong and relatively insensitive to fares.
- Full-fare riders with a transfer on both ends of a Metrorail trip have lower elasticities, while travelers making no transfer or one transfer from rail to bus show elasticities higher in all three time periods.
- Trips not involving Metro 2025 stations are inelastic and trips with two Metro 2025 stations are elastic, while trips crossing a maximum load point generally have high elasticities. This means that passengers are more likely to avoid an overcrowded station, all things being equal.
What do you see in the report that surprises you? Confirms your suspicions? Are there ways that Metro can work better with partner jurisdictions to construct the types of land uses that put more riders on the system and help lower the operating subsidy?
Download: Origin-Destination Land Use Ridership Model for Fare Policy Analysis (PDF, 9MB)

The word elastic was used way too much lol.
Could you re-summarize using real phrases, like, “long-distance travelers are less sensitive to price increases because there are few alternatives, due to crowded roads and expensive parking”.
Could you partner with Uber/Bridj to look at their ride data for planning purposes? Or to confirm the elasticity of short routes? Although I guess their competitors so maybe not.
@Mike
lol indeed. It’s a technical and wonky report, and while I did my best to make this summary blog-post user friendly, clearly I have a ways to go!
@Mike
I sit on a TCRP panel and Uber was kind enough to let us peek into parts of their API. Not origin/destinations, so we can’t compare fares paid against distance, but for their API its based on surge pricing moreso than distance traveled.
Which raises an interesting topic. Uber’s biggest “surge” takes place late a night. It’s a total party animal, with its most significant surges between 10pm and 2am.
I don’t have more info on them to compare the surge against driver availability or trip distance requested, which would be cool. Can you track that down for us?