Posts Tagged ‘visualization’

Data Download: Metrorail Ridership by Origin and Destination

October 31st, 2012 25 comments

Photo courtesy Josh Bancroft (click for original context)

Every day, Metro gathers a vast amount of information on how customers use the system – where and when they pass through turnstiles and board buses, how they pay, and more. There’s much to be learned from this data, and many in the past have done so.  We’ve heard through MindMixer, Metro’s new online community engagement site, that more detailed ridership statistics would be useful.  So in the spirit of open data and collaboration, here’s a data download of rail station-to-station passenger counts, by time period, by day of the week, for May 2012.

May 2012 Metrorail OD Table by Time of Day and Day of Week (.xls, 6.8 MB)

This data can answer many questions, such as: Where do passengers entering at one station go? Where do late-night riders enter the system? How does Saturday ridership differ from Sunday? Which stations are most commuter-oriented, and which are most lively at midday and evening hours?

What does this data tell you? Do you see any patterns? Feel free to post a link in the comments!

What other data that would help answer additional questions?

Technical notes about this data:

  • The data show average ridership, averaged across all days in May 2012, excluding Memorial Day. (We typically use May as an “average” month, since it falls in the middle of seasonal swings, is relatively unaffected by extreme weather, etc.)
  • Time period shows the time the passenger entered (not the time they exited).
  • AM Peak = opening to 9:30am
  • Midday = 9:30am to 3:00pm
  • PM Peak = 3:00pm to 7:00pm
  • Evening = 7:00pm to midnight
  • Late-Night Peak = Friday and Saturday nights only, midnight to closing

What Happens to Metrorail Ridership on Holidays?

October 25th, 2012 3 comments

About ten days a year, Metrorail operates on a holiday schedule. On some holidays, most commuters have the day off, like Christmas, Labor Day, or Independence Day. But other days can be holidays for some, but not others – like Columbus Day, Veterans Day, or Martin Luther King, Jr. Birthday – and these often fall on a Monday or Friday to make a long weekend.  Federal workers, whom we estimate at over a third of peak ridership, usually get these days off, as do others.  Metro often uses some holidays to do trackwork. So what happens to rail ridership on holidays?

To answer this question, this post examines total ridership on holidays over the past few years, by holiday, and by time of day. I excluded Christmas, New Year’s Day, and Independence Day, since these holidays are strongly influenced by how they fall in the calendar, and by the events on the National Mall on Independence Day.

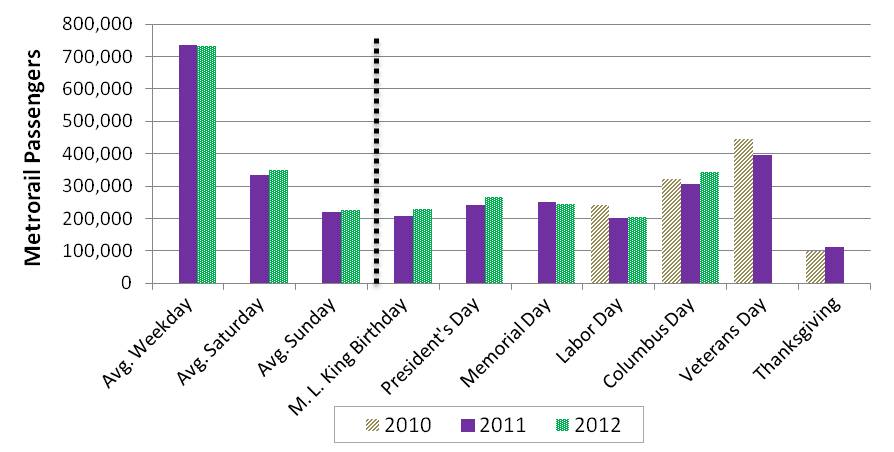
Here’s a look at ridership on the remaining 7 holiday weekdays.  For the sake of comparison, I also show an average weekday, Saturday, and Sunday for May 2012.

Historical Metrorail ridership on holidays, compared to average May weekday, Saturday, and Sunday

So, all holidays shown have much lower ridership than a typical weekday, and are more in the range of a Saturday or Sunday. A typical weekday on Metrorail shows around 730,000 riders per day, with Saturdays about half that, and Sundays around a third of a weekday.  The holidays shown above are in the range of  200,000 to 400,000 riders per day.

Read more…

Categories: Engage Tags: , , ,

DC’s H and I Streets NW Bus Lane Study

August 3rd, 2012 5 comments

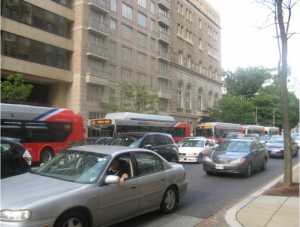
Metrobuses in congested traffic on Eye Street NW during the PM Peak

The Washington, D.C. region continuously ranks as one of the most congested metropolitan areas in the nation.  Metrobus plays an important role in connecting residents to activity centers and alleviating traffic on arterials.  However since Metrobus vehicles operate within mixed traffic, Metrobus service experiences delays and reduced travel speed on a daily basis.

To improve the effectiveness and reliability of bus service, WMATA and DDOT recently initiated an operational analysis to explore bus-only lanes along  H and I Streets NW, one of the busiest bus corridors in downtown Washington, DC.  The study team recently completed the existing corridor conditions assessment and applied VisSim, a multi-modal traffic simulation tool, to identify and quantify the congestion impacts on buses as well as other roadway users, including pedestrians, bicyclists and private vehicles.

Read more…