The Regional Transit System Plan (RTSP) is intended to update the currently adopted Transit System Expansion Plan (TSEP) that was completed in 1999. In its implementation, the RTSP looks beyond the planning horizon of the TSEP by an additional fifteen years and incorporates updated travel demand, population and employment forecasts for the region. The following discussion will look at how much ridership growth has occurred over the ten-year period between 1999 and 2009, and will look at changes in the regional growth projections out to 2040 that will shape future demand for transit services.
Changes in Ridership

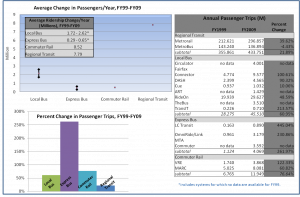
Figure 1. Change in ridership. Source: NTD
As envisioned in the adopted plan, transit ridership has grown since 1999, and is on the way toward the TSEP goal of doubling ridership by 2025. Annual transit passenger trips throughout the region have increased by about 30% in the first 10 years of the 25 year planning horizon. However, this growth in ridership has not been consistent across the region: close inspection of these data shows that ridership growth is happening at a faster rate on local feeder bus, express bus, and commuter rail services than for regional Metrorail and Metrobus services, although Metro accounts for the majority of the growth in absolute terms. The growth in ridership on local and commuter transit services highlights the need to create a transit plan that looks beyond the services provided only by Metro and to focus on the region at large.
Read more…
Metro is trying to triple the number of bicyclists accessing our transit services by 2020. Our Bicycle & Pedestrian Access Improvements Study showed that although bicycling represents a small portion of station access now, this mode has very strong potential for growth. For example, many of our parking customers live less than 3 miles from their rail station, and many parking facilities fill up between 7:45 and 8:30 am.

As part of this campaign, we are trying to learn more about the travel patterns of bicyclists so that we can better plan facilities and services for them. For example, how strong is the “seasonal” effect in biking? What time of day do cyclists ride? How does bicycling demand patterns compare to our rail and bus networks?
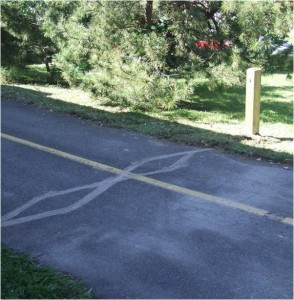
One source of data for these questions is the automatic bicycle counters that Arlington County has installed on the Custis Trail, a major trail for bicyclists between downtown, Arlington, and points west. This counter can sense the difference between a bicyclist and a pedestrian, and has been silently counting both since October 2009. The counter is located at the top of the hill between Rosslyn and Courthouse (map). Previous analyses of this data are available online.
While Custis Trail users certainly don’t necessarily represent current or potential bike-to-rail customers, they do provide some data-driven insight into the travel demand of bicyclists, whom we hope will be a key part to Metro’s long-term strategies for rail access. So, the rest of this post analyzes bicycle counts by 15-minute intervals between October 2009 and February 2011.
Read more…


Recent Comments