Better urban planning can help save our rivers and the Chesapeake Bay—by reducing this region’s future impervious surfaces by 20%. Here’s why.
As many Washingtonians know, the Chesapeake Bay needs help. Dead zones and algae blooms appear every summer which destroy aquatic life in the Bay and threaten fishing, swimming, and economic health. A major contributor to this problem is rainwater runoff from paved roads, parking lots, and roofs. These are called “impermeable surfaces”. In contrast, permeable (or pervious) surface is one through which liquids are able to pass.
Grassy fields, woodlands and farmlands are excellent examples of this: rainwater or snowmelt soaks into the ground, pollutants in the water are filtered naturally, and excess water travels underground to streams and eventually (in the Washington region) the Chesapeake Bay.Rainfall that falls on impervious surfaces like paved roads, parking lots and roofs “runs off” unfiltered making its way to the Chesapeake Bay—along with nitrogen and sulfur oxides from vehicle emissions, motor oil, and road salt residue.
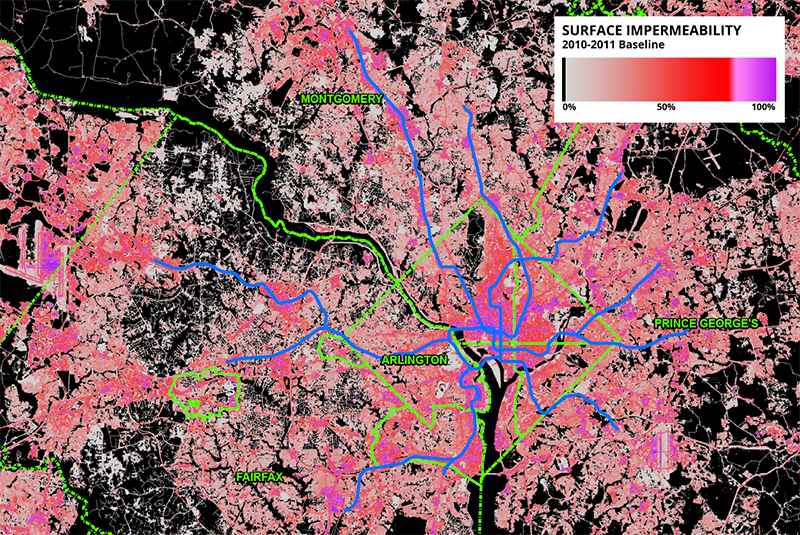
Figure 1 – Map of impermeability throughout the region with overlaid jurisdictional boundaries and Metrorail system for reference. Note the concentrations of highly-impermeable surfaces in central D.C., and at other activity centers like Dulles.
Read more…
Categories: Sustainability Tags: Chesapeake Bay, forecasts, landuse, open space, permeability, planning, stormwater, sustainability, transit, transit-oriented development, visualization, water and stormwater
Approximately 86% of the region’s new office construction is occurring within one-quarter mile of Metrorail stations, 93% within the half-mile walk sheds.
A Washington Post article from October 2013 made a staggering assertion: That 84% of new office construction in the region is occurring within one quarter mile of a Metrorail station, according to Jones Lang LaSalle and other data sources. As we continue to dig into walk sheds and the land-use/transportation connection, we thought we would revisit this assertion and update it for 2015.
Since the Post article was written, we have begun to plan for near-term capacity constraints that might result from increased ridership caused by new households and jobs near Metro. And part of this planning is gaining insight as to where and when new housing units and office space may come online through real estate industry data sources. Through this research, we are able to update the statistic above:
86% of new office construction in the Washington region is occurring within one-quarter mile of a Metrorail station.
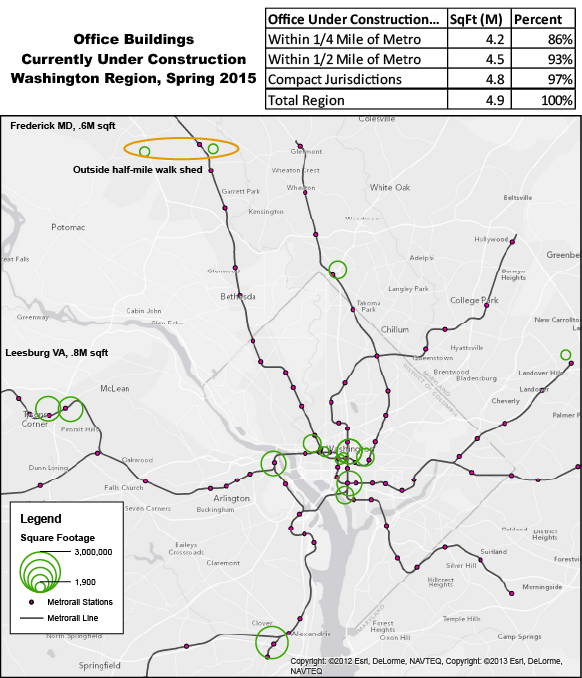
New office currently under construction in the Washington region. All but four projects are within a half-mile of Metrorail. Data from Jones, Lang, LaSalle.
Read more…
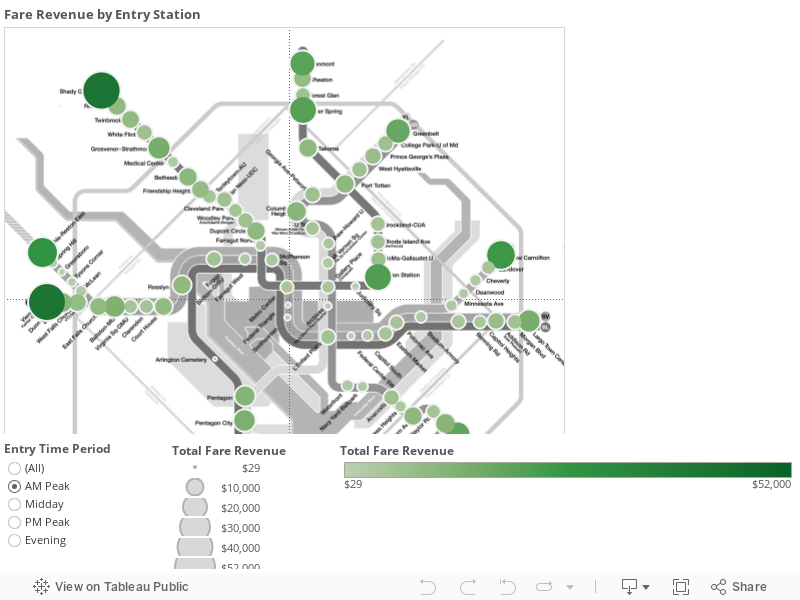
Where and when does Metrorail generate the most farebox revenue? So far the data reinforces the notion that ours is a truly regional system with strong revenue contributions from all jurisdictions – but of course, the story is far more complicated than that…
What kind of rail system is Metrorail? Urban subway? Commuter rail? Hybrid? The answer of course is all of the above. And if that is the case, what kind of ridership and revenue patterns should its stations and system exhibit? High levels of peak revenues with heavy commuter lot usage but relative inactivity during the day? Lower levels of peak period activity but a steady stream of usage throughout the day? Depending on your perspective (and travel patterns) one might argue for either, and it might seem easy to apply a blanket classification to Metrorail and declare that “only urban stations cover their cost” or “commuter stations contribute largely to Metrorail’s revenue picture.”
Well, when you throw the data up on a map, it becomes clear that there are no easy answers, and no one right way to view the revenue picture of our tri-jurisdictional hybrid rail network. Some conclusions from the data are intuitive, some less so. Among them:
- Differences in ridership across stations are bigger than differences in revenue, so ridership is a stronger explanation of differences in revenue than fares. For example, Shady Grove’s average fare in the AM Peak is $5, which is twice as much as the smallest average fare. On the other hand, ridership at Shady Grove is ten times higher than other stations, so the ridership better explains the station’s revenue.
- In the AM Peak, the terminal stations dominate in terms of revenue contribution. Union Station functions as an internal “terminal station,” meaning that the commuter rail and Amtrak connections to Metro are extremely important to the overall ridership and revenue picture.
- Other stations with strong bus or commuter park-and-ride infrastructures also pop in the AM Peak, such as Silver Spring and Grosvenor.
- Note how well the non-Silver line stations in Virginia perform in the AM Peak, as well as the somewhat expected better performance of the Shady Grove branch of the Red Line in the AM Peak.
- In the PM Peak, the core is king. Stations like Farragut West and North, Metro Center, L’Enfant Plaza are producing $50,000 apiece every evening thanks to their job densities, reinforcing the importance of improving their capacity for the future in Metro 2025, as well as their huge importance to revenue today. By comparison, in the AM Peak, only Shady Grove and Vienna approach these levels of revenue at roughly $40,000 per station.
- The New Carrollton and Largo Town Center branches of the Blue/Orange/Silver Lines contribute significantly less revenue than other branches, and this directly relates to the relative lack of transit-oriented development along these spines. The station areas on these lines enjoy a superb level of rail connectivity to the region’s primary job cores, but without sound transit-oriented investments to-date, they have not yielded the type of ridership and revenue commensurate with the capital investment. Imagine what Metro’s revenues (and farebox recovery) could look like if these segments were properly developed!
We’ve been examining the data ourselves as we continue forward with Momentum’s call for us to ensure financial stability for the Authority and have created the visualization for you to play with. We’d love to know what you see!
In Part Two of this series, we forecast the impact of the region’s near-term development pipeline on Metrorail ridership, using the Land Use-Ridership model. The good news? Metrorail ridership is set to show big gains. The bad news? Your ride just got less roomy.
Just as we were putting the finishing touches on this post, we saw a flurry of news articles detailing the regional market forces that portend increased rail ridership. Millennials choosing not to drive, even as they grow up. Office parks in far-flung places experiencing devaluations while Metrorail-adjacent areas capturing the lion’s share of new leases. Marriott announcing that it will seek a transit-accessible location when it moves. And even defense contractors coming to bat to argue for the economic benefits of the Purple Line. All of this free publicity set us up nicely for what we wanted to share with you – the first results of the Office of Planning’s Land Use-Ridership model as applied to near-term development projects.
The Near-Term Pipeline. Researchers at Jones Lang LaSalle have been compiling a list of actual development projects – under construction, or planned – near Metrorail stations, so that we can forecast the near-term capital needs for the system. A huge amount of development (over 105 million square feet!) is on the books for within a half-mile of a Metrorail station.
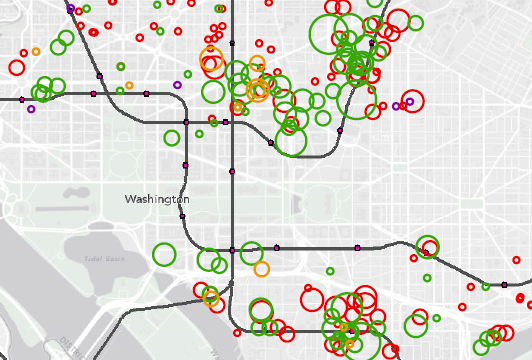
Map of near-term development projects near Metrorail, by building type (click for full image)
So, How Much Ridership? What impact will all of this have on Metrorail? We ran these projects through the Land Use-Ridership model, and what we found was both intuitive – and startling. Read more…
Transit expansion is in demand but Metrorail, light rail, and other high capacity transit projects can be expensive to build, operate and maintain. With limited resources to invest, our region must ensure that these projects serve the most robust transit markets and are supported by strong transit friendly policies.
Informed by our peers and local performance measures, Metro is developing guidelines that the region can use to inform development of high capacity transit projects. As we’ve explored previously, there’s much more to transit expansion than Metrorail. In fact, due to the cost associated with Metrorail expansion along with existing land uses and built environment in much of the region, most of our future high capacity transit projects will be made up of other transit modes. But what is the best way to decide what mode best fits each corridor? The goal of the expansion guidelines is to inform those decisions.

Development in Arlington’s Rosslyn-Ballston Corridor has validated initial and ongoing investments in Metrorail. (source: Arlington County)
A literature and peer review included policy documents from BART (PDF), the Bay Area Metropolitan Transportation Commission, Florida DOT, Virginia DRPT, Federal Transit Administration (PDF), and research from the University of California Transportation Center (UCTC). The review found that ridership, density, the presence of walkable streets and sidewalks, local plans and policies, and cost effectiveness are the most relevant criteria to evaluate transit projects and that rigorous performance targets are needed to support each transit mode. Read more…
Categories: ConnectGreaterWashington Tags: BART, BRT, corridors, DRPT, Light Rail, Metrorail, plans, ridership, Streetcars, tod, transit-oriented development
Metro provides the transit network around which a compact, low-carbon region can be framed. Without Metro available, the region would release an additional 400,000 metric tons of CO2e per year – equivalent to the carbon consumed annually by a land area approximately the same size as Fairfax County. By advocating for transit-oriented development as the region grows, Metro can continue to increase the net greenhouse gas (GHG) benefit or GHG displacement it provides to the region in three ways.
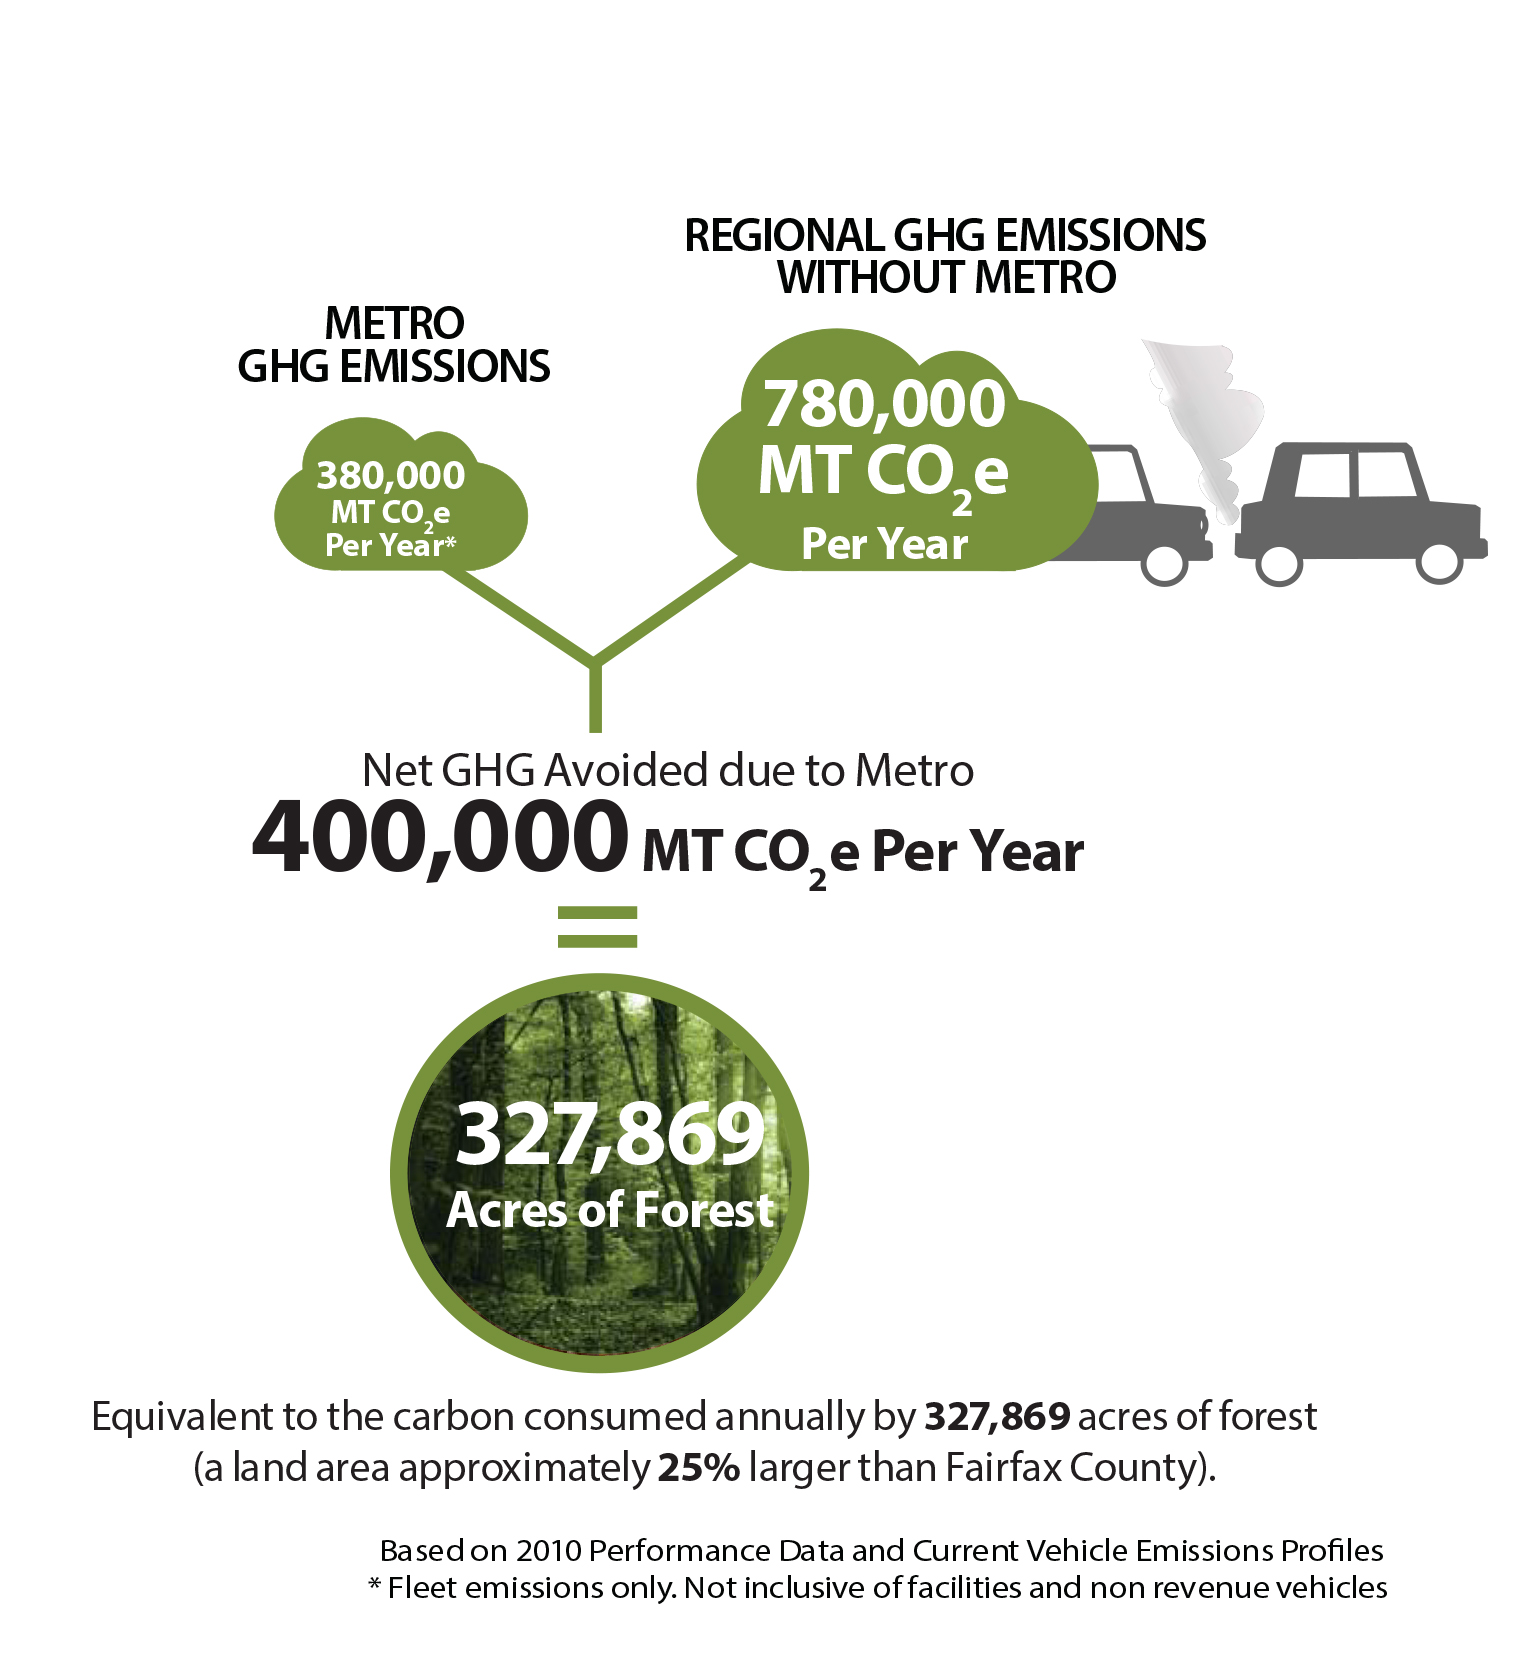
GHG Benefits of Metro
Read more…
Connecting Communities Concept. Click image for a larger version.
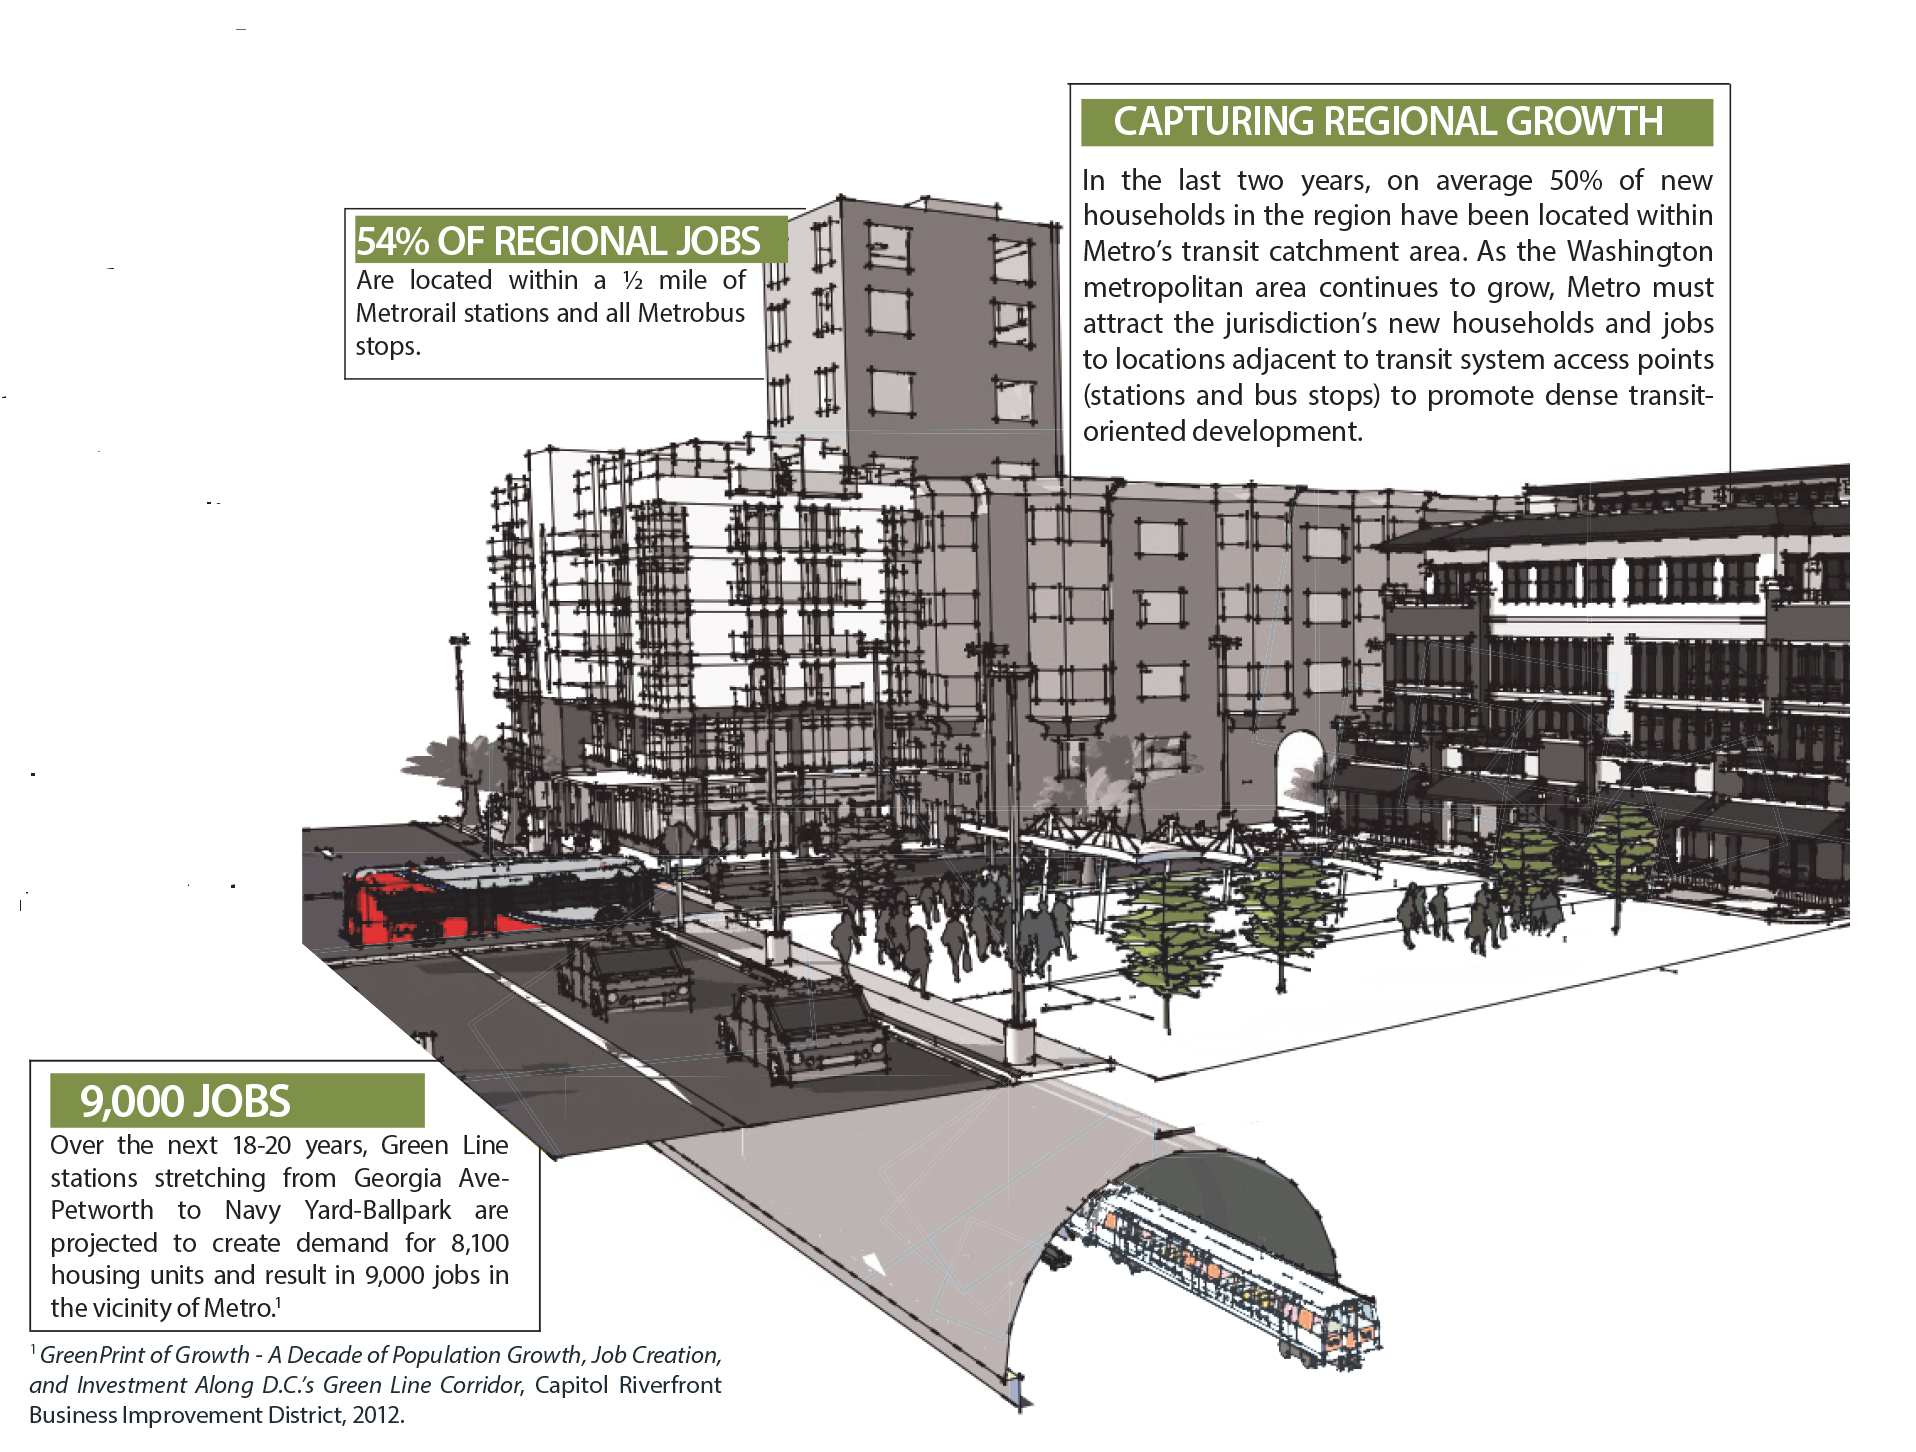
As the Washington metropolitan area continues to grow, the shape of that growth will define the character and sustainability of our region for decades to come. Attracting a significant proportion of the area’s new households and jobs to locations near rail stations and bus stops will provides a host of significant environmental and social benefits that can positively effect quality of life in the region. Quality of life can be improved by convenient access to services via walking, biking, and transit, which reduces road congestion and enables significantly less time to be wasted traveling between destinations via automobile. Compact development also serves to help preserve regional environmental resources such as open space, clean air, and healthy waterways.
- Open Space – By encouraging vertical development on existing underutilized brownfield and greyfield sites, greenfield sites on the urban periphery can be preserved. As and added benefit, this also means that no additional costs are incurred for new road and utility infrastructure to make these new sites viable.
- Clean Air – Reduced mobile emissions from vehicle travel improves local and regional air quality. Just as having cleaner air is important for human health and comfort, it is also important for the world around us. Cleaner air means fewer pollutants in our environment and that means plants, animals, water and soil are healthier too.
- Healthy Waterways – Compact development leaves more land open for stormwater detention and retention on undeveloped land at the urban periphery, thereby reducing the erosive impacts of stormwater runoff on rivers and streams.
One example of how Metro has worked with partners to attract regional infill growth is the NoMa-Gallaudet U station, the first infill station constructed on the Metrorail system. Utilizing what would have been excess capacity on the Red Line, the NoMa neighborhood, anchored by the station, has emerged as a high-density mixed-use hub for residents and commuters alike. Three years before the station opened, the assessed value of real estate in the 35 surrounding blocks was $535 million. Ridership has grown steadily since the station opened in 2004. Three years after the opening (in 2007) it was $2.3 billion — a 330-percent increase. From 2,100 trips in 2005 the station now has an average of 7,400 trips each weekday. Currently, based on the development pipeline data from NoMa BID the neighborhood is approximately 50% built out, with 16 million square feet of commercial and residential space. That is the equivalent of 50 high-density buildings in the 350 acre around the station. In contrast, to accommodate this scale of development in a low-density suburban setting would require in excess of 900 acres and would require new parking and roadway infrastructure due to the absence of transit.
A new Connecting Communities Key Performance Indicator (KPI) (PDF) is being developed to measure regional household growth in areas that are adjacent to Metro. This KPI will be reported through Metro’s Vital Signs Report in 2014.
This post forms part of a series featuring content from Metro’s Sustainability Agenda, part of Metro’s Sustainability Initiative.


Recent Comments