Metro is re-imagining the region’s bus network to improve travel times, enhance connectivity, and deliver service cost-effectively.
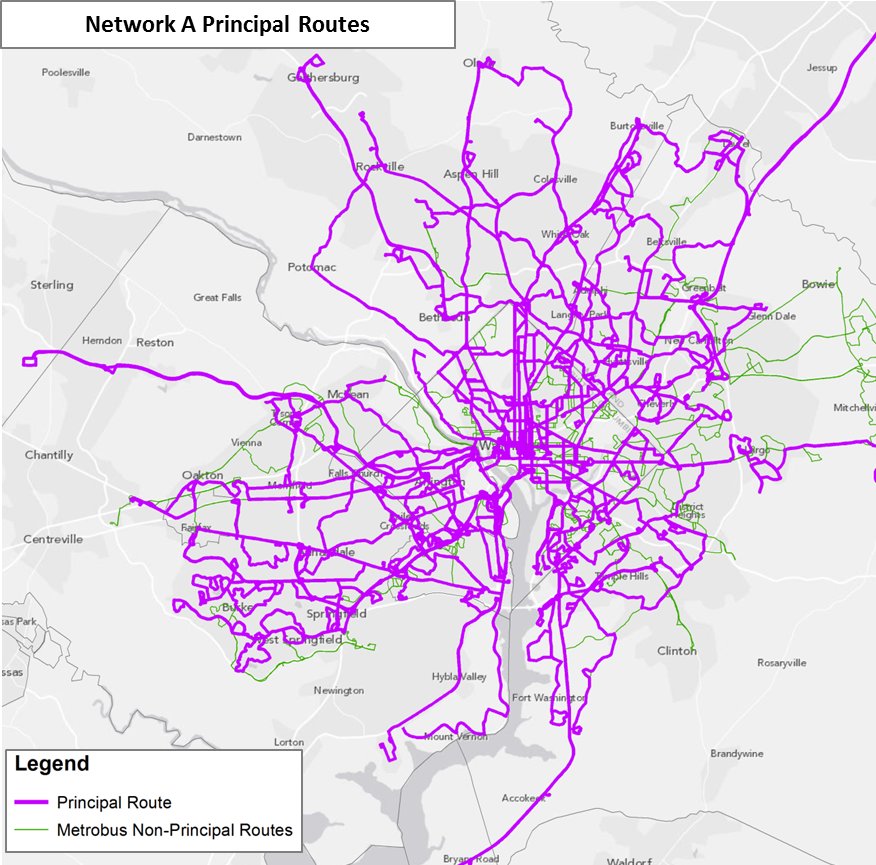
Over the past year, as part of the Metrobus Network Effectiveness Study, Metro began exploring potential future Metrobus restructuring scenarios based on the region’s growth trajectory over the next two decades. The scenarios also reflect the market segments where Metrobus can be more effective — places like the urban core, activity centers, and major arterial streets. Planners took the Metrobus network in the region’s Constrained Long-Range Plan (CLRP) for 2030 as the basis of comparison and formulated several network restructuring alternatives. This post will introduce the alternative networks, while future posts will present the performance of the networks, as well as a completely new proposed network built from the ground up. The flow chart below illustrates the network alternatives, followed by a brief explanation about each alternative.
Read more…
Transit expansion is in demand but Metrorail, light rail, and other high capacity transit projects can be expensive to build, operate and maintain. With limited resources to invest, our region must ensure that these projects serve the most robust transit markets and are supported by strong transit friendly policies.
Informed by our peers and local performance measures, Metro is developing guidelines that the region can use to inform development of high capacity transit projects. As we’ve explored previously, there’s much more to transit expansion than Metrorail. In fact, due to the cost associated with Metrorail expansion along with existing land uses and built environment in much of the region, most of our future high capacity transit projects will be made up of other transit modes. But what is the best way to decide what mode best fits each corridor? The goal of the expansion guidelines is to inform those decisions.

Development in Arlington’s Rosslyn-Ballston Corridor has validated initial and ongoing investments in Metrorail. (source: Arlington County)
A literature and peer review included policy documents from BART (PDF), the Bay Area Metropolitan Transportation Commission, Florida DOT, Virginia DRPT, Federal Transit Administration (PDF), and research from the University of California Transportation Center (UCTC). The review found that ridership, density, the presence of walkable streets and sidewalks, local plans and policies, and cost effectiveness are the most relevant criteria to evaluate transit projects and that rigorous performance targets are needed to support each transit mode. Read more…
Categories: ConnectGreaterWashington Tags: BART, BRT, corridors, DRPT, Light Rail, Metrorail, plans, ridership, Streetcars, tod, transit-oriented development
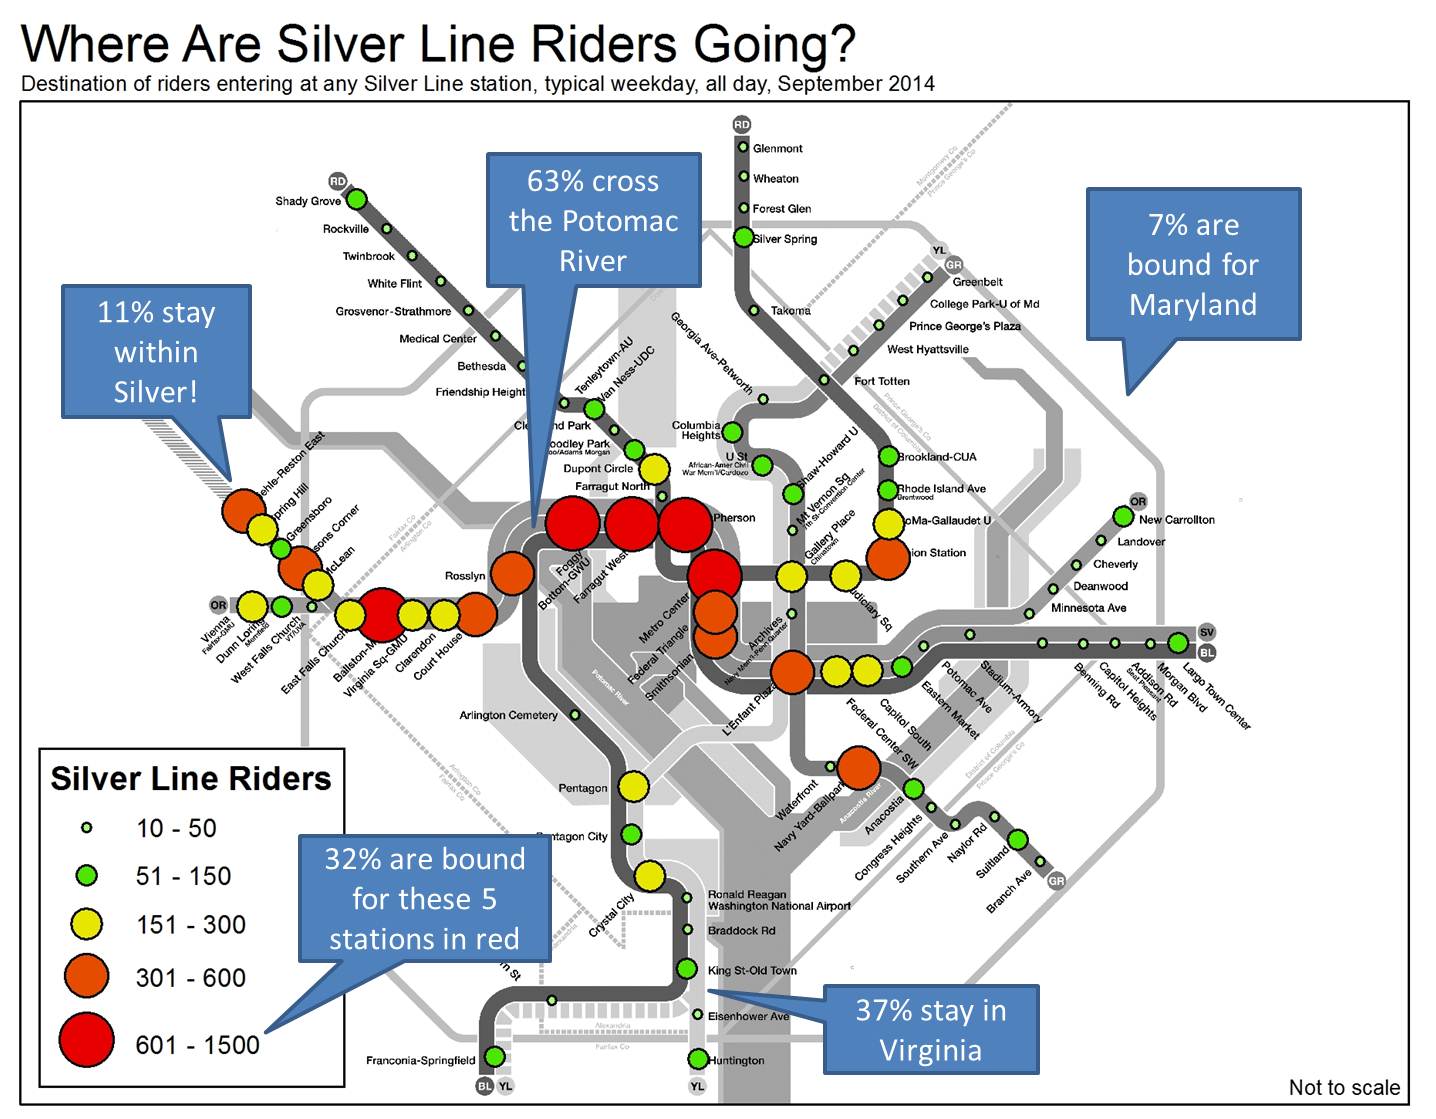
Ridership patterns on the Silver Line show that Metro’s new line is serving a truly regional market.
Now that school is back in session, the new Silver Line just completed its first full week where “normal” travel patterns are beginning to emerge. Ridership is strong, but where are these new passengers going? The diagram below shows destinations of all riders entering a Silver Line station in the week of September 8-12, 2014.

Some observations emerge from this: Read more…
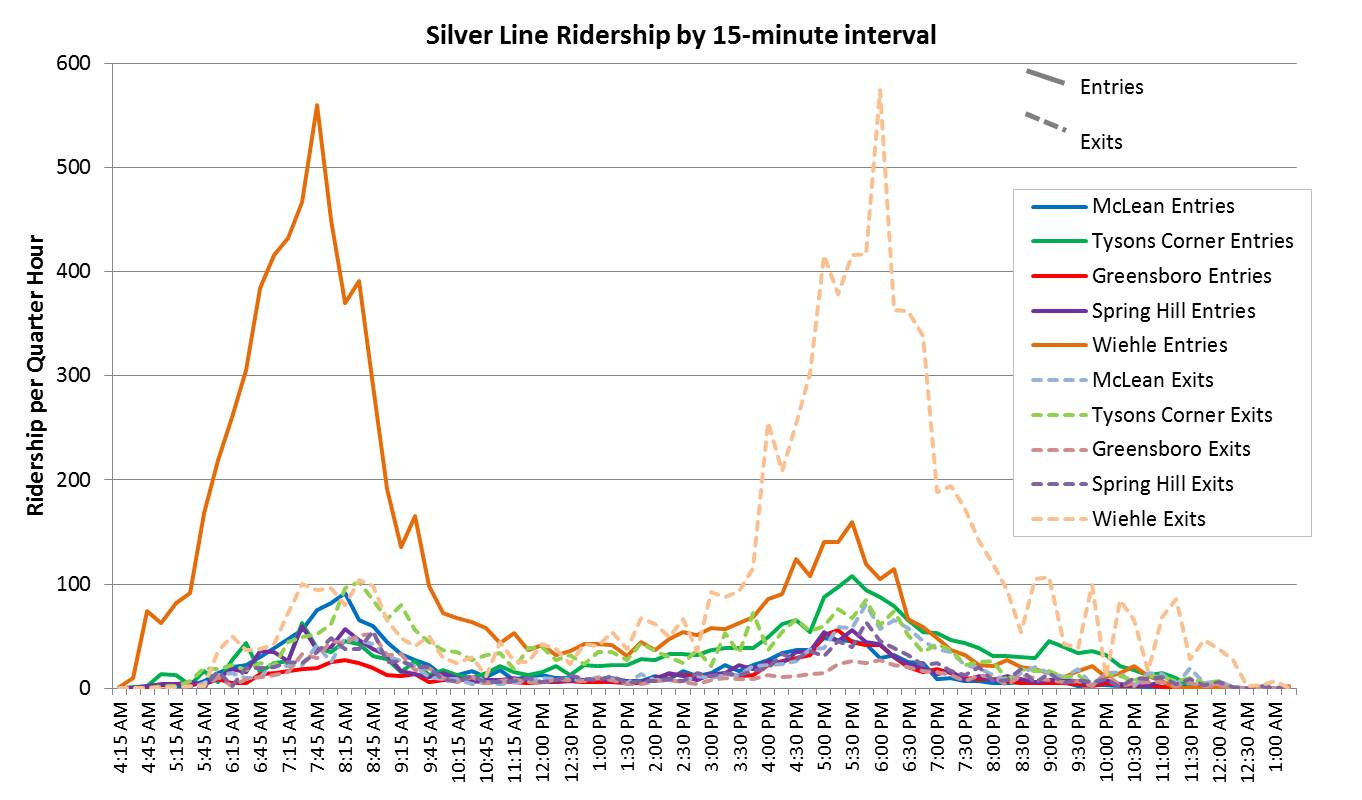
After just two months, ridership on the Silver Line is off to a solid start: Wiehle Ave is already over projections, reverse commuting is strong, and more.
Now that school is back in session and most summer vacations over, here is an in-depth look at the week of September 8-12, 2014, when “normal” routines may have begun to emerge.
At around 15,000 entries per weekday, the Silver Line is off to a solid start. Compared to the official projections from the 2004 Final Environmental Impact Statement (FEIS), we are achieving about 60% of the ridership projected for the end of the line’s first year:
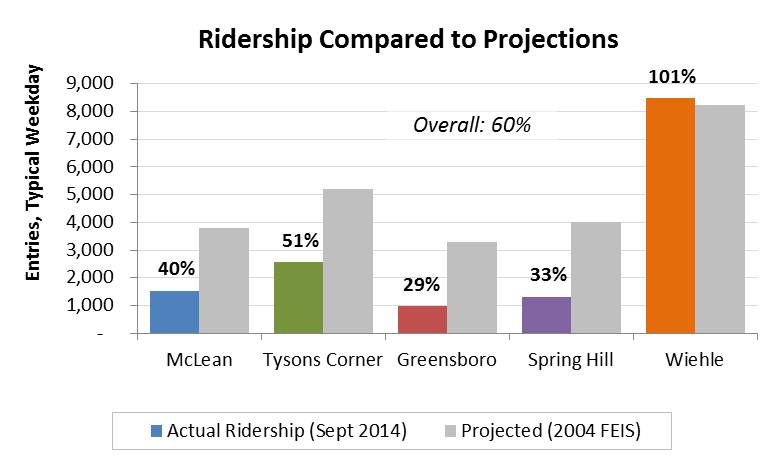 Wiehle station is already over opening-year projections and shows the highest ridership of all the new stations. Tysons Corner station is strong as well, but we still have room to grow at all four stations located in the Tysons area.
Looking at ridership by time of day shows the Wiehle is a commuting powerhouse, but also that a strong reverse commute market is emerging at the other stations:
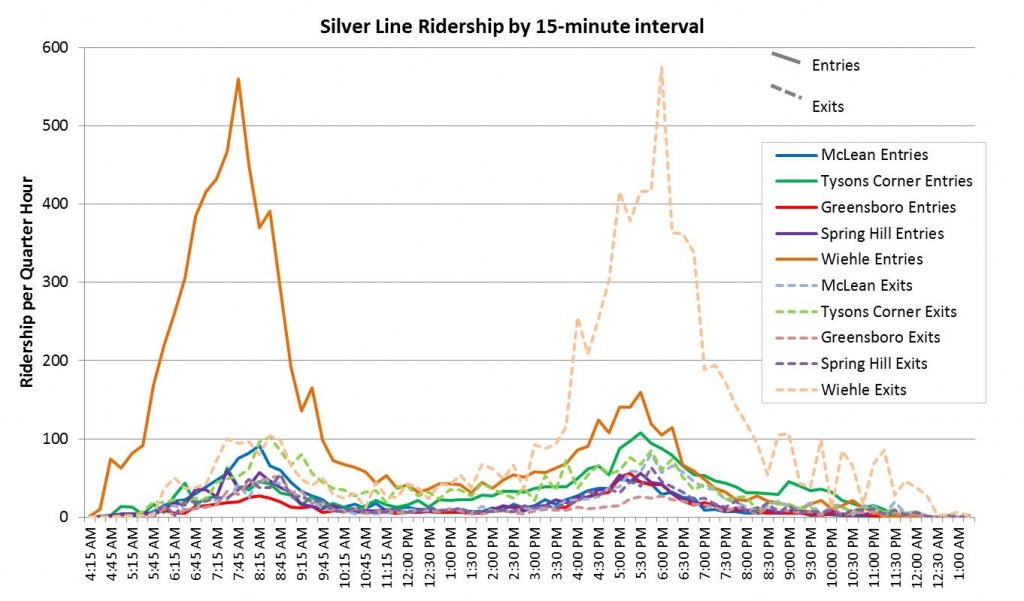
- McLean (in blue) is showing an early lead as a a “traditional” commute station, where most riders enter in the morning.
- Tysons Corner is much more dominated by reverse commuters, and its morning rush extends into mid-morning (around 10:00am). Evening ridership at Tysons Corners is also heavy. (More on off-peak ridership at Tysons coming soon)
- Greensboro and Spring Hill show relatively light ridership so far, but ridership is expected to grow over time as development catches up with the new station.
What do you think? Have you taken the Silver Line on a weekday? What was your experience?
The raw data by quarter-hour interval underlying this analysis is available in two formats: by station alone (2MB, .xlsx), and by origin-destination station (3MB, zipped tab-delimited .txt).
When the Nationals reached the playoffs in 2012, about 12,000 fans per game took Metrorail – from all over the region, and even late at night!
Now that the Nationals have clinched a spot in the playoffs, Nationals Park will once again host October baseball beginning this afternoon. How many fans might take Metrorail to and from the game?
To answer that, let’s look back to 2012, the last time the Nats reached the playoffs. Games 3, 4, and 5 of the National League Division Series (NLDS) were played here at Nationals Park – Wednesday at 1:07 pm, Thursday at 4:07 pm, and Friday at 8:37 pm. Attendance at all three games was around 45,000 people. Here’s what ridership (Metrorail system entries) looked like at Navy Yard-Ballpark station on those days:
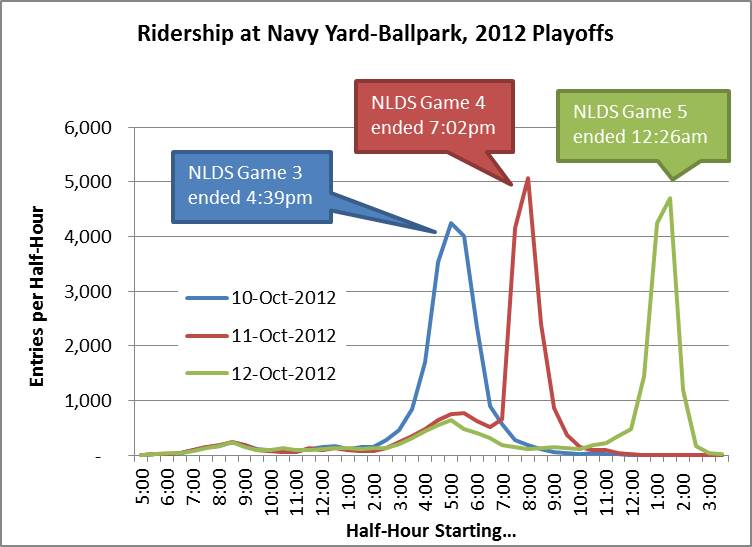
The sheer volume of passengers through Navy Yard station were impressive. Sustaining over 4,000 entries per half-hour for nearly two hours is roughly equivalent to 4-lane highway, and exceeds what even the busiest stations achieve on a typical day. For comparison, normal peak-of-peak volumes through Union Station, Metro Center, and Farragut West rarely exceed 3,000 entries per half hour. Read more…


Recent Comments