A visual of what transit supportive densities look like for different transit modes
Recently, GreaterGreaterWashington blogged about density, using Google maps 3D images to show what different densities look like in Washington, DC. Visuals like these are so important because most people hear “density”, think “Manhattan” and can’t say “no” quickly enough. Last fall, we completed work as part of ConnectGreaterWashington and the Transit Corridor Expansion Guidelines that illustrated the differences in desired employment and/or residential densities within a transit walkshed by each mode.
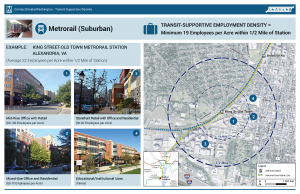
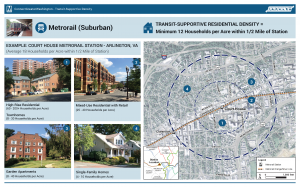
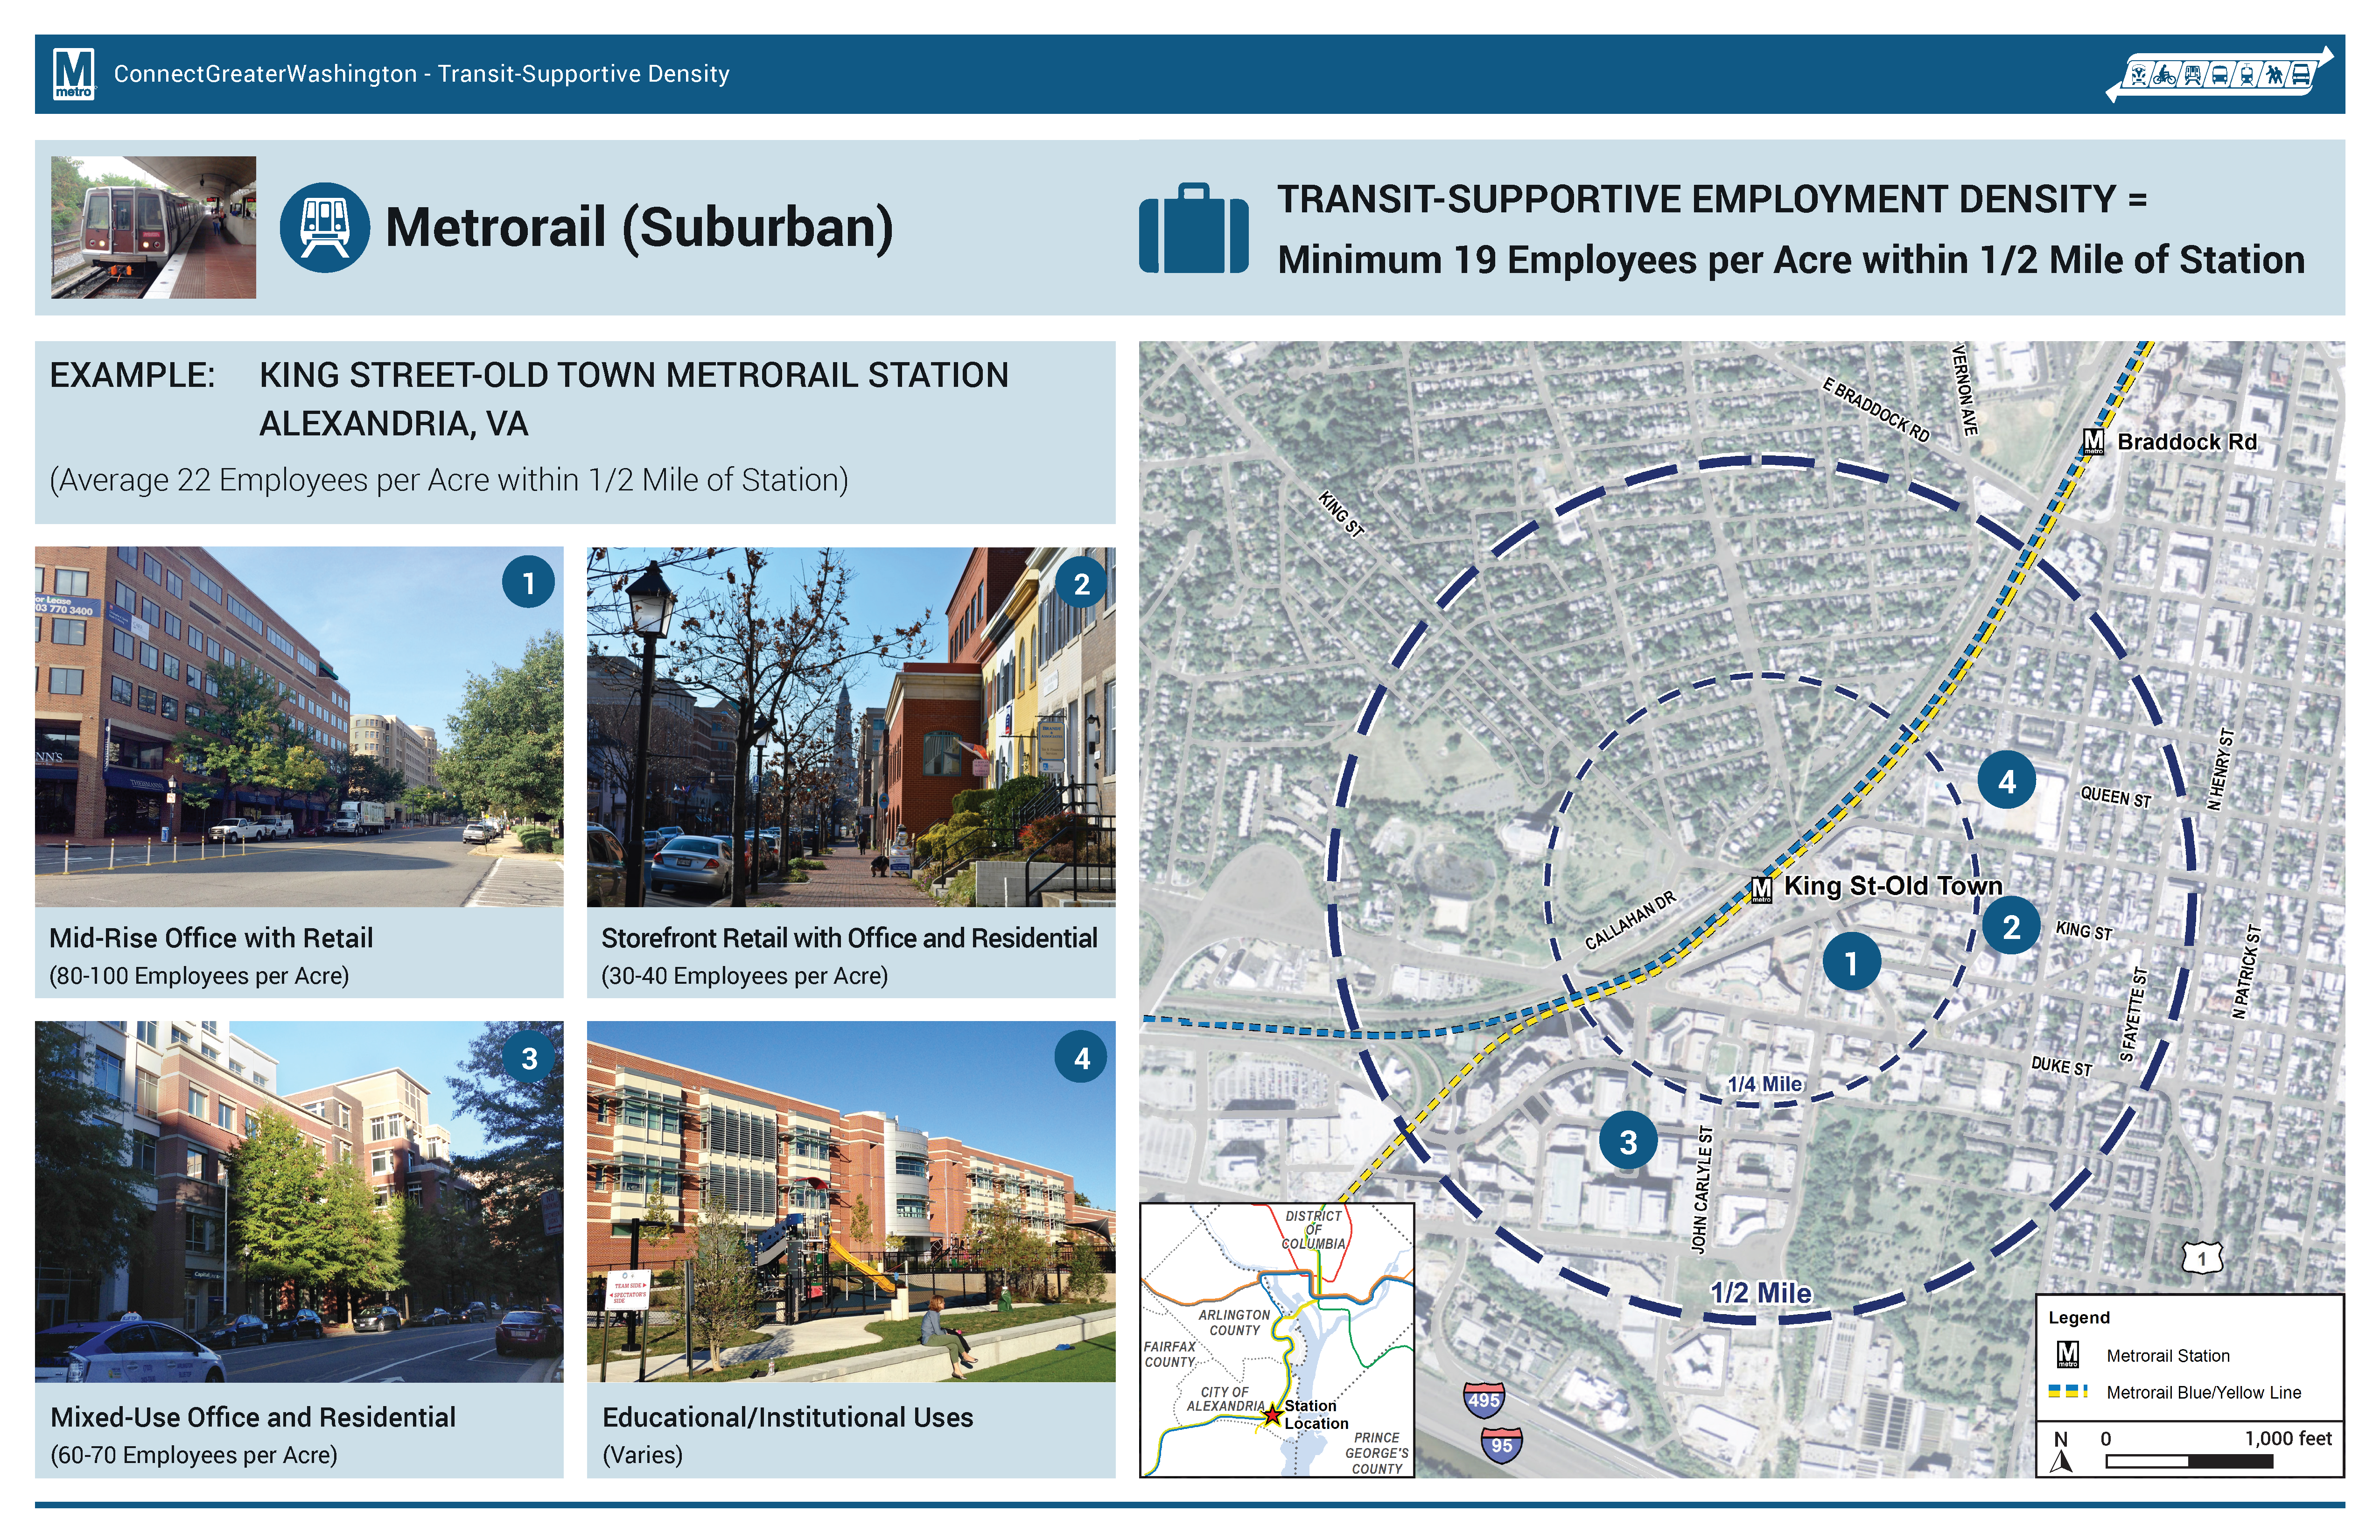
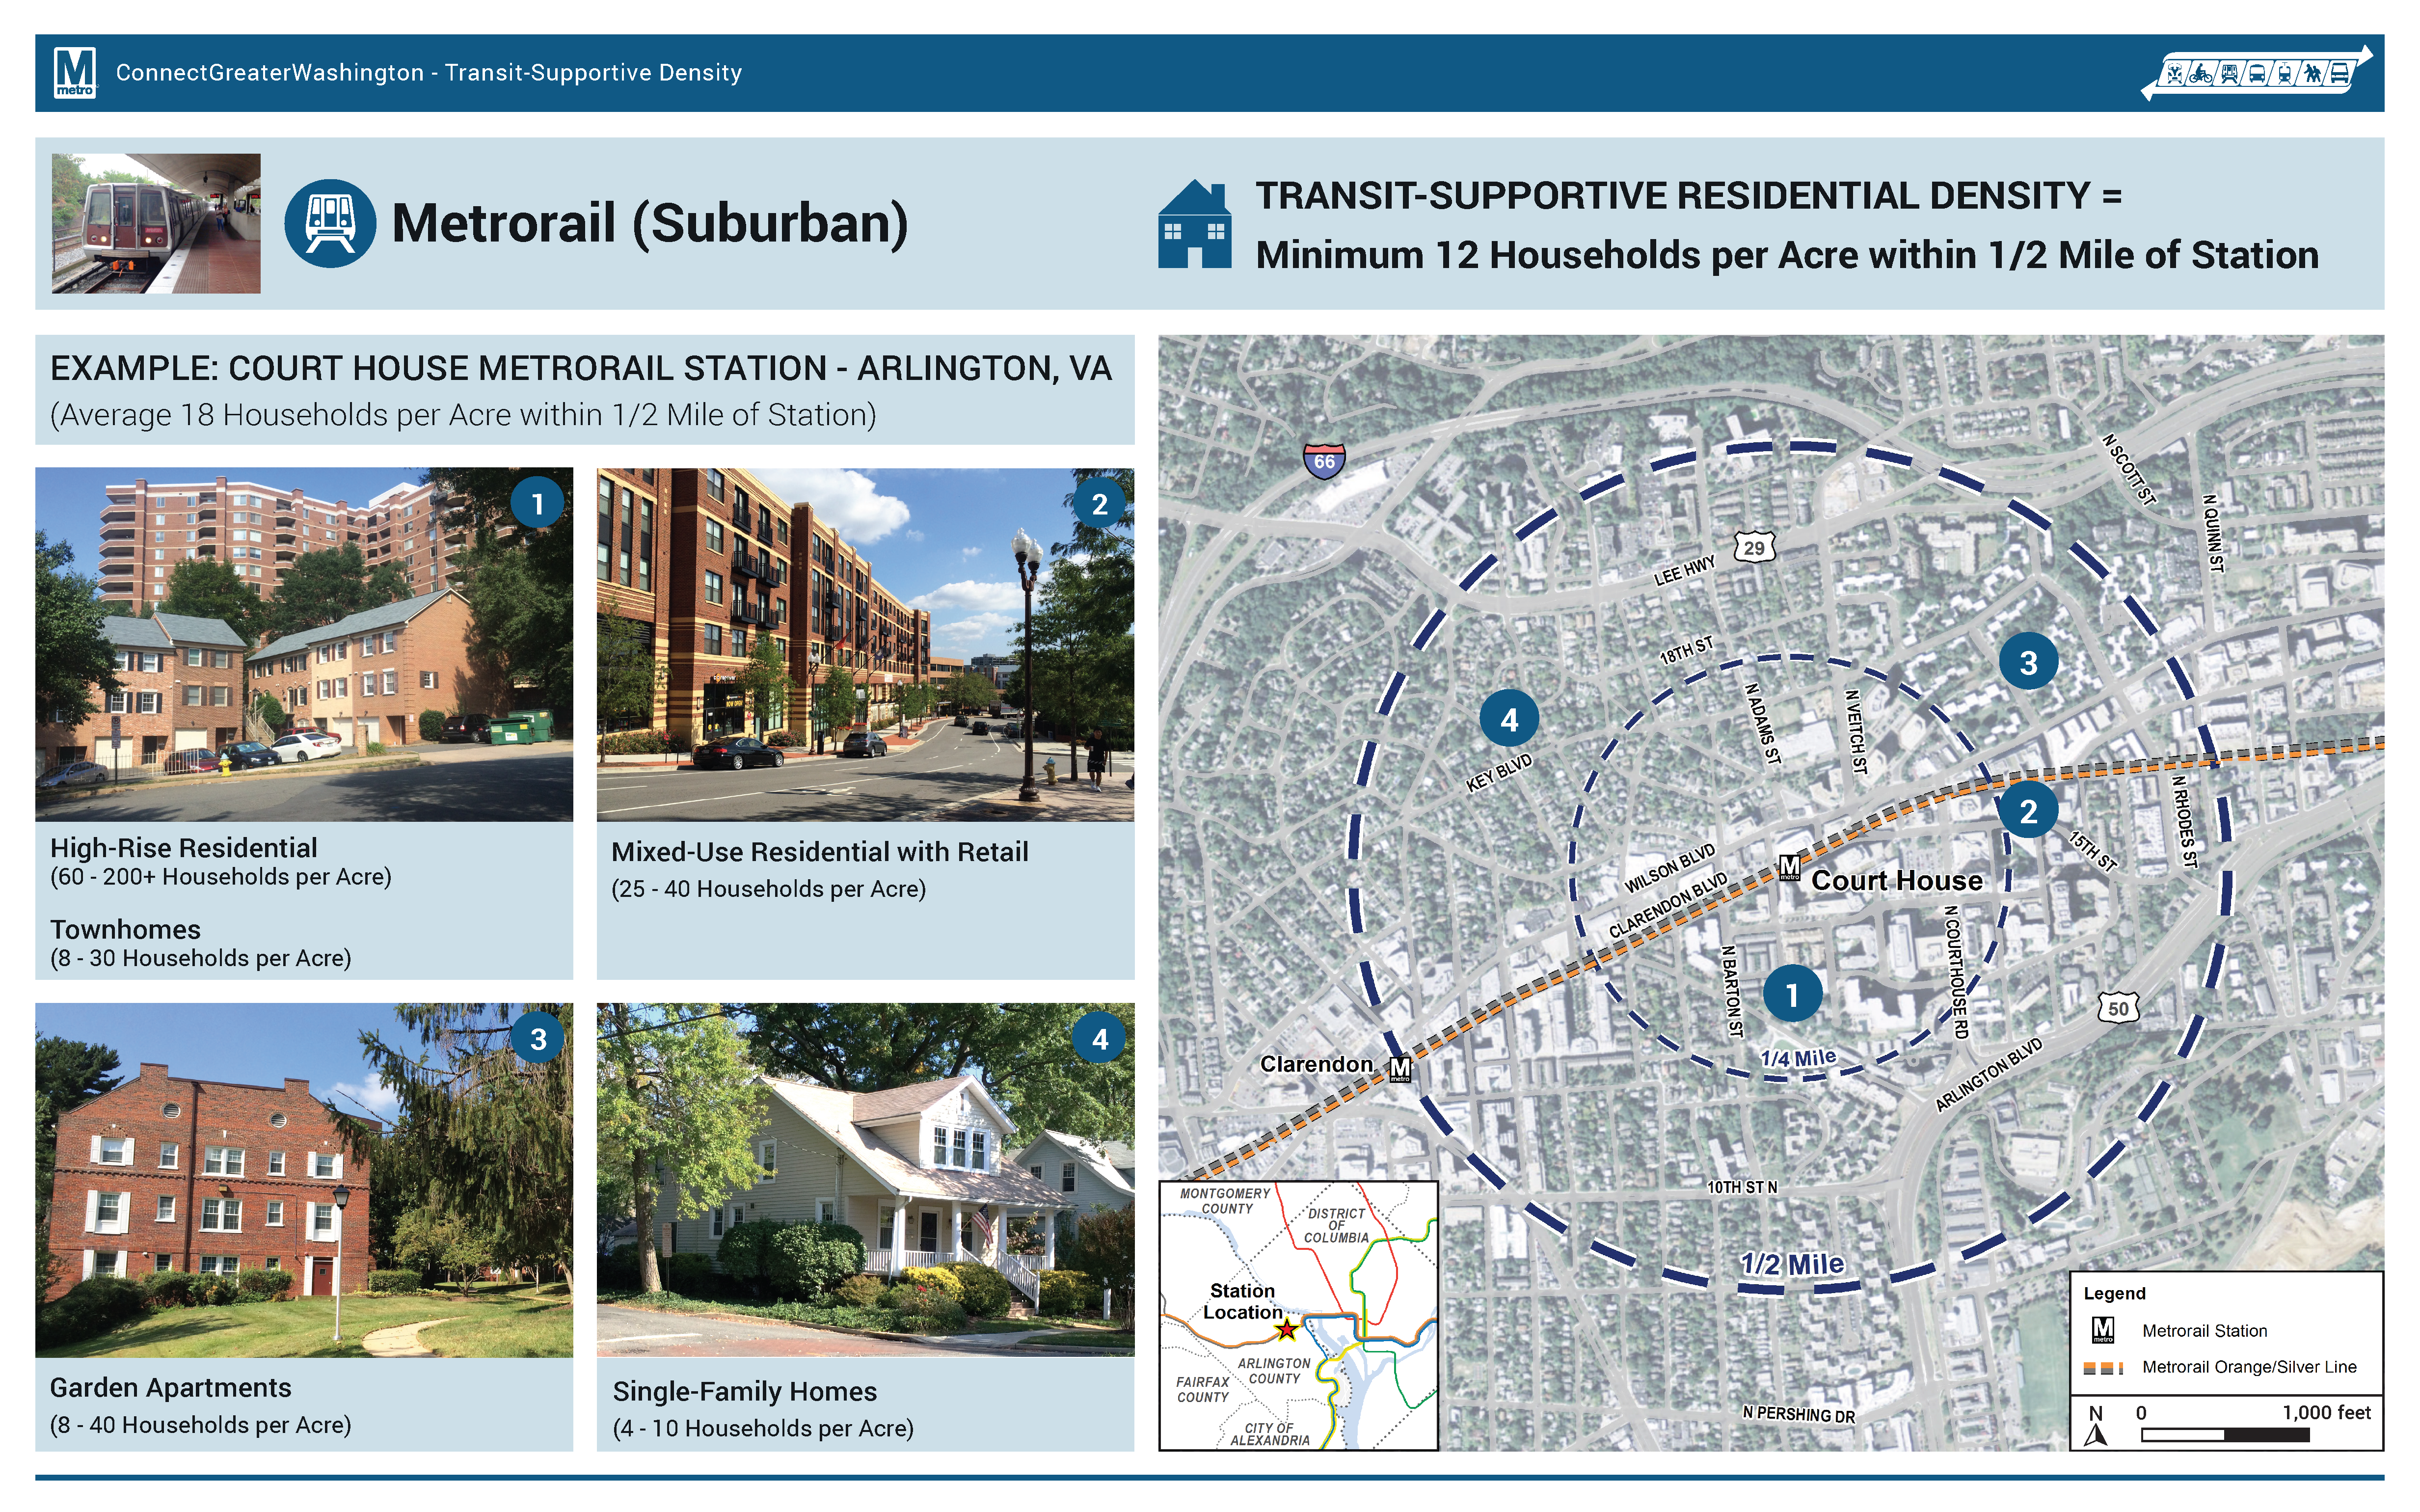
As is typical for planning projects, especially when expanding transit service along new corridors, density is discussed and jobs and/or households per acre targets are tossed around. But most people (full disclosure, that includes me) do not know what 4 households per acre or 150 jobs per acre looks like. It is especially important because a residential target of 12 households per acre within a half-mile of a suburban Metrorail station, for example, does not mean that every residential dwelling needs to meet that target. Instead, within the half-mile radius, the overall density should be 12 or more households per acre. That gives plenty of room to have less dense single family homes (on small lots) and more dense high rise apartments with studios and one-bedrooms.
Below are example stations for each mode and the employment and/or residential density targets, along with images of the different building types that combine to meet or exceed the targets. We’d appreciate your feedback on whether they make sense to you and if they would resonate with the general public.
Metrorail (Suburban) Densities
Note, because of the variability in density across the Metrorail system, we created two types of Metrorail stations to estimate densities.
Read more…
Better urban planning can help save our rivers and the Chesapeake Bay—by reducing this region’s future impervious surfaces by 20%. Here’s why.
As many Washingtonians know, the Chesapeake Bay needs help. Dead zones and algae blooms appear every summer which destroy aquatic life in the Bay and threaten fishing, swimming, and economic health. A major contributor to this problem is rainwater runoff from paved roads, parking lots, and roofs. These are called “impermeable surfaces”. In contrast, permeable (or pervious) surface is one through which liquids are able to pass.
Grassy fields, woodlands and farmlands are excellent examples of this: rainwater or snowmelt soaks into the ground, pollutants in the water are filtered naturally, and excess water travels underground to streams and eventually (in the Washington region) the Chesapeake Bay.Rainfall that falls on impervious surfaces like paved roads, parking lots and roofs “runs off” unfiltered making its way to the Chesapeake Bay—along with nitrogen and sulfur oxides from vehicle emissions, motor oil, and road salt residue.
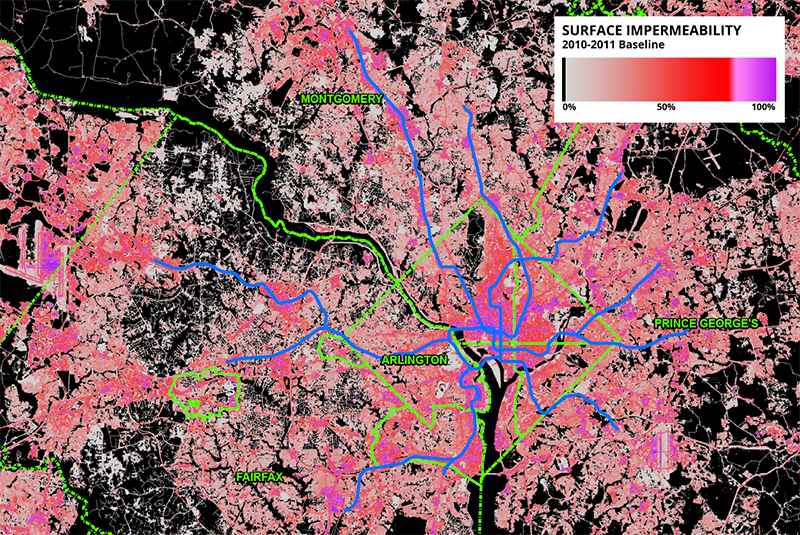
Figure 1 – Map of impermeability throughout the region with overlaid jurisdictional boundaries and Metrorail system for reference. Note the concentrations of highly-impermeable surfaces in central D.C., and at other activity centers like Dulles.
Read more…
Categories: Sustainability Tags: Chesapeake Bay, forecasts, landuse, open space, permeability, planning, stormwater, sustainability, transit, transit-oriented development, visualization, water and stormwater
The Los Angeles area is aggressively leveraging billions in local tax dollars to transform the region into a more vibrant place with a variety of transportation options.
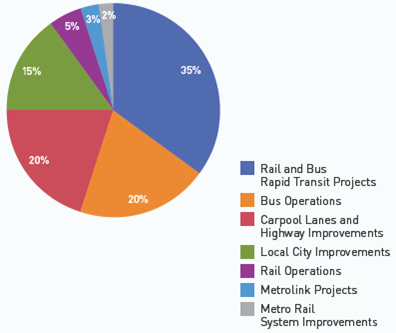
Measure R Spending Breakdown
The conventional wisdom today is that the days of big expensive transportation investments are over. Los Angeles apparently didn’t get the memo. The main transportation planning and development agency in the LA area, the Los Angeles County Metropolitan Transportation Authority (LA Metro), is currently leading the development of the nation’s largest regional transportation expansion program. The program of projects, Measure R, was overwhelmingly approved by more than two-thirds of LA county voters in 2008, and raised the local sales tax one-half cent. The half-cent sales tax is expected to raise $40 billion over 30 years (including an estimated $590 million in 2012) to provide the lion’s share of funding for Measure R transportation projects around the region, helping Angelenos avoid some of the area’s legendary traffic congestion. Not satisfied with the already impressive pace of expansion, LA Metro’s Board of Directors is now exploring a second ballot measure that could come as early as 2016.
Measure R includes an impressive array of transit projects, including the Orange Line Bus Rapid Transit extension, Expo and Regional Connector light rail lines, and the Westside Subway, among others. Below is a map of the transit projects fully or partially funded by Measure R (click on the map below for the interactive version):
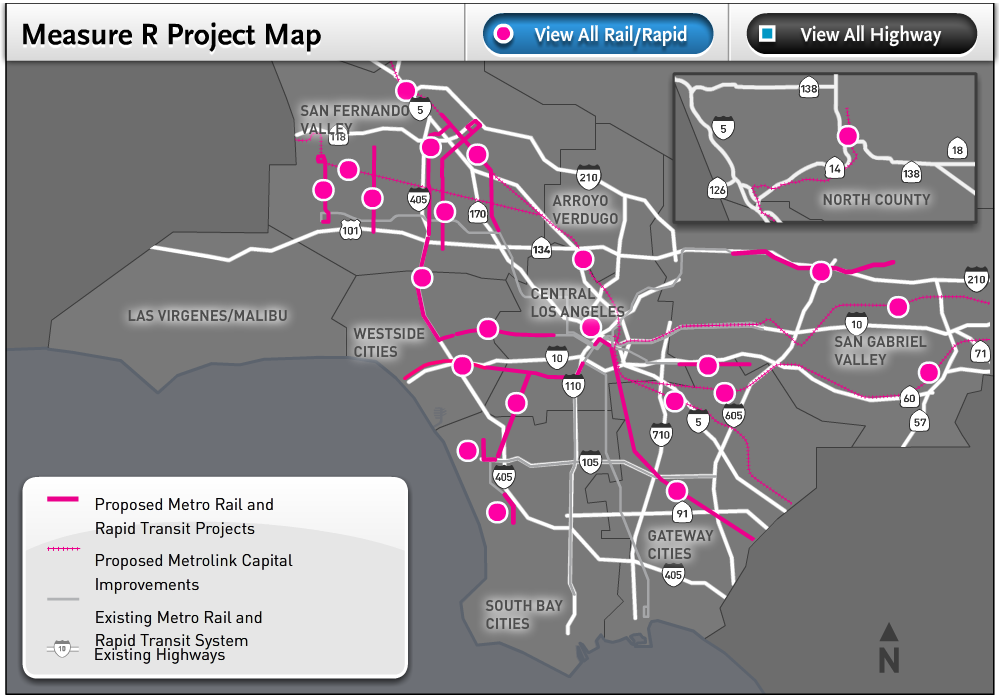
Measure R Transit Map (source: LA Metro)
Read more…


Recent Comments