Posts Tagged ‘safetrack’

Biking and SafeTrack – Highlighting the Need for Bike Infrastructure

September 28th, 2016 Comments off

Transit and bikes go hand in hand. Not only can riders bike to and from stations for that first and last mile, but biking is a great way to get around when Metrorail is under maintenance.  It’s important that our policy makers understand the importance of having good bike infrastructure.

jim-at-howard-theater

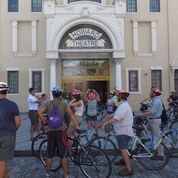
Biking to historic Howard Theater (photo courtesy of APA’s Sam Schipani)

On Sunday, September 18th, I rode around DC with a bunch of planners from across the country in town for the American Planning Association’s (APA) annual Policy and Advocacy Conference.  This annual conference gears planners up to advocate for federal, state and local policies that advance good planning principles through the legislative process.   There are two days of training workshops and speaker sessions and an entire day of meetings on Capitol Hill, where planners meet with their representatives to discuss planning issues and their importance to creating strong communities.

One of the training sessions sponsored by the APA Virginia Young Planners Group (YPG) was a mobile workshop on bicycle infrastructure planning and the role of the bicycle as a viable transportation option.  I was there as a speaker to provide some background about bicycling as an alternative for riders trying to get around during our SafeTrack rebuilding program.  Two other speakers very familiar with the biking world here in DC were on the tour as well – Jim Sebastian, who manages DDOT’s Active Transportation Branch and is their chief bike planner responsible for most of the DC bicycling infrastructure that has come on-line in the last decade and helped make DC #4 in the country for bike commuting, and Doug Smith, WABA’s Everyday Bicycling Coordinator. Read more…

Tens of Thousands of Customers Relied on Metrobus During SafeTrack Surges 3 and 4

September 12th, 2016 Comments off

Surges 3 and 4 saw the highest shuttle bus ridership of SafeTrack so far. Overall, Metrobus shuttles moved around 17,000 trips per day during Surge 3, and around 25,000 trips per day during Surge 4.

With shuttles every 2.5 minutes and Metroway running every 6 minutes, there were about 35 buses per hour during peak periods on Route 1. Taken together, the two services moved about 31,000 passengers per day during Surge 4. As a comparison, that stretch of road serves about 41,000 cars per day.

A small portion of shuttle bus ridership was on the Franconia to Pentagon shuttle, with the remainder on shuttles between Pentagon City, Braddock Road, Crystal City, and National Airport. The sheer volume of ridership on the shuttle buses made the shuttle operation Metro’s busiest bus line, albeit temporarily. At 25,000 trips per day, the shuttles moved more riders than we typically move on any other major bus route, including some of the busiest like 16th Street NW, or the various 30’s buses.

Not all rail customers chose to use the shuttles.

Some riders, especially those traveling locally, switched to other bus routes. Ridership on the Metroway premium bus service more than doubled compared to June, and during Surge 4, it nearly tripled compared to the same period last year! Ridership on the 10A was up 29-64%, and 11Y ridership was up 128-133%, or more than double. Metrobus added service on all of these alternative lines, and Metroway did not charge fares during the Surges. We will be monitoring future ridership to see if any customers decide to remain with Metroway after the surges end.

Overall bus ridership on other lines in the Surge area was up 1%.

These first SafeTrack surges highlight one of bus’ key attributes as a mode: flexibility.

Metrobus has supported the SafeTrack work by moving tens of thousands of passengers along corridors that don’t normally see that level of demand for bus service, in different locations every couple of weeks. There’s been plenty of work behind the scenes to make that happen:

  • The planning and scheduling team has worked out which routes the buses should take, which bus bays they should use at the stations, what time the buses need to leave the garages, and more.
  • Our customer facilities team has ensured there were signs up at all the stops and stations pointing the way to bus service.
  • The bus maintenance team has kept all the buses for SafeTrack up and running.
  • The street operations staff have answered passengers’ questions and worked with the Bus Operations Communications Center and the bus operators to make sure everything ran smoothly.
  • Bus operators have learned new routes in a very short amount of time and safely taken tens of thousands of passengers where they needed to go.

Usually, Metrobus makes service changes only about once a quarter, since passengers count on the consistency and reliability of our service. But when it’s needed, bus service can be very nimble, allowing it to support the important maintenance work being done during SafeTrack.

Did you ride Metroway or the shuttles during Surge 3 or 4? What did you think? What other opportunities are there to capitalize on the flexibility of bus service?

Help Metro Get Smarter: Now Hiring Business Intelligence Analyst

August 4th, 2016 1 comment

If you are great with data and love cities and transit, we have a job for you.

now_hiring-01

We were excited to announce that a job listing for a Business Intelligence Analyst position within Planning’s Applied Planning Intelligence unit has just been posted.  We are looking for a healthy overlap between a data scientist and a transit nerd.  For the full job description, head over to the wmata.com/careers site, scroll down and click on View all jobs.  A short description is posted below.

Currently a team of two, we work to convert Metro’s many data sources into information that can be used to inform plans, policies and procedures.  Many of our projects have been featured here on PlanItMetro, including:

Read more…

SafeTrack’s Surge 2 Bus Shuttle Proves Bus Rapid Transit Can Work Here

June 28th, 2016 Comments off

The shuttle buses at Eastern Market during Surge 2 are arriving every two minutes at rush hour, and are moving nearly the same number of people as 3 lanes of Pennsylvania Avenue SE.  This shows how much we can achieve by giving buses priority – lanes, signal priority, and more – on busy streets. 

27234765704_310d840f17_k

Commuters transferring from shuttle buses Eastern Market station (photo by author)

For the last week, Metrobus has been operating bus shuttles between Eastern Market and Minnesota Avenue and Benning Road, to provide alternatives around SafeTrack Surge 2 while we rebuild tracks and infrastructure on that segment of Metrorail.  While still moving less than half the the riders as what Metrorail normally moves, the shuttles are moving an impressive number of people:

  • In the morning rush hours, buses are arriving at Eastern Market every 2 minutes on average
  • Shuttle buses are delivering 1,800 people per hour to Eastern Market between 8:00 and 9:00am.  This is about the same as the number of vehicles that 3 lanes of Pennsylvania Ave. SE typically moves (1,500-2,000 vehicles per hour per direction, according to TPB Regional Transportation Data Clearinghouse).
  • Around 16,000-17,000 people per day are riding the shuttles, or about two-thirds of the number of vehicles driven through the corridor in a day (25,000 average annual daily traffic)
  • Traffic Control Officers from DDOT are critical to this operation, ensuring that everyone moves safely and efficiently

Read more…

Late Night Bus Maps and Options

June 15th, 2016 2 comments

Updated 7/6/2016

Now that Metrorail closes at midnight on weekends, what buses are available? New regional bus maps can help you find alternatives to Metrorail after midnight.

Since the launch of the SafeTrack program, rush-hour alternatives have been a hot topic across the region, especially for commuters impacted by the rail surges. However, it’s also important to address navigation strategies for people impacted by Metrorail’s earlier weekend closing time — midnight rather than 3:00 A.M. on Friday and Saturday nights (technically early Saturday and Sunday mornings). While nightlife patrons are part of the mix, most of our late-night rail customers are traveling to or from work. Since teleworking may not always be an option for these commuters, night owls should be aware of the bus options available after midnight.

We’ve assembled bus service availability, by hour, on weekends from Metrobus and our regional partners, and put the data on maps!

To see individual route labels, click on a map to expand.

Detailed timetable information is available from Metrobus, Fairfax Connector, Ride On, ART, and DC Circulator. Some bus service differs slightly between the two weekend days; you can plan a specific trip in Metro’s Trip Planner.

Note: Metrobus map data is based on information from the Late Night Service Study published in April 2016 and may not reflect recent service changes on certain bus routes. We will follow up next week with any updates.

Updated 7/6/2016: Map graphics have been revised to reflect current service patterns.

More maps below the fold:  Read more…

Rail Car Crowding and SafeTrack – Potential Customer Impacts Analysis Released

June 13th, 2016 1 comment

We have developed a customer impact analysis that shows how and where customers may be impacted in the SafeTrack safety surges, to help guide regional partners plan mitigation and alternatives

you_down_with_PPCThe first SafeTrack project began on June 4, meaning that Monday, June 6th, was the first day with peak-period service disruptions.  This first safety surge is to accommodate the track improvement project planned for the Orange and Silver lines between East Falls Church and Ballston.  With only one track available for revenue service, we are cutting back to just over 3 trains per hour on each line through the work zone.  When service levels decrease without a decrease in demand, we see an increase in passenger loading on rail cars.  We measure that with a metric called passengers per car, or PPC.

Our rail cars are designed to comfortably transport around 100 passengers each, with most sitting and a few customers standing.  After special events (or any given weekday on some lines) we often find rail cars with much higher passenger loads. From a planning perspective, an average PPC of greater than 120 is considered crowded.  Also, we know that customers don’t evenly distribute themselves across rail cars, so an average PPC of 120 means some cars are much more crowded. Read more…

Categories: Engage Tags: , , , ,

Rail Ridership Data to Help the Region Plan for SafeTrack

May 27th, 2016 3 comments

To help the region and our partners plan alternatives and mitigate the impacts of SafeTrack, Metro releases rail ridership data applicable to this important maintenance effort.

SafeTrack example 2Rail Link Volumes: This data describes the number of customers on board trains between two contiguous stations, for a given hour of the day, then assigned to rail links.  For example, the link volume from Bethesda to Friendship Heights is the sum of everyone who boarded upstream, minus those who exited at or before Bethesda. This can be useful for planning SafeTrack mitigation efforts because it gives a first-order estimate of the potential demand for a bus bridge, for example.

Online Interactive Map of Metrorail Link Volumes, average weekday and Saturday in May 2015

Metrorail Link volumes, average weekday in May 2015, by hour, by line color (580kb, .xlsx)

Read more…