Posts Tagged ‘Metrorail’

Would a Cordon Charge Help Stabilize Metro’s Finances? (Part 4)

July 5th, 2016 2 comments

Adding a London-style cordon charge (or fee) to enter much of the region’s central employment area would increase transit ridership across all modes and also reduce (or eliminate) the subsidy that local governments pay every year to support Metro, meaning lower tax bills for regional residents.*

(This post is part of a multi-part series about ConnectGreaterWashington (CGW) a study that WMATA completed in 2015 and its application of land use and pricing as a transportation strategy.)

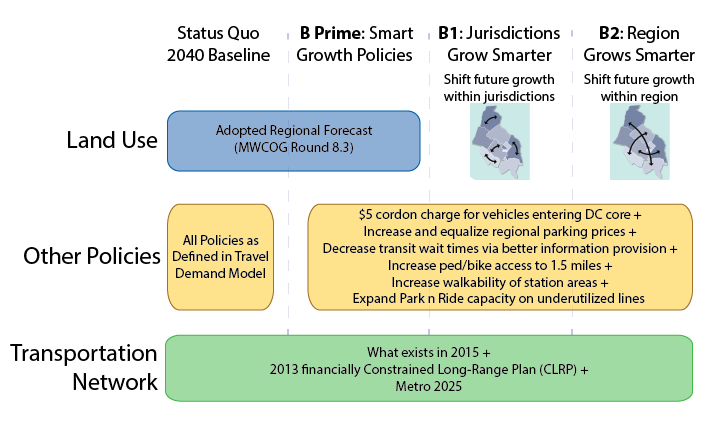
Approach for Building Scenario B to make Transit More Cost-Effective

Scenario “B” looked at land use shifts and increasing the price of driving, and how those changes would impact Metro.

Metro asked, “What if the region’s future growth was used to fulfill the expectations of regional plans such as Region Forward and Place + Opportunity? What if transit-supportive policies were implemented across the region? Would WMATA benefit? Would the region?”

Answer: YES!!

*Note that Metro is not proposing that the region adopt a cordon charge, but it was tested as part of an analysis of how smarter land use and more transit-supportive policies could impact transit ridership, our operating subsidy, and other measures that support the region’s growth.

Read more…

What’s the “Word” on SelectPass

June 20th, 2016 7 comments

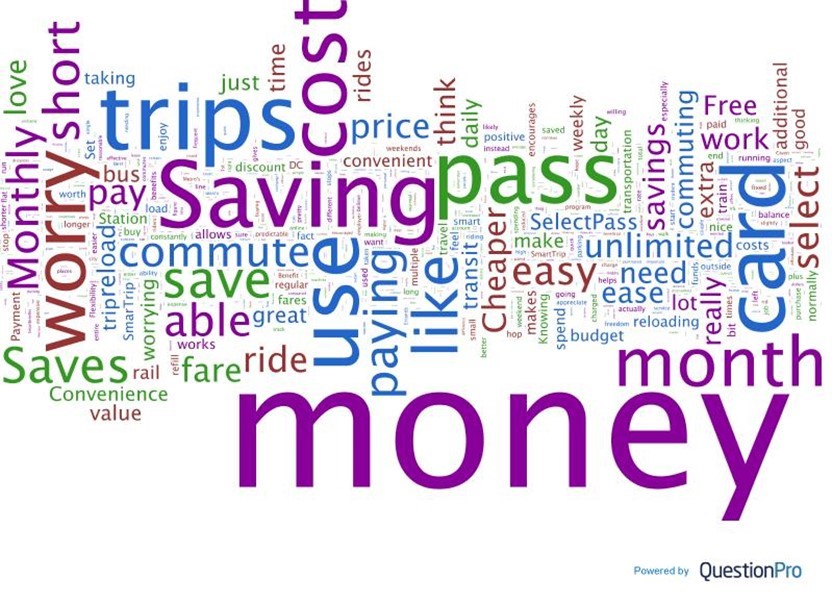
Customers are saying great things about SelectPass, Metro’s new unlimited monthly pass program.

SelectPassWordCloud

Word Cloud representing what SelectPass customers have said about the new pass program. Click for a larger version.

This post was submitted by Metro’s Director of Customer Research.

Metro’s limited time offer SelectPass has early adopters talking. In April, Metro sought to provide new payment methods by introducing SelectPass—a multi-tiered pass option allowing customers to ride as much as they want on Metrorail (and Metrobus).  Currently two price points are available. Read more…

Rail Car Crowding and SafeTrack – Potential Customer Impacts Analysis Released

June 13th, 2016 1 comment

We have developed a customer impact analysis that shows how and where customers may be impacted in the SafeTrack safety surges, to help guide regional partners plan mitigation and alternatives

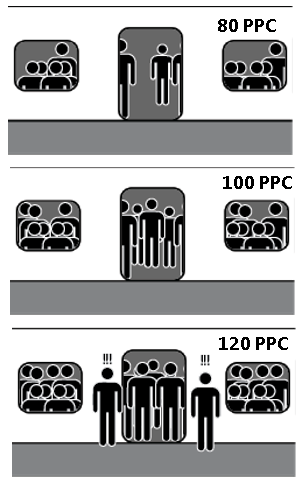
you_down_with_PPCThe first SafeTrack project began on June 4, meaning that Monday, June 6th, was the first day with peak-period service disruptions.  This first safety surge is to accommodate the track improvement project planned for the Orange and Silver lines between East Falls Church and Ballston.  With only one track available for revenue service, we are cutting back to just over 3 trains per hour on each line through the work zone.  When service levels decrease without a decrease in demand, we see an increase in passenger loading on rail cars.  We measure that with a metric called passengers per car, or PPC.

Our rail cars are designed to comfortably transport around 100 passengers each, with most sitting and a few customers standing.  After special events (or any given weekday on some lines) we often find rail cars with much higher passenger loads. From a planning perspective, an average PPC of greater than 120 is considered crowded.  Also, we know that customers don’t evenly distribute themselves across rail cars, so an average PPC of 120 means some cars are much more crowded. Read more…

Categories: Engage Tags: , , , ,

Off-Peak Fare Discounts and their Behavioral Implications

June 8th, 2016 4 comments

Metrorail riders facing a high percentage off-peak discount are motivated to delay their travel and save.

This post is guest-written by Sam Winward, a behavioral economist and Metrorail commuter who lives and works in the District. His analysis of Metro ridership patterns sheds light on the influence of off-peak pricing.

If you’ve ever waited a few extra minutes before swiping through a Metrorail faregate to qualify for the off-peak fare, you’re not alone. Within the afternoon peak / off-peak cusp period, when riders may be somewhat time flexible, Metrorail data from AprilMay 2015 confirms that some riders are delaying entry for savings.

What riders probably don’t know, is that their off-peak pricing discount could be substantially different from the riders around them. In fact, off-peak percent discounts can range from a 19% to 40% reduction of peak fares. Given the varying degree of off-peak incentive, riders are responding as we’d expect when weighing their opportunity cost of time.

As percent savings increase, riders are more likely to delay travel for off-peak fares. The graph below, derived from WMATA data, displays this ridership tendency.

Note the ridership uptick just after 7 pm. This runs counter to the natural pattern of declining ridership over this period, and the uptick steepens as the percent discount facing riders increases.
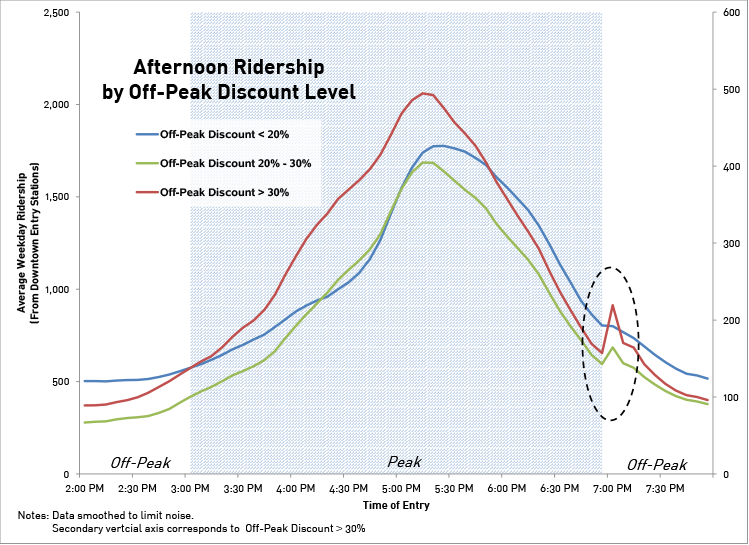
Exhibit 1_Ridership Uptick

So why is there so much variation in off-peak discounts, and who are the lucky riders allowed large savings?

Particular trips, based on mileage between origin / destination stations, are subject to off-peak fare “caps.” WMATA introduced the caps in 2012 when off-peak fares switched to incremental fee-per-mile pricing. Off-peak fares for trips of just under 7 and 10 miles were capped, as these trip distances would have otherwise seen very large increases between the old and new fare structure. A maximum off-peak fare cap of $3.60 was also implemented, affecting riders with trips lengths greater than 11 miles.

The effects of these fare caps remain in the system today, and are not mirrored in peak fares.

As displayed below, the gap between peak and off-peak fares increases over regions subject to off-peak fare caps. This makes off-peak travel more enticing for riders’ whose trip length falls within a green zone.
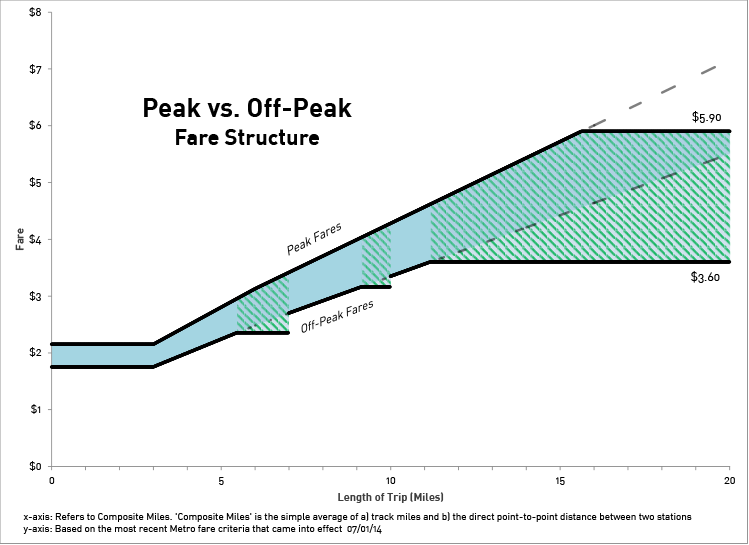
Exhibit 2_Fares

Notably, small tweaks in the fare structure have large behavioral effects.

Even if you decide that added off-peak savings aren’t worth the wait, at least your decision can be informed. To see the off-peak discount applicable to your route, and how it compares to the rest, check out the interactive off-peak discount calculator on my website.

The full story, including the off-peak discount calculator and a formal analysis of the delayed ridership patterns, can be found at Sam’s site.
Designing the SelectPass Test Phase

May 4th, 2016 9 comments

The new Metro SelectPass is structured to to maximize pilot participation while minimizing the risks.  Making that happen involves overcommitting to truth in advertising – and we’re fine with that!

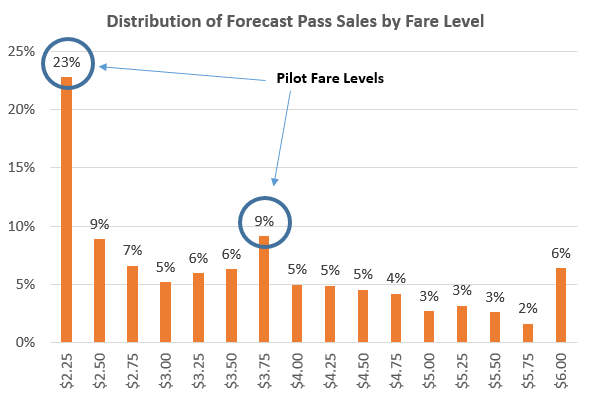
The two most likely fare levels for the SelectPass are $2.25 and $3.75.

The two fare levels most likely to be popular for the SelectPass are $2.25 and $3.75.

We are excited about the launch of the new SelectPass pilot.  As we have begun to roll out this new pass product, we are listening to your questions (via twitter, comments posted to articles, etc.) and we hope to address as many of them through the proper venues.  PlanItMetro seems to be the best forum to answer the persistent question, “Is this really only for two fare levels, and why don’t you tell everyone that they can probably save money?”

Testing the capacity of the Fare System

When we roll out new features, we want to eliminate as many risks as possible before committing to them.  In this case, the primary risk Metro faces is that our aging fare technology might not be able to accommodate a very different fare product such as SelectPass.  So we developed a program to test the pass at two individual “levels” as a proof of concept and not push any limits of our fare collection technology. Read more…

Categories: Engage Tags: , , , , ,

2016 Travel Trends Rail Passenger Survey is Underway

April 19th, 2016 No comments

Metrorail riders get excited; the 2016 Travel Trends Rail Passenger Survey is here! If you haven’t noticed all the orange in the stations yet (surveyors in orange Metro bibs handing out orange surveys, offering orange Travel Trends pens to fill them out), keep an eye out! Throughout April and May of 2016, WMATA (Metro) will be conducting the Travel Trends survey on a rolling basis throughout the system, to cover all 91 stations.

The Rail Passenger Survey is an FTA-mandated survey that Metro is required to administer every five years, or at least two years after the launch of new rail service (this year’s survey comes two years after the launch of the Silver Line). The primary use of the survey is to:

  1. Determine jurisdictional transit subsidy allocations.
  2. Improve our service and validate our internal systems.

Here is a video that summarizes the work being conducted and why it’s important:

Your answers to the survey contribute to the data used to support operating and planning activities—it provides us with greater insight into how we can best match service to fit the overall needs of our customers using the system.

Here is a sample of some of the questions we ask in the survey, and what your answers to those questions will be used for: Read more…

Categories: Engage Tags: , , ,

Metrorail Ridership Data Download, October 2015

March 14th, 2016 10 comments

New data download features rail ridership by origin, destination, day of week, and quarter-hour intervals.

ridership_plots_subset

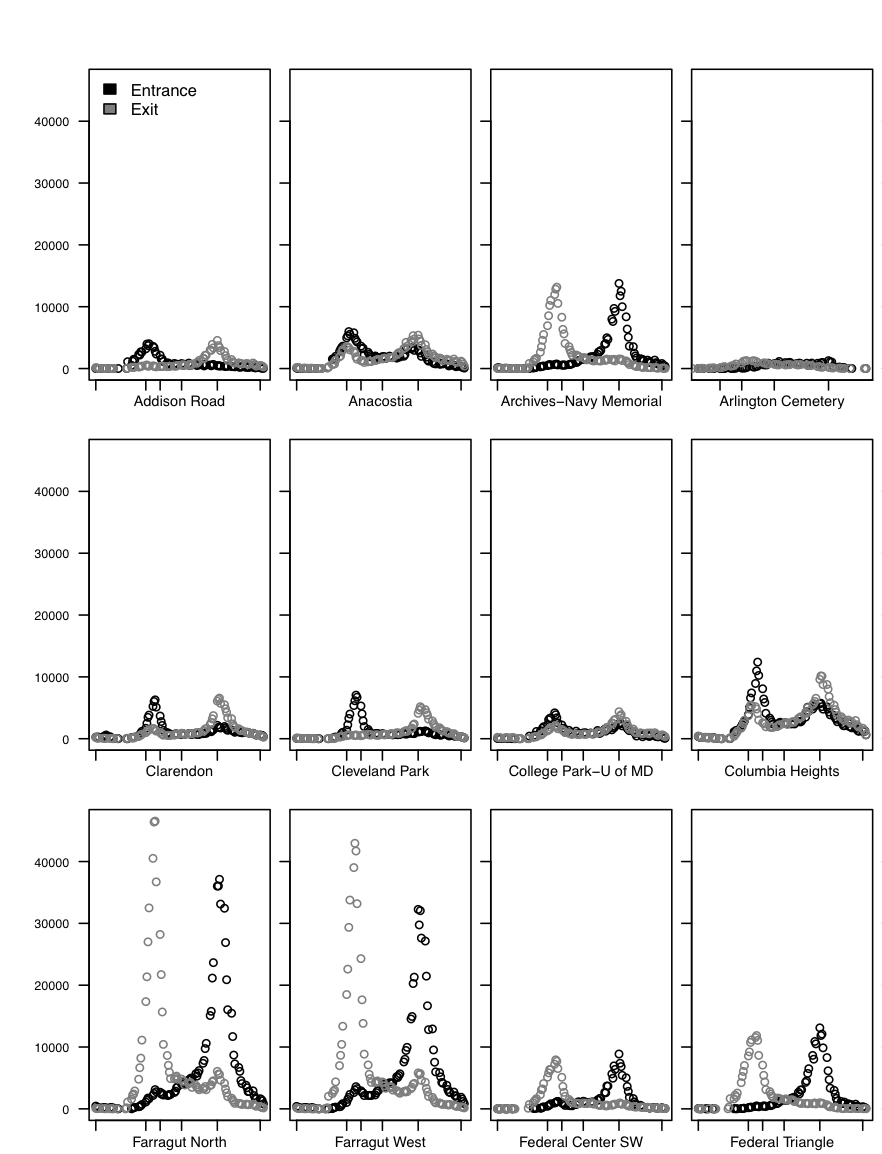
Subset of the visualization made by BioNrd aka Mike from our October 2014 data download data.

As you’ve probably noticed, it’s been a while since we’ve released a fresh batch of Metrorail ridership data.  Continuing the spirit of openness, we have recently uploaded data from October 2015 in CSV format.  (The number of rows is too great for Microsoft Excel).

This new dataset includes day of week data, so you can begin to investigate impacts of evolving workplace policies such as compressed work schedules.  You can also compare it to October 2014.

In the past, we have seen a lot of innovative analyses of the data we share.  Perhaps the best so far was a visualization of Metrorail station entries and exits by station by “BioNrd” aka “Mike.” What else can we learn from this dataset?


Acting Regionally Pays Big Dividends (Part 3)

March 10th, 2016 Comments off

Adding jobs and households in transit-served areas not only increases Metro ridership, but also reduces and may even eliminate the subsidy that local governments pay to support Metro, meaning lower tax bills for regional residents.

(This post is part of a multi-part series* about ConnectGreaterWashington a study that WMATA completed in 2015 and its application of land use as a transportation strategy. The below post and links provide additional detail.)

In December of 2015, public and private leaders issued a call to action for the many jurisdictions in this region to start acting as one.  We’ve actually been thinking about this for some time, and their announcement timed well with our desire to share perspectives on the following questions.

Questions:

  • What if the region’s future actually approached the goals of collaborative regional plans such as Region Forward and Place + Opportunity?
  • Would WMATA and the region benefit?
  • Are there financial, social, quality of life and environmental benefits?

Answers: YES, YES, and YES!

Approach: Metro planners hypothesized that changing local jurisdictions’ and/or the region’s approach to future land use decisions, such as where to guide future jobs and population and expanding transit-supportive policies, could enable the region to better use the transportation system we already have rather than require us to spend tens of billions on new transportation projects.

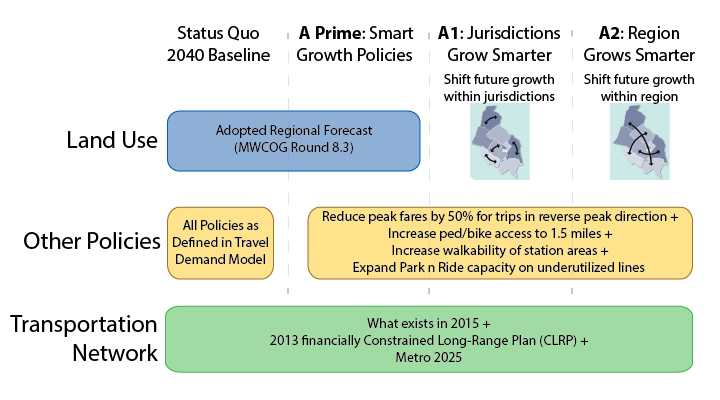
Planners developed three different scenarios (A, B, and C) that used the transportation system we already have, but modified future growth policies that determine travel patterns. The below post talks only about Scenario A, which had a specific goal to increase ridership on all segments of the Metrorail system, while minimizing the potential for overcrowding on any segment in the system. The image below shows how we built Scenario A and its three iterations (A Prime, A1, A2).


Approach for Building Scenario A to make transit more efficient

Read more…

Metro Planners Share Innovations in Transit Delay Calculation at TRB

February 25th, 2016 5 comments

Adopted from queueing theory, this new method of assessing delay on transit systems with tap-in-tap-out fare systems accounts for natural variations in customer behavior.

As you may have heard, Metro is testing out a new customer-oriented travel time performance indicator. Many departments here at Metro have been collaborating on this effort. Metro has decided to initially pilot a measure where we define delay as anything greater than train run time, a headway, and the 1-3 minutes it takes to travel from the faregates to the platform. However, as we began our research into customer travel time, we got to asking the question, “How do we define customer delay on the rail system?”

tortoise_and_hare

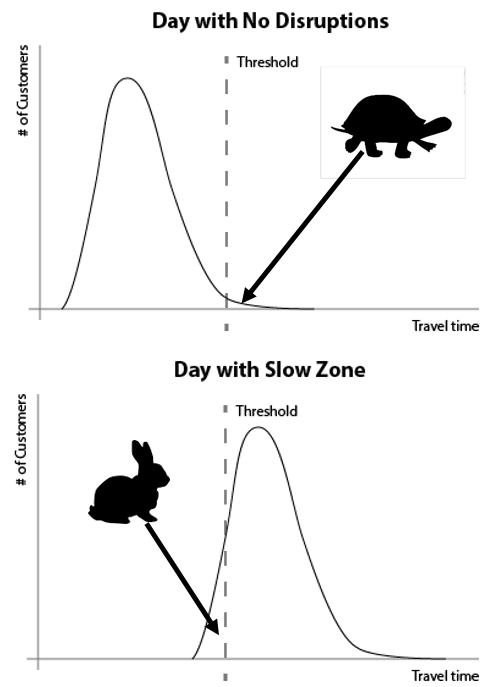
As we quickly learned when digging into the data, on good days with no delay on the rail system, there is still a wide variety of “normal” customer travel times. Some variation in travel time is because customers arrive at random to the origin station, but all leave the destination station more or less at once.  Additional factors influencing this variation include walking speed, use of elevator vs. stairs, escalator or elevator outages, and customers with suitcases and strollers.

We could start with a threshold for “on time” but by definition we know on a good day there were no rail delays so we would be counting slower customers as “late.”

Additionally, on a day when we know a disruption has occurred, we might count very quick customers as “on time” when in fact we know that everyone experienced some delay.

So we set to determine a method for calculating delay that accommodated for the natural variation in customer speeds.  These travel time curves started reminding me of delay calculations from queueing theory from grad school. Read more…

Categories: Engage Tags: , , , ,

Estimating the Impact of the US Citizenship and Immigration Facility on Metrorail

February 24th, 2016 Comments off

The Federal Government is the region’s single largest employer, and where it chooses to locate its jobs has huge implications for ridership, revenue, and the local operating subsidy.

We recently detailed why the Federal government’s location decisions matter so much to Metro – and you, the taxpayers who help support WMATA through your local taxes.  We’re always keeping an eye on moves within the region and certainly hopeful that any major moves (whether they are in the public sector or private sector) locate near Metrorail.  That’s because locating near Metrorail increases ridership, increases farebox revenue, and lowers the (your) taxpayer burden to support Metro.

Naturally, the news about GSA’s upcoming decision on the location of the US Citizenship and Immigration Services complex (USCIS) caught our eye and wonkiness.  We wanted to know about how much ridership and revenue the different options might generate.

US-Citizenship-and-Immigration-790x320

Read more…