The new version of the Line Load Application now models passengers into trains by cars. Let’s take a look at this new feature!
Remember in May when we said an updated version of the Line Load Application was coming that would include passenger distribution data at max load locations? Well it’s here now!
If you’ve seen Metro employees with clipboards out during rush hour at major stations, then chances are you’ve seen the Metro load checkers. These individuals mark down the loads of these trains. They also mark down any people who didn’t board. Last but not least, they are also doing this by car, and with that information Metro has been keeping track of the spread of the loads on the cars at the max load stations.
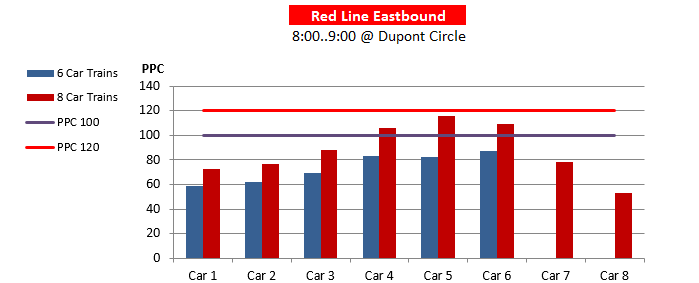
Average Car Loads in the AM Peak Hour – October 2014 Weekdays – Modeled Distribution of Passengers at Dupont Circle **The estimated railcar crowding is based on the scheduled Red Line service.
Read more…
Latest version of Line Load tool will feature modeled car-crowding numbers.
Many factors influence which car number of a Metrorail train a customer rides. Infrequent riders may wait for the train near the escalator and board the nearest rail car. Savvier customers may prefer to ensure they are the first to exit at their destination station or have an shorter walk at a transfer station. Others may board cars based on understanding where seats are more likely to be available. All of this activity can result in uneven loading of Metrorail cars across a given train, with some rail cars crowded and others near empty.
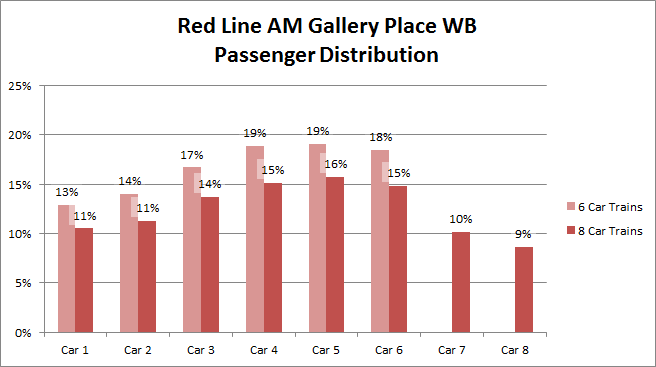
As we mentioned in 2013, the Office of Planning has an in-house tool that allows planners to estimate how crowded trains are based on origin-destination ridership data. Currently we are in the midst of a few updates, which will include the Silver Line that opened last year. Another of the new features that we are excited about is a rail car crowding analysis for the system’s most critical segments. Based on over six months of rail car-crowding data that was collected at selected stations by rail passenger “checkers,” the train-based ridership data will be distributed across the cars so we can estimate what kind of crowding we have by car number, at the peak load points. The following graph illustrates the observed car crowding variations at Gallery Place.
Customers may experience crowded conditions even when the average rail passenger per car (PPC) numbers (PDF) would indicate otherwise. This new feature is an important addition that will help Metro planners better understand the customer experience. The car crowding analysis will begin to identify which cars of a train tend to be crowded in the peak hours, and which are less crowded. This information will the be used as a starting point for devising strategies for better spreading customers across all cars of a train.
How do you choose which rail car you ride in? Other than berthing trains at the center of the platform (see this informative article over at Greater Greater Washington on that topic), what strategies might Metro consider to better balance customers across rail cars?
Our new “Line-Load Application” is expected to provide more accurate reports of system crowding by segment.
We recently finished testing a new version of the Line Load Application, a custom-developed application that distributes the load of passengers across the Metrorail system based on their points of entry and exit. This application allows us to estimate the passenger loads on rail system per segment (rail between stations). It is very important for Metro to be able to track the passengers per car across the rail system, both for peak hours on average weekdays and before and after special events. Because the new system is based on rail schedules, each passenger is assigned to an individual car for the assessment of passengers per car (PPC).
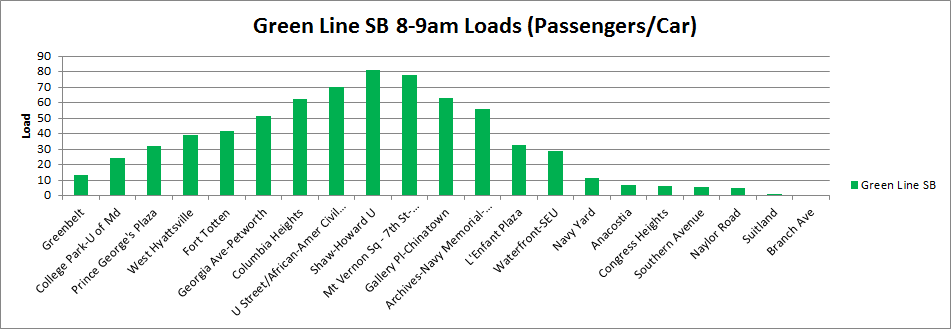
Example of southbound Green Line passenger loads, May 1, 2013, 8am-9am
Our current method of assessing passenger crowding is by stationing rail passenger counting personnel at key stations during peak periods, approximately twice per month per station. Because the inputs to the new application are faregate entry and exit data, this application is providing data like Metro has never seen before, including load factors and passengers per car for all stations at all times of the day.
Upon review, the output data from this tool appears to match expectations of passenger loads at major checkpoints in the system during peak periods with no disruptions. Output from this tool covering non-core checkpoints and non-peak periods will be validated soon.
In the next phase of improvements for this application, we will work to incorporate actual train arrival and departure times as an alternative to using schedules. This will allow us to understand the actual conditions our customers experience during service disruptions or after special events.
The completion of the development of the Line Load application comes at a point in time when Metro is striving to increase safety and relieve the crowding on the rail system, both of which are major topics of our new strategic plan, Momentum.


Recent Comments