A visual of what transit supportive densities look like for different transit modes
Recently, GreaterGreaterWashington blogged about density, using Google maps 3D images to show what different densities look like in Washington, DC. Visuals like these are so important because most people hear “density”, think “Manhattan” and can’t say “no” quickly enough. Last fall, we completed work as part of ConnectGreaterWashington and the Transit Corridor Expansion Guidelines that illustrated the differences in desired employment and/or residential densities within a transit walkshed by each mode.
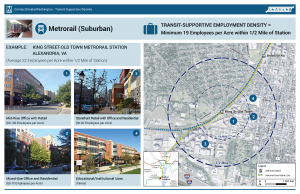
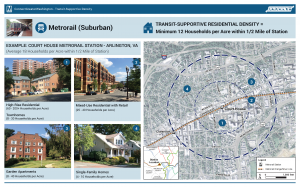
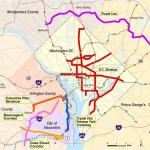
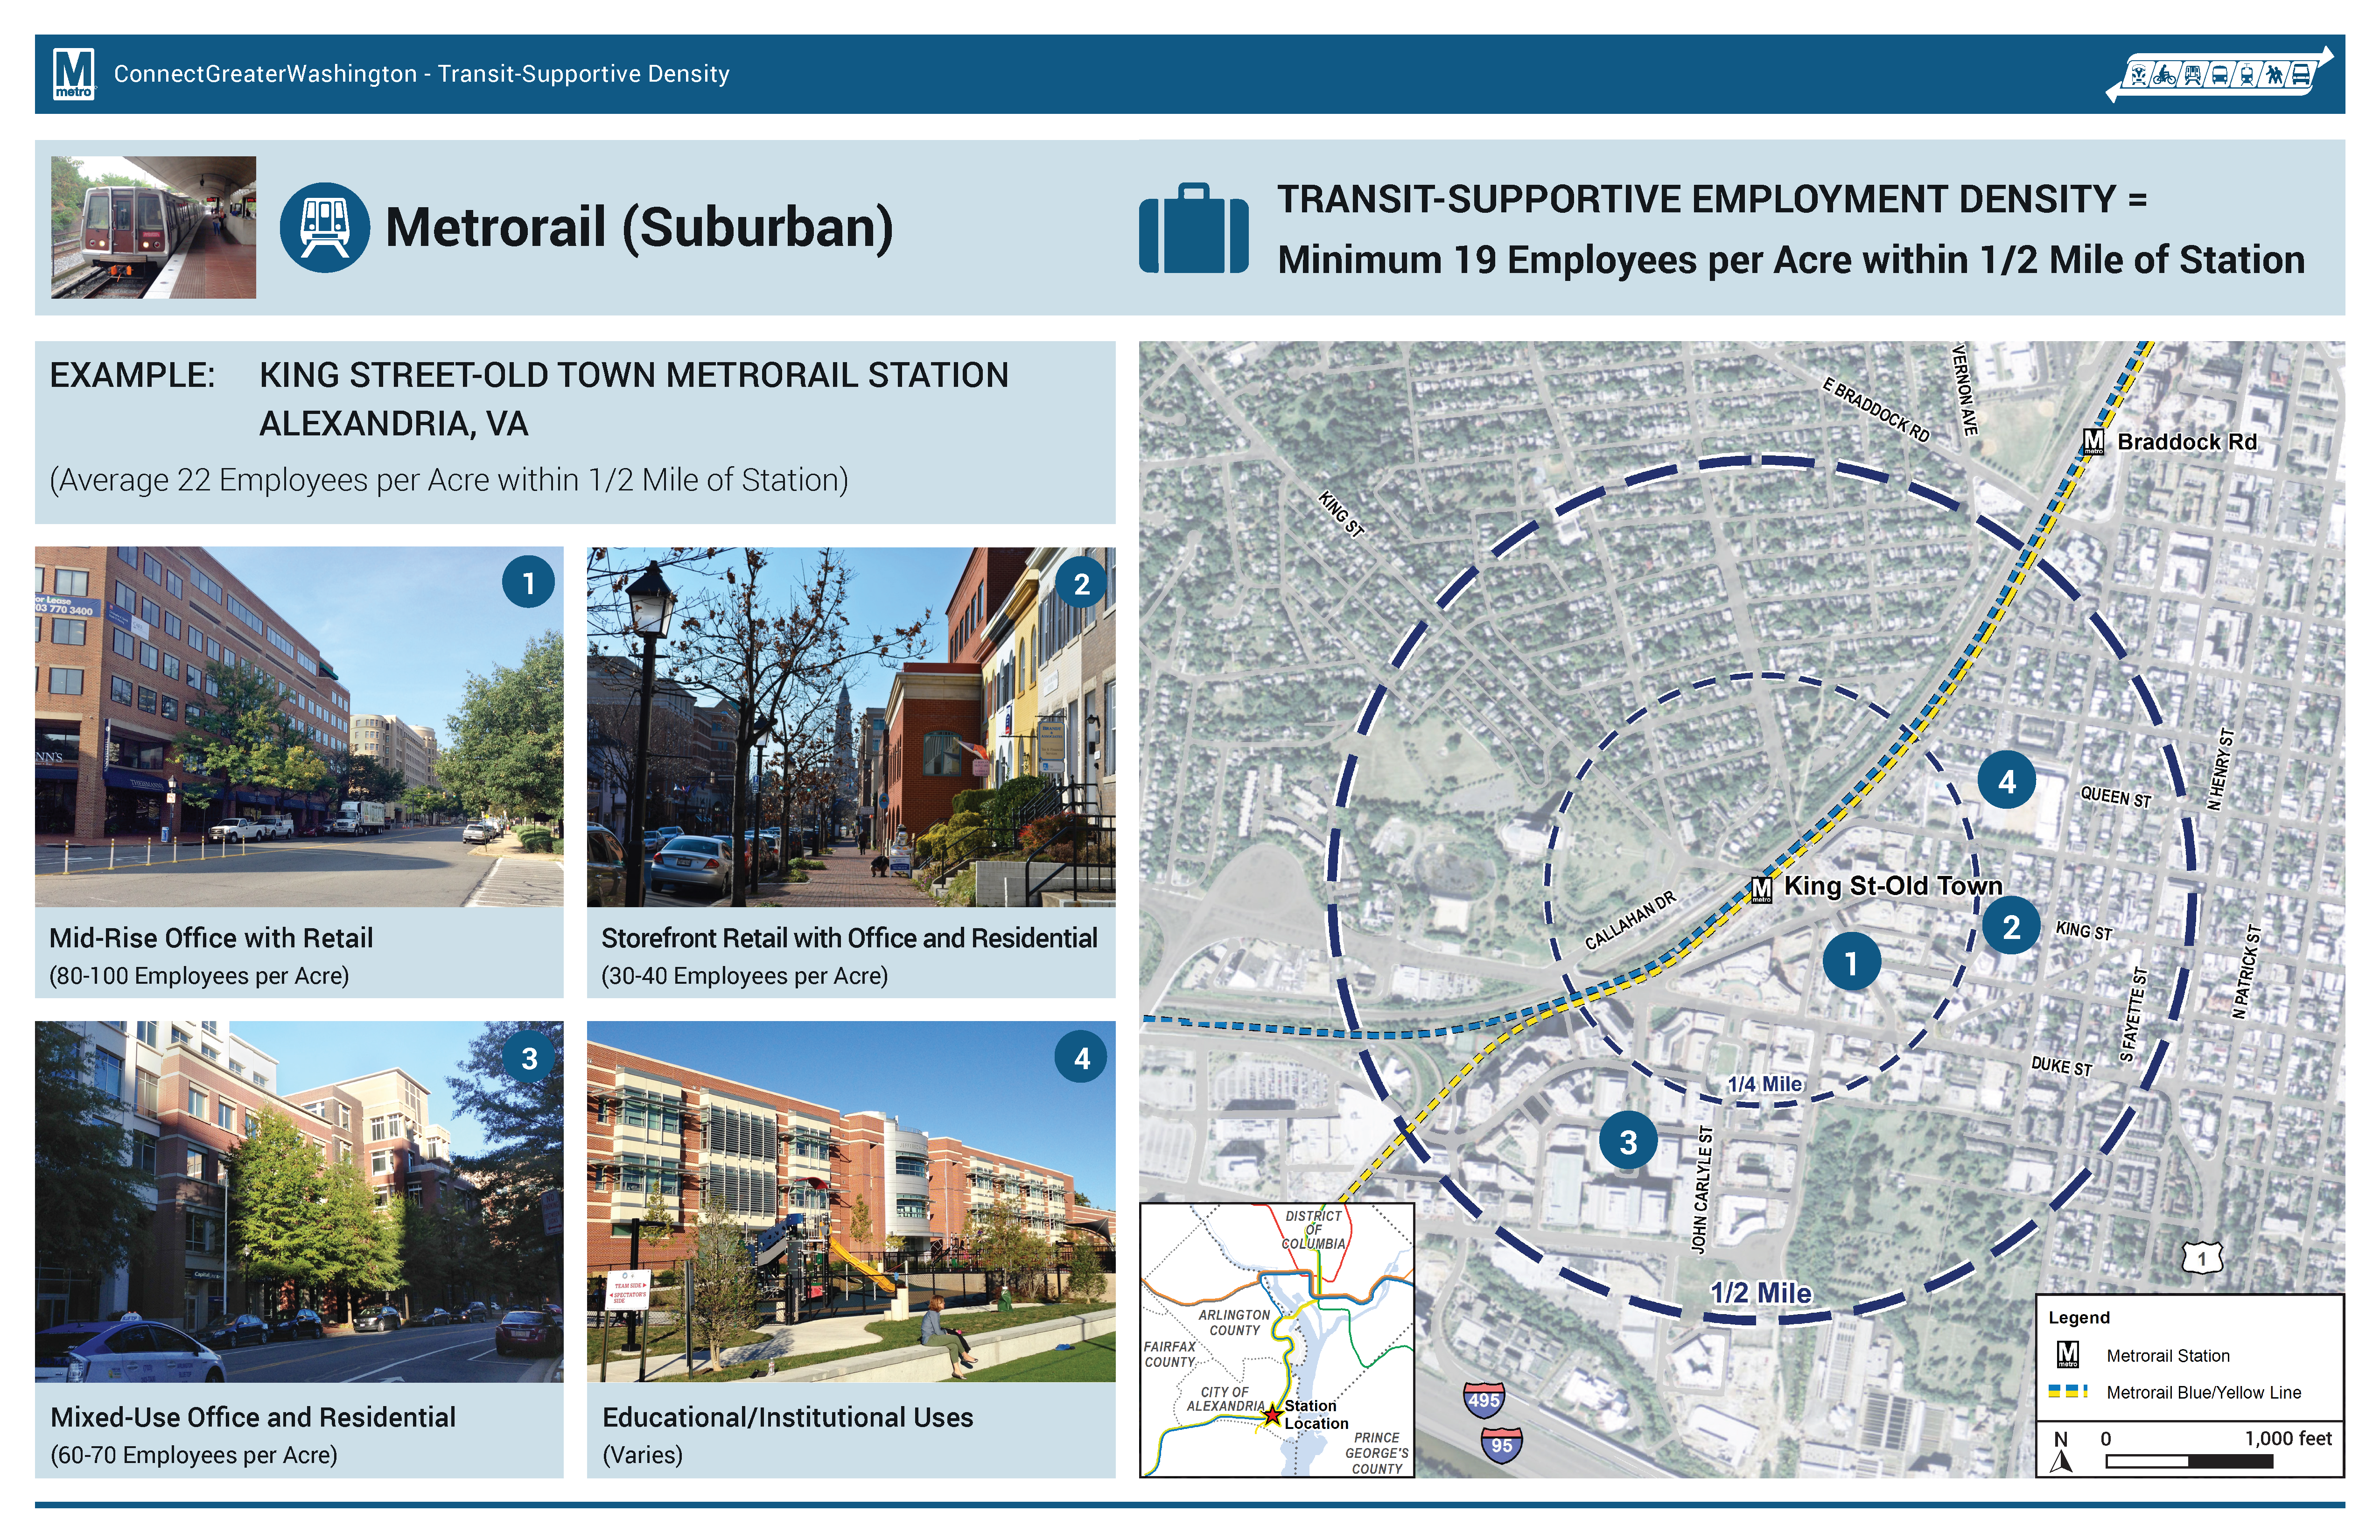
As is typical for planning projects, especially when expanding transit service along new corridors, density is discussed and jobs and/or households per acre targets are tossed around. But most people (full disclosure, that includes me) do not know what 4 households per acre or 150 jobs per acre looks like. It is especially important because a residential target of 12 households per acre within a half-mile of a suburban Metrorail station, for example, does not mean that every residential dwelling needs to meet that target. Instead, within the half-mile radius, the overall density should be 12 or more households per acre. That gives plenty of room to have less dense single family homes (on small lots) and more dense high rise apartments with studios and one-bedrooms.
Below are example stations for each mode and the employment and/or residential density targets, along with images of the different building types that combine to meet or exceed the targets. We’d appreciate your feedback on whether they make sense to you and if they would resonate with the general public.
Metrorail (Suburban) Densities
Note, because of the variability in density across the Metrorail system, we created two types of Metrorail stations to estimate densities.
Read more…
Transit expansion is in demand but Metrorail, light rail, and other high capacity transit projects can be expensive to build, operate and maintain. With limited resources to invest, our region must ensure that these projects serve the most robust transit markets and are supported by strong transit friendly policies.
Informed by our peers and local performance measures, Metro is developing guidelines that the region can use to inform development of high capacity transit projects. As we’ve explored previously, there’s much more to transit expansion than Metrorail. In fact, due to the cost associated with Metrorail expansion along with existing land uses and built environment in much of the region, most of our future high capacity transit projects will be made up of other transit modes. But what is the best way to decide what mode best fits each corridor? The goal of the expansion guidelines is to inform those decisions.

Development in Arlington’s Rosslyn-Ballston Corridor has validated initial and ongoing investments in Metrorail. (source: Arlington County)
A literature and peer review included policy documents from BART (PDF), the Bay Area Metropolitan Transportation Commission, Florida DOT, Virginia DRPT, Federal Transit Administration (PDF), and research from the University of California Transportation Center (UCTC). The review found that ridership, density, the presence of walkable streets and sidewalks, local plans and policies, and cost effectiveness are the most relevant criteria to evaluate transit projects and that rigorous performance targets are needed to support each transit mode. Read more…
Categories: ConnectGreaterWashington Tags: BART, BRT, corridors, DRPT, Light Rail, Metrorail, plans, ridership, Streetcars, tod, transit-oriented development
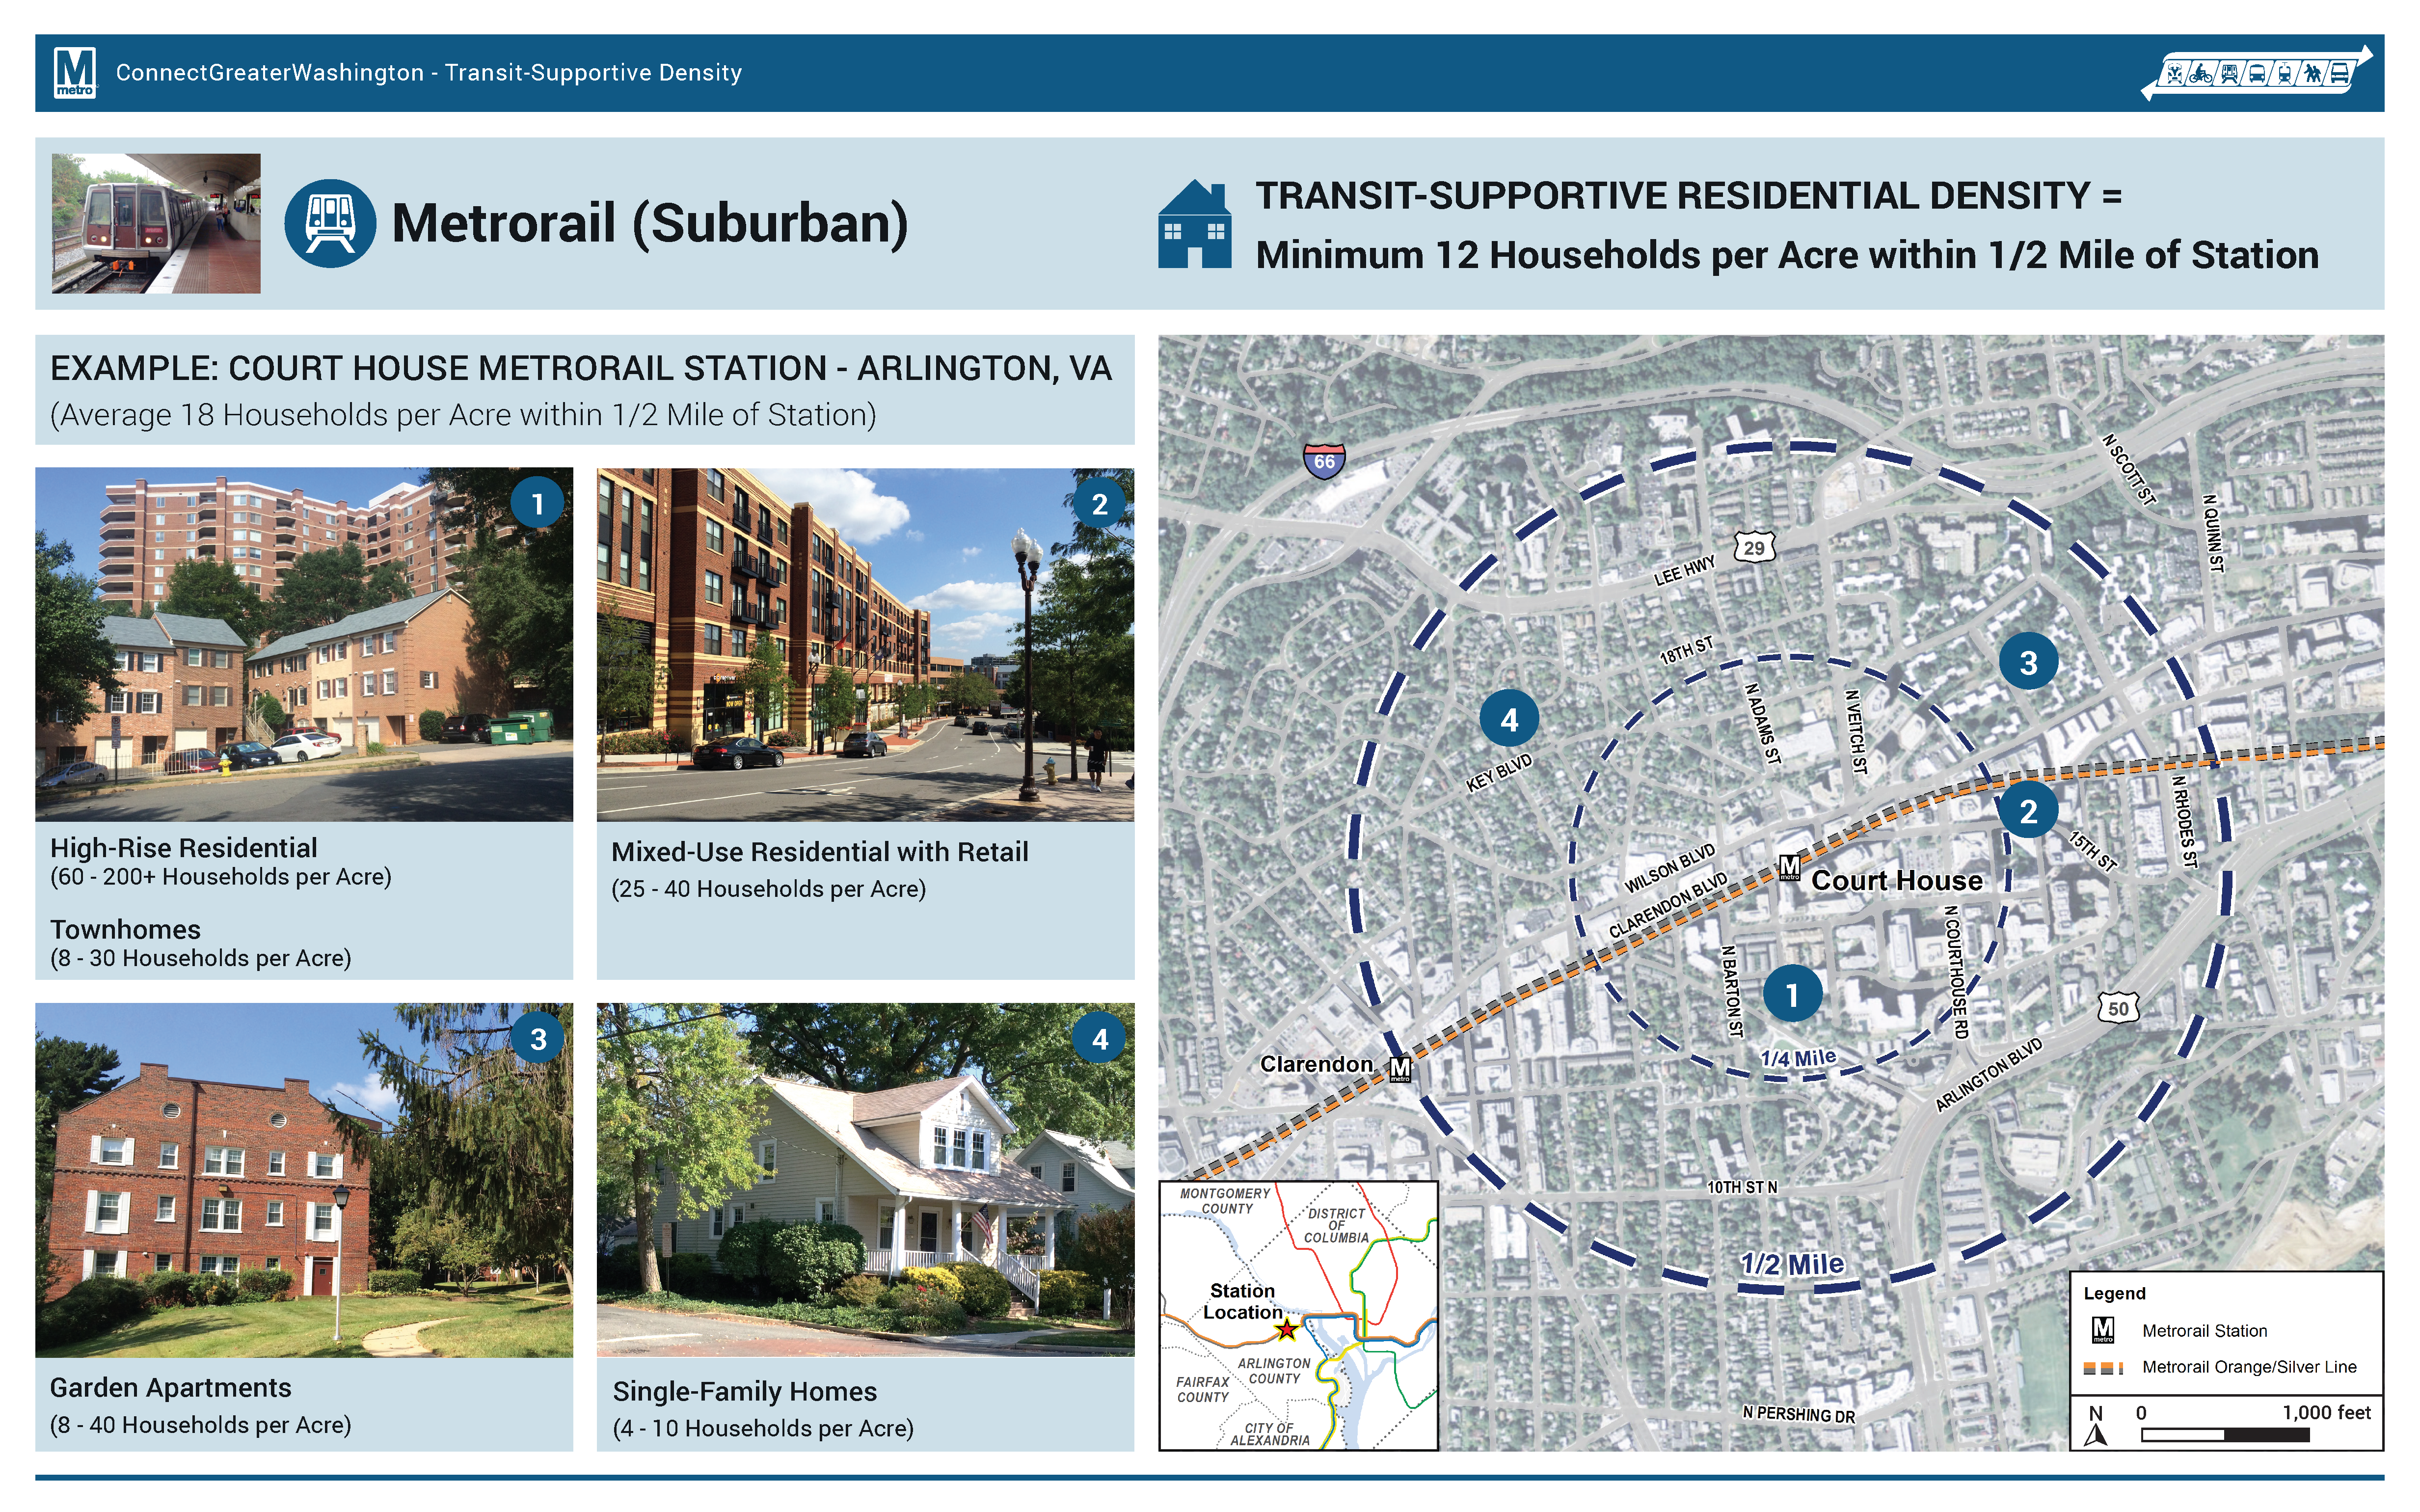
Known to most Americans for its famous wine varieties, Bordeaux is also an innovator in surface transit technologies that allow for wireless tram operations on its downtown streets.
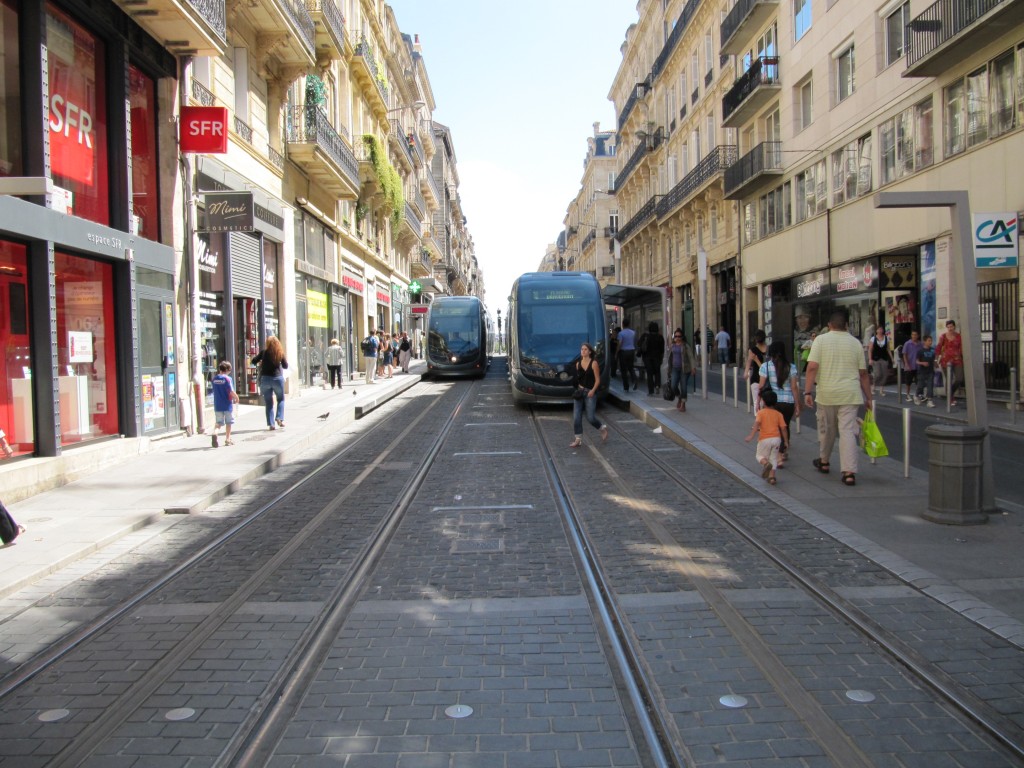
Two wireless trams serve paired center city station platforms
On a visit to Bordeaux in 2010, I drank its fabulous wines, walked along the Garonne, enjoyed its comfortable summer climate… and took note of its innovative trams (light rail/streetcar). You might be thinking “trams… really?” Yes! While most systems are powered by overhead wires, when it opened in 2003 Bordeaux’s system was the only modern example of ground level powered wireless trams in the world. The proprietary APS system allows for typical overhead wire operation in the areas outside the central city and operation with ground-level power (see photo below) inside it in order to preserve unobstructed views in the old city. Although the system initially had reliability problems, it now seems to be performing well.
Read more…
The region either already has or is planning for a variety of different modes. How do they compare? 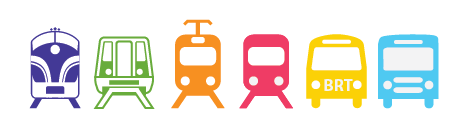 The Silver Line will soon open as a Metrorail line. Later this year, a streetcar will be operating on H Street, NE with others planned for Columbia Pike in Arlington and the District. Arlington and Alexandria are jointly building a bus rapid transit (BRT) line between Crystal City and Potomac Yard. Once funding is finalized, Maryland will build the Purple Line and light rail transit (LRT) will connect New Carrollton and Bethesda. This is all in addition to the region’s existing commuter rail, commuter bus, Metrorail, Metrobus, and MetroExtra services. The region is not only expanding transit services, but it also expanding the types of transit modes that will operate. At long last, instead of talking about Portland (streetcar), Jersey City (light rail), or Cleveland (bus rapid transit), we’ll be able to point directly to services and infrastructure in our backyard or take a trip and experience the pros and cons of these modes for ourselves.
So how do the different modes compare? What kind of purposes does each serve? There are many external factors and trade-offs that influence how agencies and jurisdictions select which mode to implement. As we see from the ongoing debates in jurisdictions across the region between LRT and BRT or streetcar and enhanced bus, there is not always one perfect choice. However, an array of transit and land use measures can provide context to the conversation. As part of ConnectGreaterWashington: The 2040 Regional Transit System Plan, we developed the below table to compare commuter rail, commuter bus, heavy rail, light rail, streetcar, bus rapid transit, and enhanced bus across land use intensity (households and employment), vehicle capacity, stop spacing, trip length, and capital and operating costs.
What do you think? Does this information better inform the rail vs bus debate? What other information would provide more clarity on what modes work where?
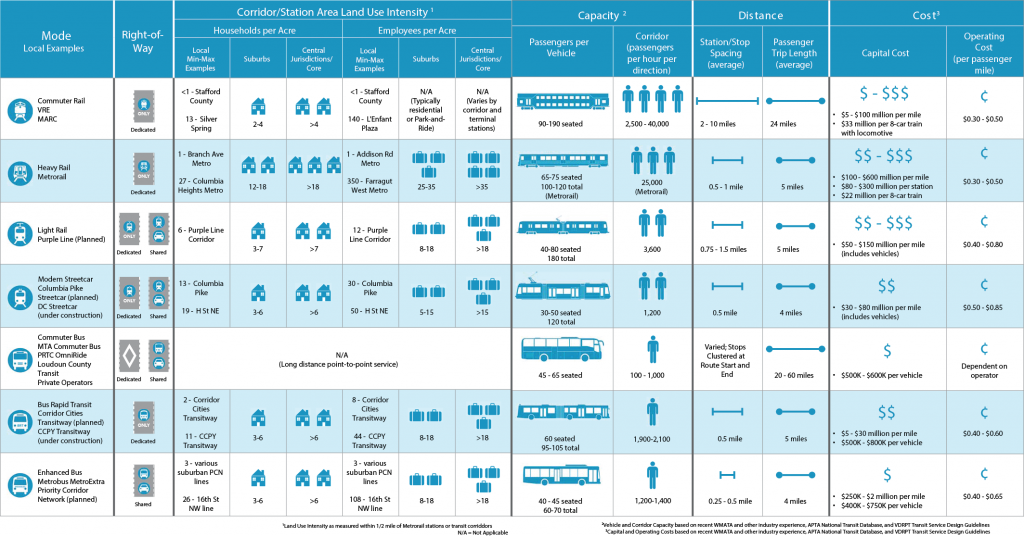
Comparison of High-Capacity Transit Modes
The Los Angeles area is aggressively leveraging billions in local tax dollars to transform the region into a more vibrant place with a variety of transportation options.
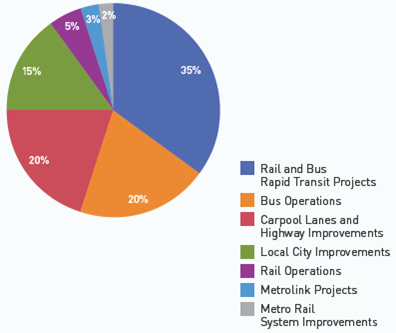
Measure R Spending Breakdown
The conventional wisdom today is that the days of big expensive transportation investments are over. Los Angeles apparently didn’t get the memo. The main transportation planning and development agency in the LA area, the Los Angeles County Metropolitan Transportation Authority (LA Metro), is currently leading the development of the nation’s largest regional transportation expansion program. The program of projects, Measure R, was overwhelmingly approved by more than two-thirds of LA county voters in 2008, and raised the local sales tax one-half cent. The half-cent sales tax is expected to raise $40 billion over 30 years (including an estimated $590 million in 2012) to provide the lion’s share of funding for Measure R transportation projects around the region, helping Angelenos avoid some of the area’s legendary traffic congestion. Not satisfied with the already impressive pace of expansion, LA Metro’s Board of Directors is now exploring a second ballot measure that could come as early as 2016.
Measure R includes an impressive array of transit projects, including the Orange Line Bus Rapid Transit extension, Expo and Regional Connector light rail lines, and the Westside Subway, among others. Below is a map of the transit projects fully or partially funded by Measure R (click on the map below for the interactive version):
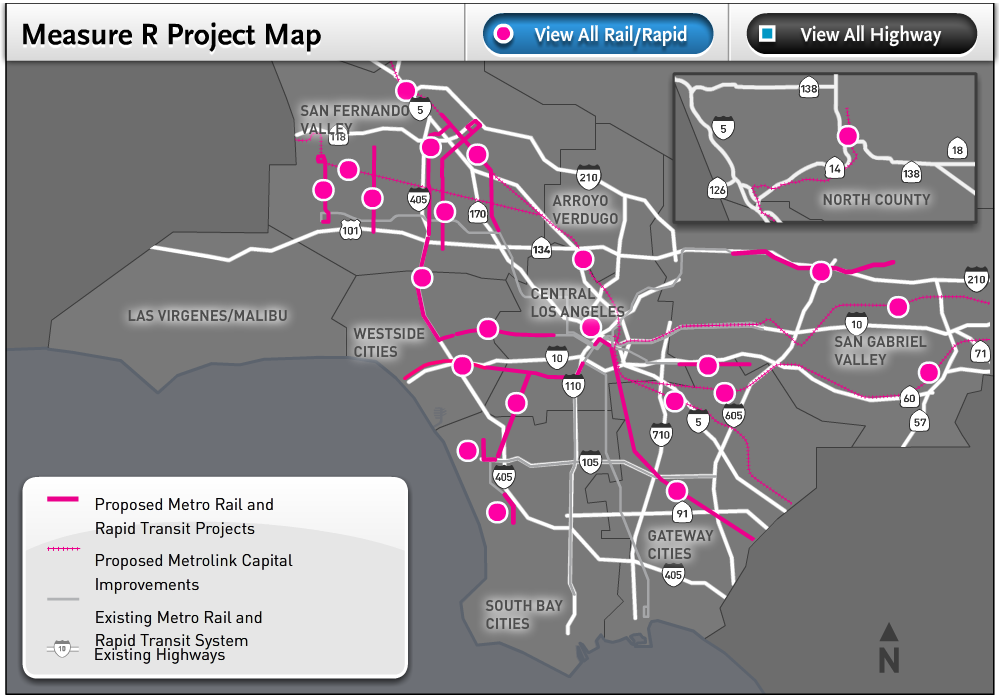
Measure R Transit Map (source: LA Metro)
Read more…
In parallel with the proposed 2040 Metrorail network, we have identified 25 regionally significant corridors that merit high-capacity surface transit by 2040. Depending on the corridor, high-capacity surface transit can be provided more efficiently and effectively by modes other than Metrorail.
The best transit systems in the world are comprised of large networks served by multiple modes. In the National Capital Region, due to the growth and dispersal of activity centers, the high demand placed on Metrorail, and the realities of transit funding, expanding the transit network needs to occur by expanding transit on the region’s roads and highways not just by Metrorail. Metrorail is not and cannot be the best mode for every corridor because the vast majority of corridors do not have the land use, density and ridership to support it.
But don’t despair! There are plenty of other high-capacity modes such as bus rapid transit (BRT), light rail (LRT), streetcar, and enhanced bus that can provide:
- high-frequency;
- all day service;
- large, comfortable vehicles; and
- lower capital and operating costs than Metrorail.
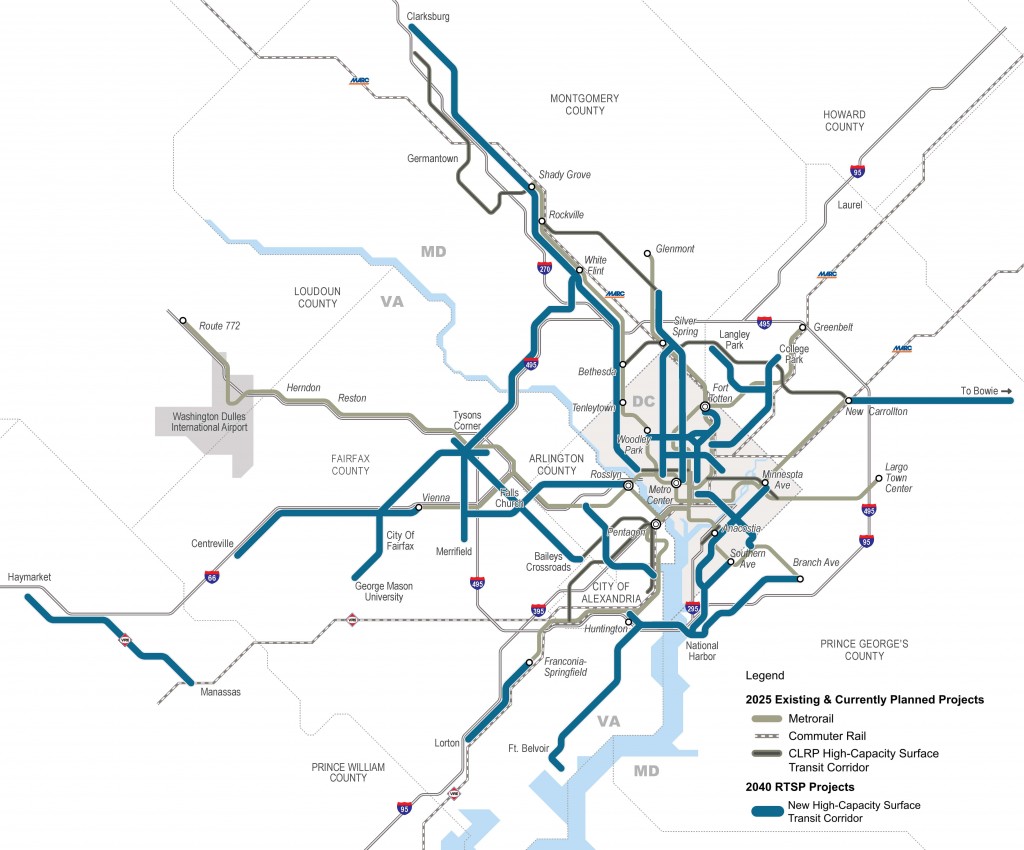
Regionally Significant High-Capacity Surface Transit Corridors as part of 2040 Regional Transit System Plan
Read more…
Categories: Strategies Tags: BRT, bus, capacity, Light Rail, Metrorail, planning, plans, priority, rail, ridership, RTSP, Streetcar, studies, travel patterns
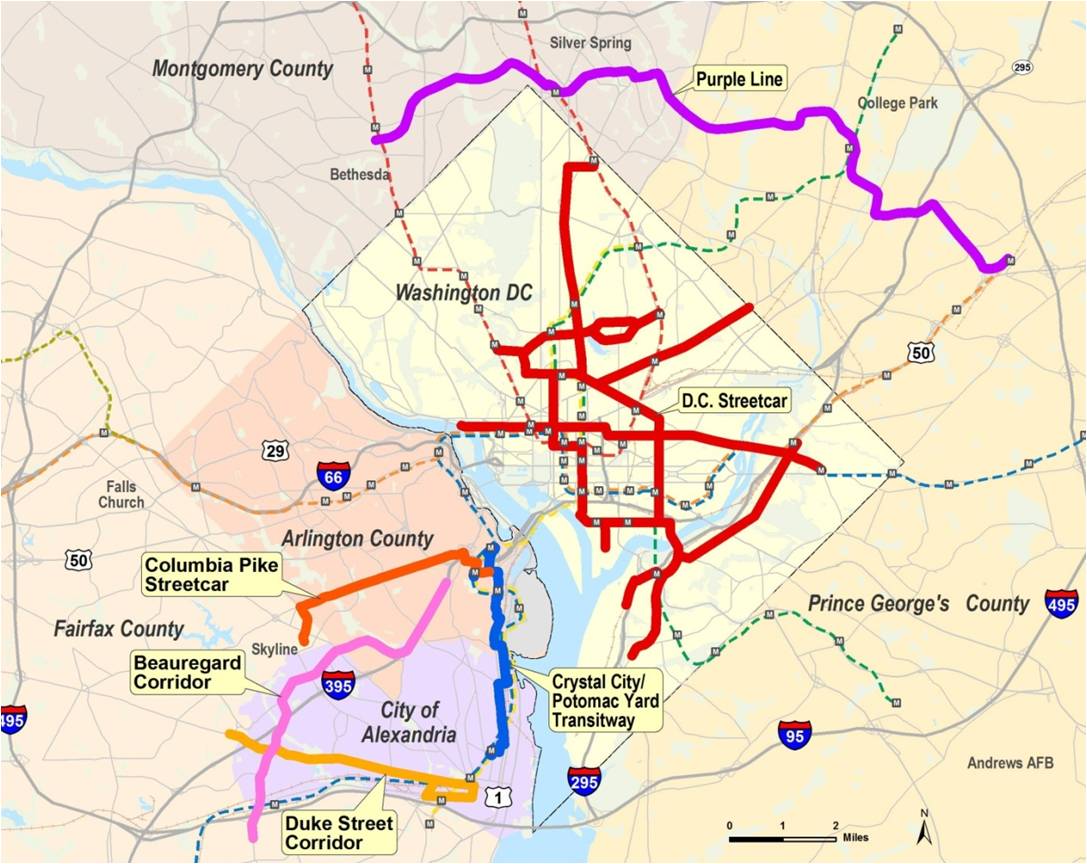
This map shows the corridors being studied by the region for potential light rail, streetcar, or bus rapid transit lines. Click the image for a larger version.
The Washington, DC metropolitan region may be the home of a light rail line and several streetcar lines in the near future according to regional plans. The state of Maryland is in the preliminary engineering phase of the Purple Line, a 16-mile light rail line that is proposed to run between Bethesda in Montgomery County to New Carrollton in Prince George’s County. The District of Columbia has almost completed construction of the H Street-Benning Road streetcar line, with scheduled revenue operation expected to begin later this year, and has also planned an expanded streetcar network. Meanwhile, Arlington and Fairfax Counties have submitted an application for federal Small Starts funding to begin project development for the Columbia Pike Streetcar line, running almost five miles from Pentagon City in Arlington to Bailey’s Crossroads in Fairfax County. Arlington County is also advancing planning for its Crystal City Streetcar project, which would run from Pentagon City, through Crystal City, to the southern Arlington County line in Potomac Yard. (The Crystal City Streetcar project can be considered a follow-up to the Crystal City Transitway project currently under construction.)
Recognizing that Metro isn’t the sponsor or funding agent for these LRT and streetcar systems, and that key decisions made early in the process on the Columbia Pike and H Street streetcar lines have the potential to affect other systems for years to come, Metro has been coordinating with the sponsors since 2010 through the LRT and Streetcar Interoperability Study. A briefing on this study was presented to the Metro Board in early 2011. Read more…


Recent Comments