Posts Tagged ‘land use’

Transit-Oriented Development’s Return on Investment

November 16th, 2015 Comments off

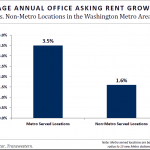
For at least the past decade, the region’s real estate has revolved around transit.  That is expected to continue for the next decade, and we can already see signs of its impact along the Silver Line, according to a new report.

We’ve been highlighting the impact that Metro has on the regional economy for many years now.  From the Regional Benefits of Transit study which highlighted the quarter of a billion dollars in incremental tax revenue that the jurisdictions enjoy each year solely because of Metro, to recent data which highlights that almost all of the development pipeline in the D.C. region is within walking distance of Metrorail, it’s crystal clear that this region’s economic future is inextricably linked to Metro.

Joining the library of compelling evidence of this is recent information from CoStar and Transwestern.  They have been monitoring the development pipeline and activity in the region and have had a special eye trained on the Silver Line.  Here’s what they found: Read more…

Beyond Borders – Acting Regionally to Create a Financially-Sustainable Transit System (Part One)

November 9th, 2015 Comments off

What if taxpayers could avoid spending hundreds of millions of dollars annually on Metro’s operating subsidy? Better yet – what if Metro could pay for itself and have enough left over to fund local transportation projects? What if better using the transit system we already have could help us achieve this?  This isn’t just wishful thinking – it is possible.

Logo_WMATA_CWG_001 black-01(This is the first post in a series of posts that assess applying land use as a transportation strategy)

Recently some of the Washington region’s prominent leaders issued a call to action for this region to cease competing against itself if it is to secure its economic future.  Their courageous statement coincided with findings from WMATA’s Office of Planning that actually put a price tag on that promise.  And it’s a doozy.  In case you missed it, at the Coalition for Smarter Growth‘s Smart Growth Social recently, Shyam Kannan, Metro’s Managing Director of Planning, gave a presentation on the impact of regional cooperation on the region’s finances and specifically, what this could mean for Metro and its ridership, operating subsidy, funding partners, and taxpayers.

What he presented is the second half of ConnectGreaterWashington (CGW).  As a reminder, the first part of CGW was a long range plan that identified infrastructure expansion needs across all transit operators in the region. It assumed that we would grow as the local jurisdictions have estimated in the cooperative forecast. This second part asks a different question.  It challenges us to make do with the transportation system we have already built. Can the region’s growth, rather than necessitate billions of dollars in new infrastructure, be distributed differently to better utilize the roadway and transit systems we already have? What would that mean to the region, its finances, and to Metro’s operating subsidies that its funding partners pay annually?

So the study contemplates, compares, and contrasts two distinct paths.  Grow the way we have been growing and build our way out of congestion.  Or choose to grow around our existing infrastructure and use it to its maximum capacity.  In the coming weeks, we will be posting the detailed analysis here on PlanItMetro. It’s lengthy and wonky, so be prepared for a series of in-depth posts. Read more…

In Case You Missed It – Presentation from Last Week’s Smart Growth Social

October 22nd, 2015 Comments off

We’ve published online the WMATA presentation from last week’s Smart Growth Social.

Last week the Coalition for Smarter Growth held their annual Smart Growth Social. Over 200 people were in attendance that evening and WMATA was honored to have the opportunity to share with the audience a preview of some ground-breaking research the Office of Planning has been conducting into the impact of Smart Growth practices on the region’s finances. On behalf of everyone who works towards a more sustainable and prosperous region, thank you for listening.


We’ve gotten a ton of requests for copies of the presentation, which we have made available online. If you want to get more information on how smarter land use planning can and should be this region’s top transportation strategy, feel free to use the presentation or email us (planning@wmata.com) to stay informed as we release more information on ConnectGreaterWashington later this year.

Ask the Professors – How Local Land Use Decisions Impact Metrorail Ridership

August 24th, 2015 1 comment

This post is guest-written by Chao Liu, Hiro Iseki, and Gerrit Knaap, researchers from University of Maryland’s National Center for Smart Growth, who helped Metro develop our Land Use Ridership Model.

Even though Metro doesn’t control where new jobs and households locate in the region, these decisions are critical to the agency’s ridership and financial future. 

It is well known that the form and intensity of development in and near rail transit station areas can have measurable impacts on transit ridership.  For these reasons, transit oriented developments (TOD) generally feature high-density construction, mixed land uses, and bike and pedestrian friendly infrastructure.  But not all TODs are alike, and the effects of TOD on transit ridership are likely to depend on how well the station is connected both locally and regionally, whether the station is near the center or end of a transit corridor, and what kinds of jobs and household are located nearby.

To explore how different forms of development might impact ridership on the Washington Metrorail system, Dr. Hiroyuki Iseki and Dr. Chao Liu assisted Metro to develop a direct ridership model (DRM), called Metro’s Land Use Ridership Model.  A DRM uses statistical techniques to quantify the relationship between entries and exits at rail stations and land uses nearby.  This model can then be used to estimate the number of passengers who will access the station, by waking or biking, as a result of changes in land use features, transit service characteristics, and socio-demographics within the walkshed of any given station.

The direct ridership model includes a large number of variables for each station, including the density, diversity, and design of local environment; transit service and connectivity; job accessibility by auto and transit; walk score; the availability of parking; the demographics of nearby residents; the number and types of jobs nearby, and more.  The model was estimated for the AM Peak, Midday, PM Peak, and Evening travel periods.  The AM Peak model is best suited for estimating the increase in morning boardings that would result from locating more households near the station; the PM Peak model is best suited for estimating the increase in afternoon boardings that would result from locating more jobs near the station.
Pedicted AM Peak Entries per New HH

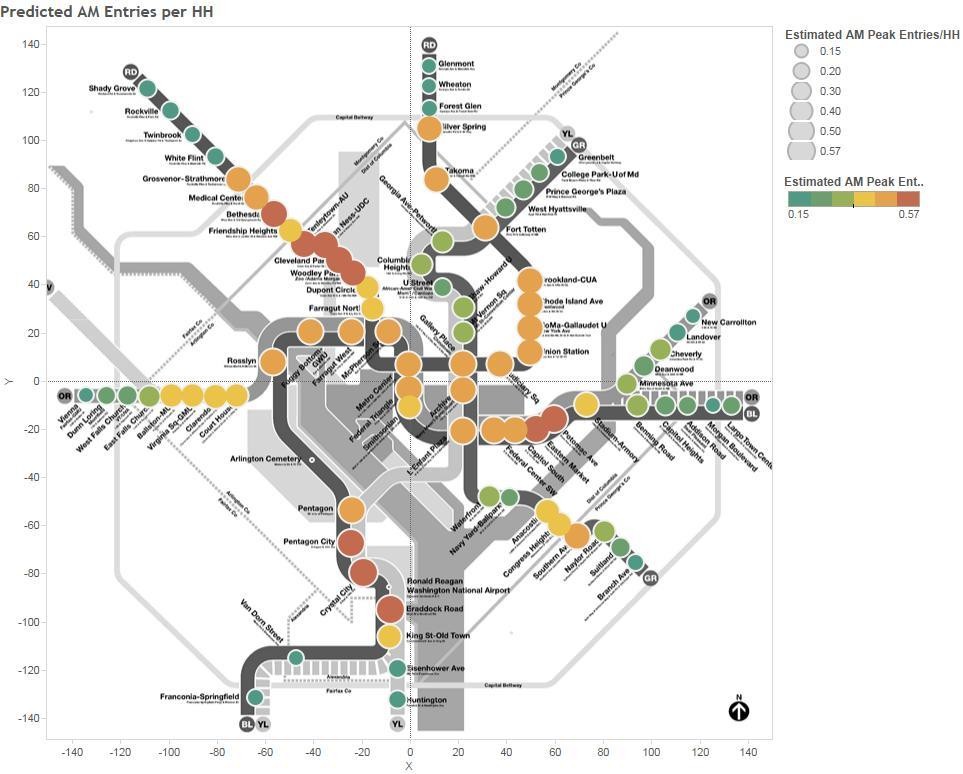
Map 1. Predicted AM Peak Entries per New Household

The impact of adding jobs and households near stations varies by station area.  Map 1 above, for example, shows the estimated entries per new household in the morning peak—that is, how many additional boardings would occur in the AM peak if one additional household was located in the walkshed of the station.  Stations shown by red dots gain more than 0.57 boardings per day, for each new household in the walk shed, while stations shown with green dots gain only about 0.20 boardings per day. As a concrete example, Rhode Island Row is a 274-unit, mixed-use, TOD project built on a WMATA site.  Situated along the busy Red Line, the project has long been considered as a prime location for new housing development.  According to the DRM model, adding 274 new households near the Rhode Island station would increase boardings by 144 passengers in the AM peak.  The same development at the New Carrollton station, however, would have added only 52 passengers.  This is because, compared to New Carrollton, the Rhode Island Avenue station has better job accessibility and more frequent transit service, and is thus likely to stimulate more transit ridership. Read more…
All Aboard! Metro Welcomes New Development Planned at Rhode Island Avenue

July 22nd, 2015 Comments off

A redevelopment project planned for Rhode Island Avenue Metro station, one of the largest such projects in the District, could bring $2.3M per year in new fare revenue for Metrorail.

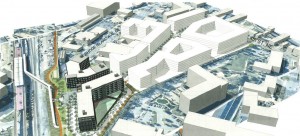
A venture led by MRP Realty is proposing a mega project near the Rhode Island Avenue metro station, which when constructed would add over 1,500 residential units and retail to that transit-oriented community.  That’s fantastic news for the District, which needs household growth to resolve its structural fiscal deficit, and also for Metro and the region, which benefits each time we add transit-oriented development that drives ridership and revenue.

Image Courtesy MRP Realty

Image Courtesy MRP Realty

At Metro we find this especially exciting because it is yet another example of how changes in development are in part fueling a ridership resurgence.  Our Land Use-Ridership model conservatively suggests that this project will yield an additional 3,200 rail entries per day systemwide, generating rail fare revenues of around $2.3 million per year. Whether this ridership actually materializes – or is even higher – depends on the developer building good pedestrian connections to the Metro station and the Met Branch Trail.

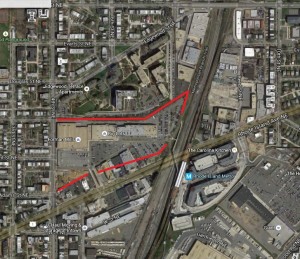
In addition, this project could be a good opportunity to create a pedestrian connection between the station and the neighborhoods to the north, where potential Metrorail riders are blocked from the station’s “walk shed” today.  The current conditions include a challenging combination of grade changes and physical barriers behind the shopping mall, creating pedestrian barriers outlined in red below. The key question will be whether the development will help fix the barrier along the north side of the site, which would only increase the ridership- and revenue-generating potential of this project.

Image Courtesy Google Maps

Pedestrian barriers in red. Image courtesy Google Maps

The property tax benefits of the project all accrue to the District, and the increased revenue to WMATA doesn’t come for free – the system will need to handle the additional passengers and incur additional operating costs and potential wear and tear on the system.  Right now there isn’t a defined mechanism for WMATA to recoup the value of real estate property taxes to fund capital renewal or expansion.  But certainly anything that contributes to the operating health of the transit agency through increased ridership and revenues goes a long way to promoting financial stability for the Authority, as well as lowering the operating subsidy burden it requires to run the system.

Vast Majority of New Office in Region Near Metro

April 22nd, 2015 2 comments

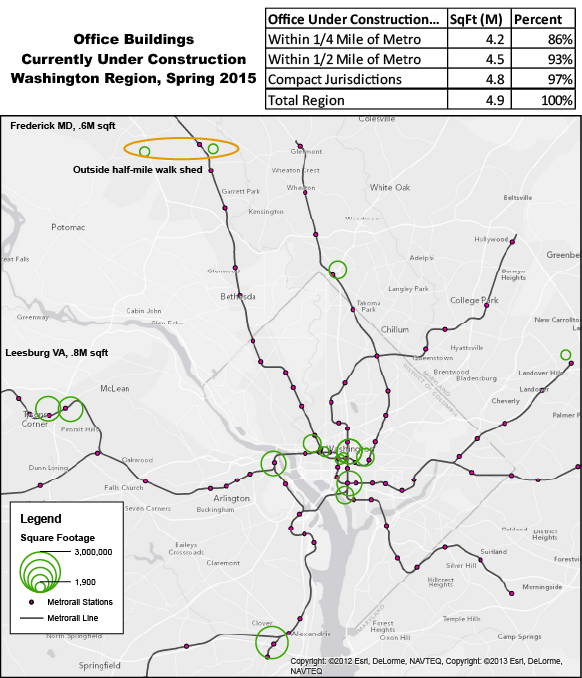
Approximately 86% of the region’s new office construction is occurring within one-quarter mile of Metrorail stations, 93% within the half-mile walk sheds.

A Washington Post article from October 2013 made a staggering assertion:  That 84% of new office construction in the region is occurring within one quarter mile of a Metrorail station, according to Jones Lang LaSalle and other data sources.  As we continue to dig into walk sheds and the land-use/transportation connection, we thought we would revisit this assertion and update it for 2015.

Since the Post article was written, we have begun to plan for near-term capacity constraints that might result from increased ridership caused by new households and jobs near Metro.  And part of this planning is gaining insight as to where and when new housing units and office space may come online through real estate industry data sources.   Through this research, we are able to update the statistic above:

86% of new office construction in the Washington region is occurring within one-quarter mile of a Metrorail station. 

UnderConstructionMap-01

New office currently under construction in the Washington region. All but four projects are within a half-mile of Metrorail.  Data from Jones, Lang, LaSalle.

Read more…

Going Up – Why the Construction Pipeline Means Higher Metrorail Ridership (Part Two)

April 7th, 2015 6 comments

In Part Two of this series, we forecast the impact of the region’s near-term development pipeline on Metrorail ridership, using the Land Use-Ridership model. The good news? Metrorail ridership is set to show big gains. The bad news? Your ride just got less roomy.

Just as we were putting the finishing touches on this post, we saw a flurry of news articles detailing the regional market forces that portend increased rail ridership. Millennials choosing not to drive, even as they grow up.  Office parks in far-flung places experiencing devaluations while Metrorail-adjacent areas capturing the lion’s share of new leases.  Marriott announcing that it will seek a transit-accessible location when it moves.  And even defense contractors coming to bat to argue for the economic benefits of the Purple Line. All of this free publicity set us up nicely for what we wanted to share with you – the first results of the Office of Planning’s Land Use-Ridership model as applied to near-term development projects.

The Near-Term Pipeline. Researchers at Jones Lang LaSalle have been compiling a list of actual development projects – under construction, or planned – near Metrorail stations, so that we can forecast the near-term capital needs for the system. A huge amount of development (over 105 million square feet!) is on the books for within a half-mile of a Metrorail station.

NearTermPipeline_Thumbnail

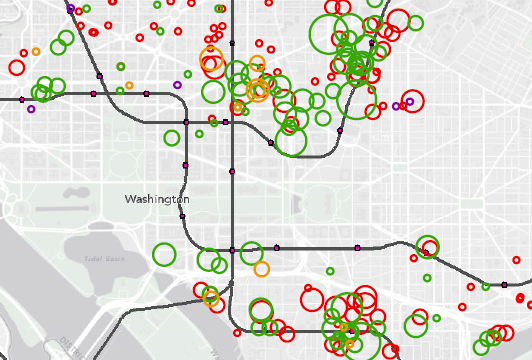
Map of near-term development projects near Metrorail, by building type (click for full image)

So, How Much Ridership? What impact will all of this have on Metrorail? We ran these projects through the Land Use-Ridership model, and what we found was both intuitive – and startling. Read more…

Going Up – Why the Construction Pipeline Means Higher Metrorail Ridership (Part One)

April 6th, 2015 5 comments

We’ve claimed that Transit-Oriented Development (TOD) projects in this region will be critical to Metrorail ridership and sustainability. The good news is that our assertions are grounded in statistically rigorous evaluations of TOD’s impact on Metrorail ridership – here’s how. (Part one of a two-part series).

While factors like fares, service, and the economy can certainly explain some changes in Metrorail ridership, one absolutely fundamental explanation of differences in walk ridership between stations is development.  Why does a station like Landover see only 50 riders arrive on foot each morning, and a station like Crystal City see over 3,000?  Why does a station like Bethesda see balanced ridership in all directions, where a station like Suitland is almost entirely one-direction? Development. Even a simple scatter plot shows that households alone near the station explain 70% of AM Peak walk ridership!

Planning studies have long-posited that transit-oriented development is such a key part of driving ridership, and if that is the case, then TOD is vitally important to Metro’s long-term financial sustainability.  We at Metro needed to quantify this link in a more sophisticated and system-specific way, and so we created a way to calculate the impact of land use changes (household growth, employment growth, new development) on ridership and revenue.

What is a Land Use-Ridership Model? To help, Metro’s Planning Office has built a Land Use-Ridership Model that will predict changes in Metrorail ridership as a result of occupancy changes (growth, decline, new development, etc.) in the station area.  This model helps us get very specific when it comes to modeling the impact of land use changes on ridership and revenue.  It helps us answer questions such as: “When developers build a new apartment building next to a Metrorail station how much ridership and revenue will Metro realize?”, and; “If an office building is proposed at one of four Metrorail stations, which location maximizes ridership and revenue without exacerbating core capacity constraints?”

LURM general flow

This tool is based on a rigorous understanding of the link between land use and the rail ridership we see today and is built on “direct ridership modeling techniques” found in academia.  It also focuses specifically on “walk ridership” (which constitutes 38% and 78% of our AM and PM peak ridership), since rides related to bus transfers, parking, and other access modes are less related to adjacent land uses.

To build this, we analyzed the actual quantity of walkable land uses from each station area, assembled detailed information about land uses and densities in those areas (households, jobs by industry type), and also controlled for other, non-land-use factors that shape ridership – like network accessibility. In all we worked through over 200 independent variables in our modeling and also brought in experts from the University of Maryland’s Center for Smart Growth, professors Hiroyuki Iseki, Ph.D. and Chao Liu, Ph.D., to bring their analytical and statistical firepower to the fray.

How We Built It. We defined the walkable area as a half-mile walk along a road network, so we account for barriers like highways and fences.  The half-mile cutoff is a bit longer than the median actual walk distance reported by our riders in the 2012 Metrorail Passenger Survey. For each station and its walk shed, we tested the following kinds of factors: Read more…

Q&A with Mary Hynes: WMATA and Arlington County Board Member

October 21st, 2013 Comments off

Picture1

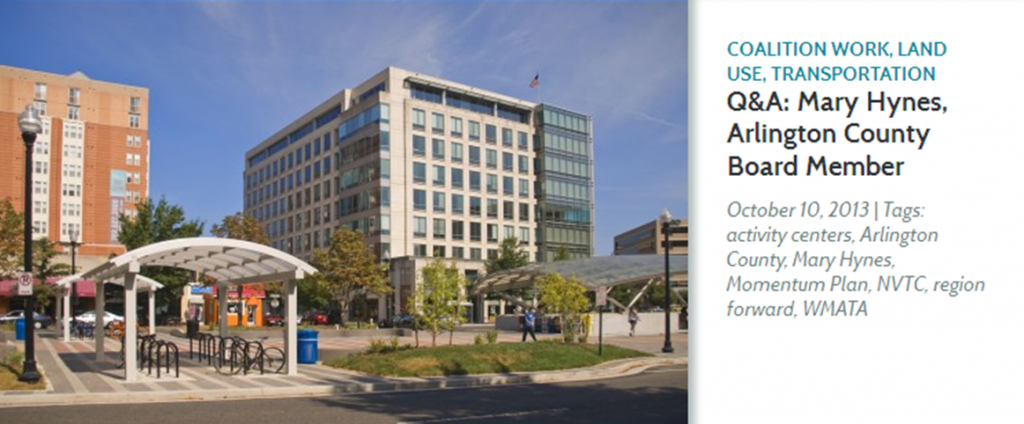
Mary Hynes, a Metro Board Member, sat down with the Region Forward team to answer a few questions about the region’s biggest challenges, how Metro can help the region meet the goals in Region Forward, and how citizens can get involved. In addition to her role at Metro, Ms. Hynes is an Arlington County Board Member and the Chair of the Council of Governments’ Region Forward Coalition, the public-private group leading the effort to implement COG’s vision for the region’s future.

Q: What do you think are the regions biggest challenges?

Mary Hynes: “The economy is a big challenge. We are still figuring out ‘the new normal’ with the federal government. The issues of housing and how people move efficiently around the region are also critical. It’s critical that we understand how housing and multimodal transportation options fit into the bigger picture of achieving a thriving region built of individual vibrant communities – one that is also attuned and committed to meeting the social equity requirements of our diverse, sustainable region.”

Q: How does Metro help us meet our Region Forward goals?

Mary Hynes: “The Metro Board made a decision when considering how to frame its new strategic plan to key off of Region Forward. We – my colleagues on the Metro Board and Metro’s professional staff – looked at what regional leaders had done with Region Forward—the goals they had set—and said “Metro can be the catalyst that enhances regional mobility and convenes stakeholders to ensure a successful, integrated regional multi-modal system”. We worked with the Transportation Planning Board at COG to make sure Momentum and the TPB’s Priorities Plan are aligned.  It wasn’t hard because, in fact, there is regional consensus on the next set of transportation moves the region needs to make.

It’s an exciting time to be participating with COG and Metro. It’s a remarkable moment because people share the same vision. Leaders across the region have learned the same lessons. So the time is right!  Just as regional leaders did 50 years ago when planning Metro, we all must lock our arms, commit to a funding plan, and move forward together.”

Read the full interview!

Take a Tour of Vancouver via the SkyTrain – Then and Now

July 29th, 2013 1 comment

This video of the Vancouver SkyTrain (Expo Line), then (1986, in time for Expo 86) and now (2012), was making the transit news rounds.

We thought we’d share it, because it reminded us of Arlington, and the growth that’s occurred since the Orange Line opened there in the late 1970s. If the Orange Line was above ground, then someone could’ve made a similar video! In the meantime we’ll have to stick to pictures to compare how the landscape has changed since the introduction of the Orange Line. High rises sprouting up and general development with the addition of rail is the common theme here.

Enjoy the ride!


Categories: In The News Tags: , ,