NPR’s Morning Edition yesterday highlighted Arlington County‘s success in tackling commuting challenges, particularly as a result of the decision to bring Metrorail and transit-oriented development to the Rosslyn-Ballston corridor.
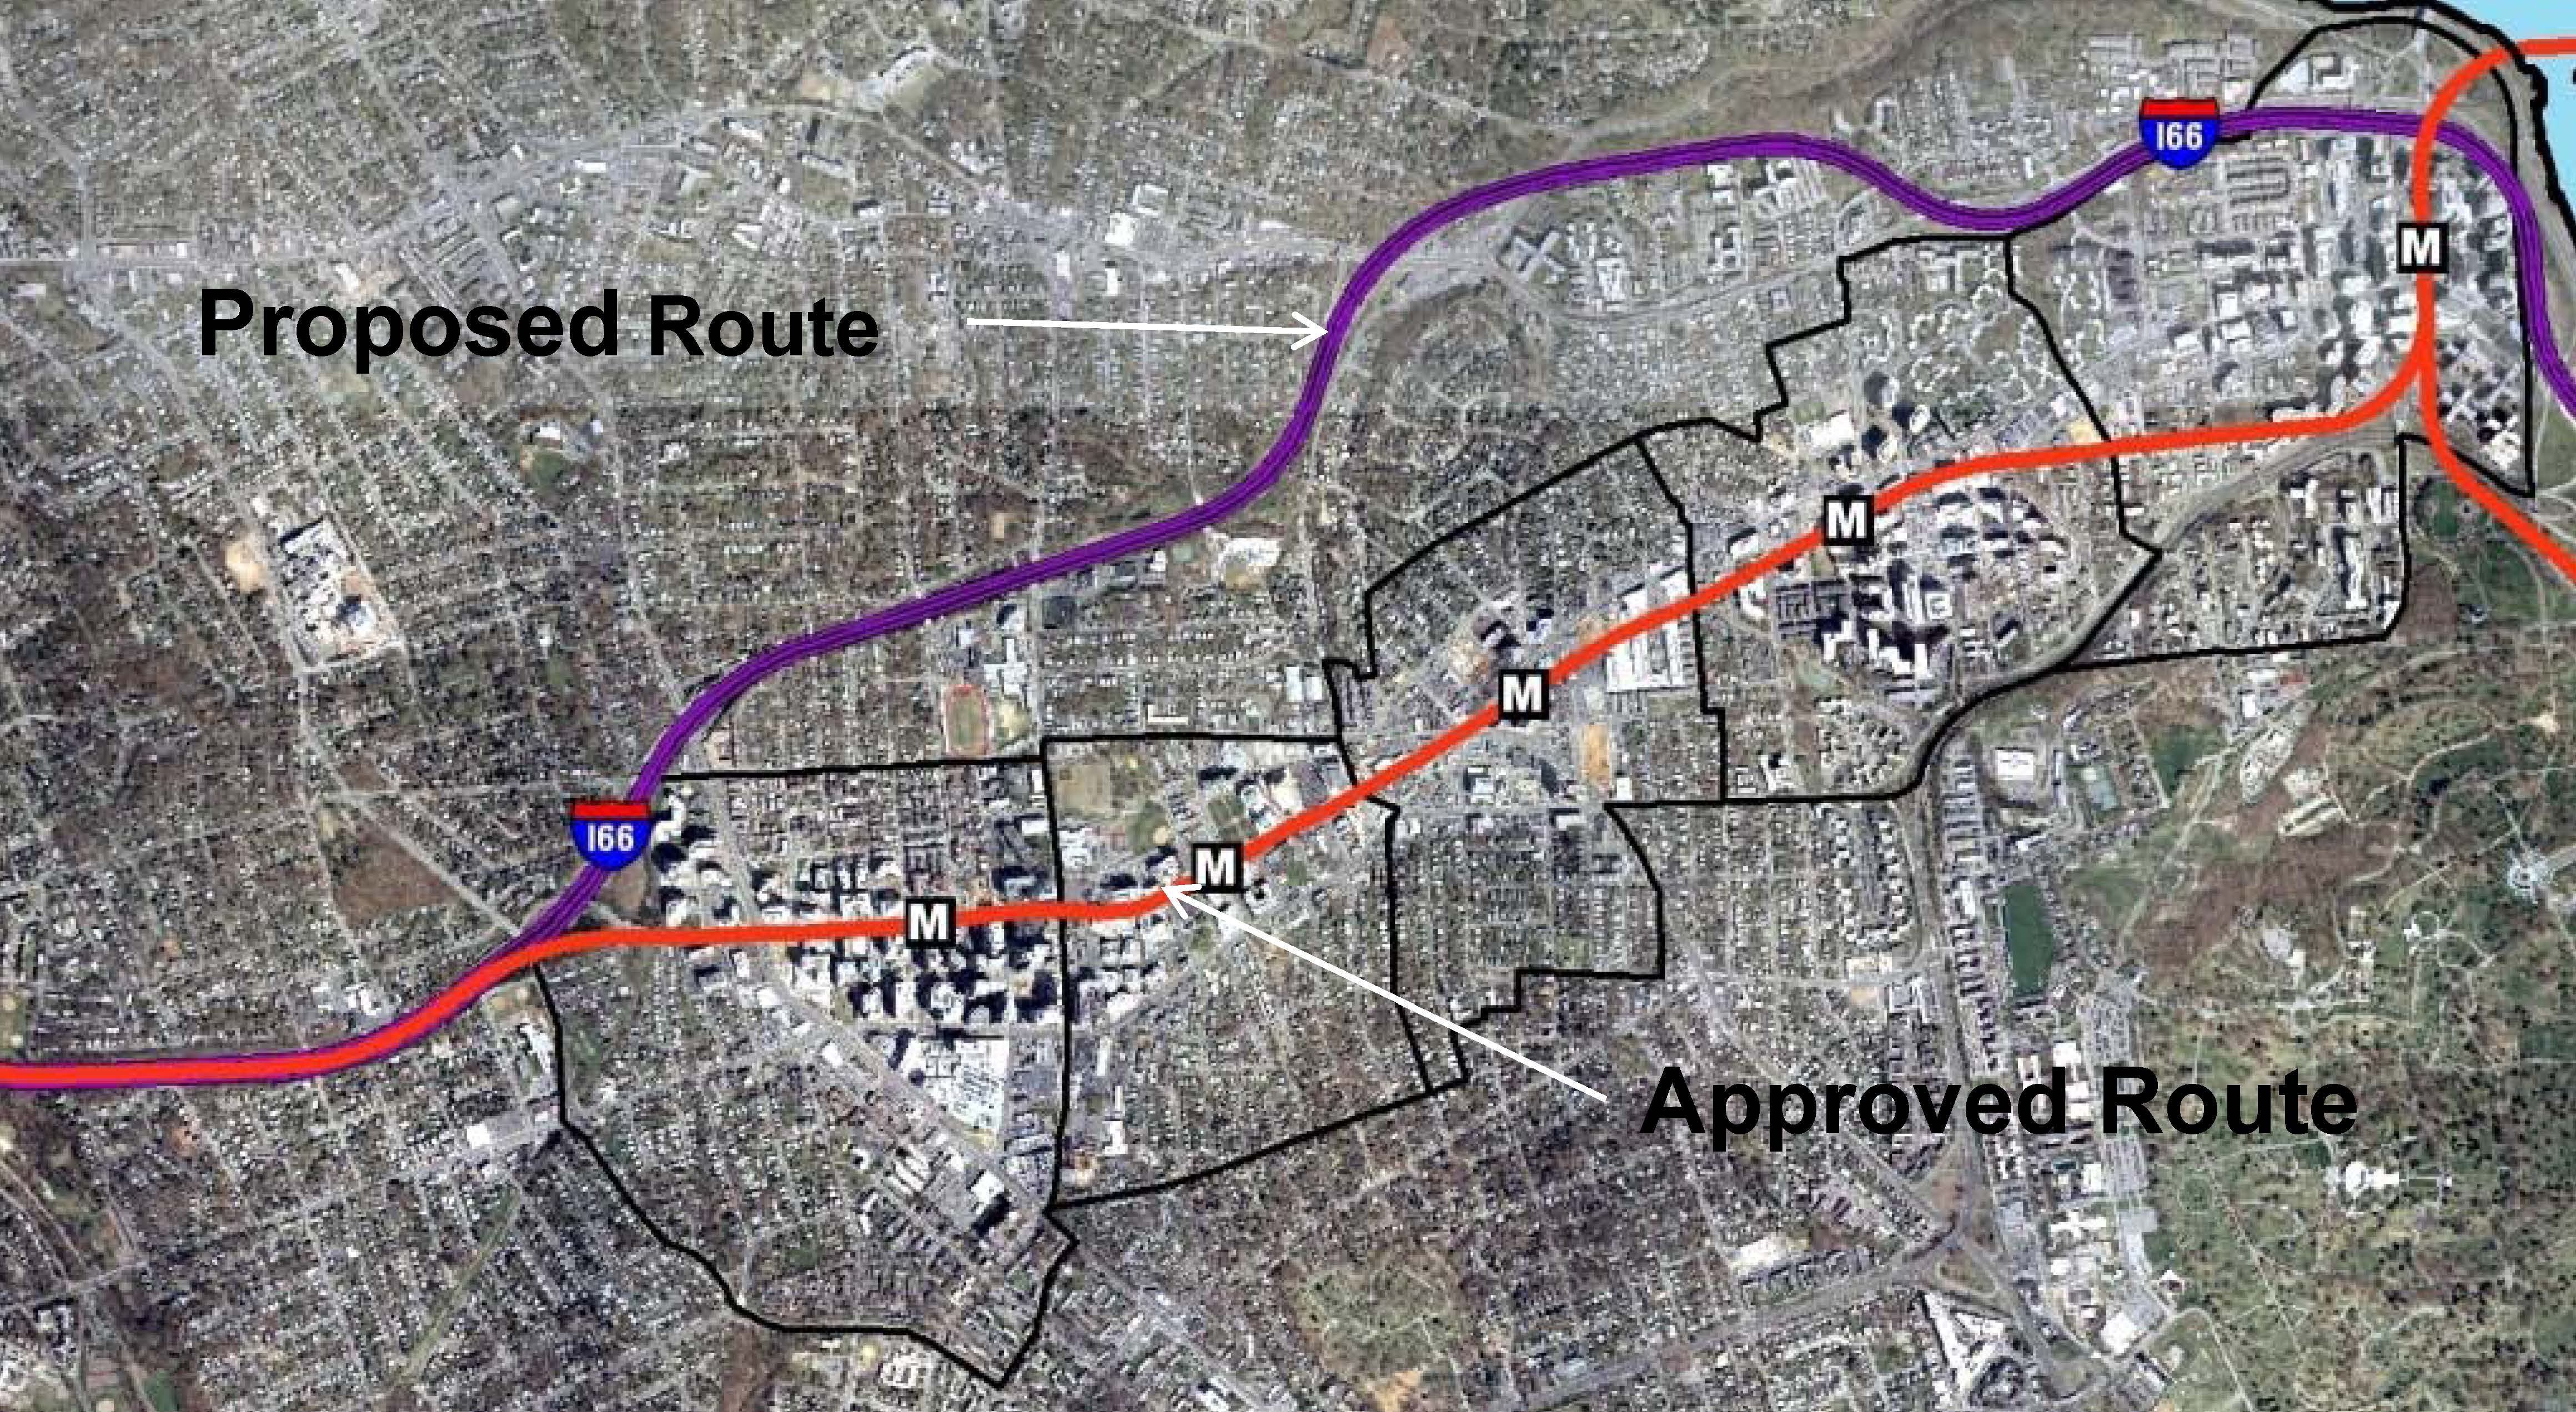
When the Metrorail system was initially designed in the early 1960s, the plan proposed running the Orange Line in the median of what would ultimately become Interstate 66. Arlington County officials lobbied hard and put forward county funds to bring the Orange Line to its existing home, under Wilson Boulevard. They foresaw the benefits of high capacity transit IN the neighborhoods, as opposed to adjacent to the neighborhoods. They also set forth zoning, planning, and other policies to ensure that the county would maximize the benefits from that decision. The NPR story talks about the results of those decisions, the shift from a post-World War II auto-dependent suburb to a vibrant, mixed-use community that has become the gold standard for many cities across the world.
Orange Line – Proposed and Actual Alignments
For more background on the history, growth, and experience with transit-oriented development in the corridor, check out this powerpoint from the Arlington County Department of Community Planning, Housing and Development. Not only does it provide additional information, it has some terrific before and after photos of the different Arlington neighborhoods and how they have changed. Parkington, anyone?
If you’d like to contribute to the NPR series, you can share your commuting experience with Morning Edition – #NPRcommute.
Yesterday’s NPR story was the first in a multi-part series on how communities are tackling commuting challenges.
In 1967, the federal government passed a bill to create the Washington Metropolitan Area Transit Authority (Metro). The interstate Compact was signed by the District of Columbia, the Commonwealth of Virginia, and the State of Maryland. Metro continues to be chartered by this interstate Compact. Among all transit providers in the Washington region – which number more than 15 – Metro is unique in that it serves both states and the District. It provides the only truly regional transit network.
In the late 1970s, Metro trains carried just over 100,000 passengers a day and served hundreds of thousands of passengers on the bus system. Since then, most rail stations in the core of the system have seen ridership more than double. As depicted below, rail average weekday ridership system-wide has gone from just over 500,000 in 1990 to almost 750,000 today, or 220 million trips annually, while weekday bus ridership has stayed at a stable level of roughly 450,000 daily trips, or 134 million trips annually. Read more…
You’ve been diligently telling us what you think our priorities should be and we’ve listened. We’ve been hard at work putting the final touches on Momentum: The Next Generation of Metro and Metro’s Board endorsed the plan today.
Starting Monday, over the following 40 weekdays, we’ll be rolling out the most interesting parts of the plan in daily posts here on PlanItMetro.
Monday Posts: Preparing for Tomorrow’s Region Today
Tuesday Posts: Metro’s Importance to the Region
Wednesday Posts: Metro’s Recent Accomplishments and Public Engagement
Thursday Posts: Strategies and Priority Actions to Make this Vision a Reality
Friday Posts: Metro 2025 – Seven Priority Capital Initiatives
If you want to read and download either the full Momentum plan or the Executive Summary, go right ahead. But if you want to stop back for a daily dose of Momentum, don’t be shy. If you notice something that strikes your fancy, leave us a comment.
Regional support is important to making Momentum a reality! A number of regional stakeholders have already endorsed Momentum. Please sign on and add your name to endorse Momentum and send the message that public transit is vital to the National Capital Region.
We were made aware of this video entitled, “Metro: Here and Now.” Take a look:
The video contains footage on the initial operating segment of the Metrorail Red Line from Rhode Island Avenue-Brentwood to Farragut North, with a strip map including Dupont Circle as well as several shots of Metro Center. So we can surmise that Given some of the points made in the comments, the video probably dates from 1976 sometime in the period from 1975 – 1977, around the time that first rail segment opened in 1976. Aside from the interesting clothing and hairstyles of the time, one of the things that stands out is the operation of 2-car trains. This is difficult to imagine today, when 6-car and 8-car trains are the norm during all operating periods, and plans are being developed as a part of Metro’s Momentum Plan to operate 100% 8-car trains during peak periods.
Another interesting feature of the video is the landscape surrounding some of the stations. While the properties near Judiciary Square, with the DC courthouses, the National Building Museum, and Metro’s Jackson Graham Building appear mostly unchanged today, other station areas look different. At 8:44 in the video, you can see a train pulling into the (temporary) terminal station at Rhode Island Avenue. At 8:50, you can see the surface parking lots to the east of the line where a recently built joint development project now sits.
Data recently released by the Census Bureau show that more commuters are using public transportation than ten years ago, and that transit use has been growing faster than the workforce. Transit’s share of commuters rose from 14.6% in 2000 to 19.4% in 2011. The growth can be chalked up to all transit operators in the region, and it is an encouraging sign that transit’s role supporting the economy has been increasing. Nearly all jurisdictions in WMATA’s Compact area experienced a growth in public transportation usage.
Public transit's share of commuting has grown in the last decade across nearly all jurisdictions in the WMATA Compact area, the latest Census data show.
Transit’s growth in the region highlights the need for us, our partners, and the public to start talking strategically about Metro’s future. Not only are more people taking transit, but more people are choosing to make the Washington region their workplace and home. How can Metro best accommodate growing ridership? Join the online conversation at Momentum to express your thoughts on these and other questions. Over the next few months we will post questions, conduct polls, and ask you to prioritize various elements of the plan. Your input matters, and we’re listening.
In the coming months, we’ll be releasing what we learned about our rail ridership through the 2012 Metrorail Ridership Survey.These findings from the Census will help put the survey results in context.
The table below shows the change in number of workers for whom means of transportation work is determined, and their transit mode share, between the 2000 Census and 2011 1-Year American Community Survey.
Number of Workers (for whom mode is known)
Transit Commute Share
2000
2011
2000
2011
District of Columbia
260,884
306,801
33.2%
39.6%
Montgomery County
455,331
516,545
12.6%
15.8%
Prince George’s County
397,403
446,551
11.9%
19.5%
Arlington County
116,046
139,722
23.3%
28.4%
Alexandria City
77,190
89,831
16.4%
18.2%
Fairfax County
527,464
580,430
7.3%
9.9%
Fairfax City*
11,845
12,106
7.6%
9.0%
Falls Church City*
5,853
5,667
15.9%
15.8%
TOTAL – WMATA Compact Jurisdictions
1,852,016
2,097,653
14.6%
19.4%
These numbers describe commuters’ “primary” mode of transportation to work. The American Community Survey figures are estimates based on sampling, and are accompanied by statistical margins of error (not shown here).
* Note: For sampling size reasons, the American Community Survey does not publish 1-year statistics for Falls Church City and Fairfax City. This post shows 5-year 2005-2009 ACS statistics for those two jurisdictions.
In 1997, the WMATA Board of Directors appointed the Regional Mobility Panel. Made up of members from regional governments as well as business, labor and citizen leaders, the panel was charged with reducing costs and increasing integration of the region’s bus services. In addition to publishing Principles for Coordinated Bus Service in the Washington Metropolitan Area, the panel also identified the need for service planning processes and procedures. The panel recommended service criteria be developed to allow evaluation of regional bus service provided by WMATA. (Regional routes cross jurisdictional lines and are subsidized by all compact jurisdictions.) In consultation with the local jurisdictions the following criteria were developed and integrated into Metrobus Service Adjustment Policies, adopted by the WMATA Board of Directors in February, 2000.
While the criteria were established to evaluate productivity of regional routes, Metro also evaluates non-regional routes the same way. However, routes of a given service type (regional vs. non-regional) are evaluated against average performance criteria of only its own service type. These critical values are calculated annually based on past years’ performance.
In 1967, the Washington Metropolitan Area Transit Authority was created under a 1966 interstate compact encompassing the District of Columbia and portions of the State of Maryland and Commonwealth of Virginia, for the purpose of planning, financing, constructing, and operating a comprehensive mass transit system for the Washington Metropolitan Region. According to Article VI of the Compact the Board shall develop and adopt, and may from time to time review and revise, a mass transit plan for the immediate and long-range needs of the compact region.
An early plan of the Metrorail system, from the online exhibit, Building the Washington Metro.
The Compact guided the development of the original Adopted Regional System (ARS) in 1968, designed to serve the region as forecast for 1990. Zachary M. Schrag, author of The Great Society Subway, hosts a website including maps and photos of the ARS, as well as an historical account of the building of Metrorail. As planning and engineering continued over the next 20-plus years, the ARS was reviewed and revised, consistent with the Compact. By the mid-1990s, planning had been completed for the ARS. Metro began to look at transit needs beyond those for which the original system had been planned, and to look at a much larger region, as forecast for 2025. Metro’s latest long-range system plan — the Transit Service Expansion Plan— was adopted in 1999.


Recent Comments