Posts Tagged ‘crowding’

Rail Car Crowding and SafeTrack – Potential Customer Impacts Analysis Released

June 13th, 2016 1 comment

We have developed a customer impact analysis that shows how and where customers may be impacted in the SafeTrack safety surges, to help guide regional partners plan mitigation and alternatives

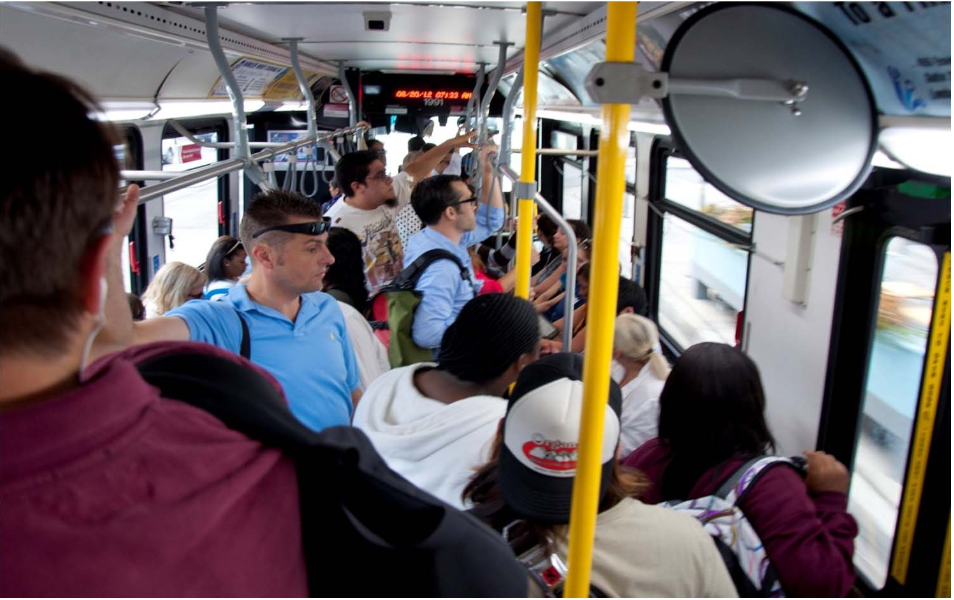
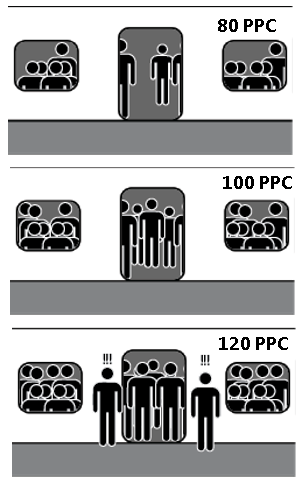
you_down_with_PPCThe first SafeTrack project began on June 4, meaning that Monday, June 6th, was the first day with peak-period service disruptions.  This first safety surge is to accommodate the track improvement project planned for the Orange and Silver lines between East Falls Church and Ballston.  With only one track available for revenue service, we are cutting back to just over 3 trains per hour on each line through the work zone.  When service levels decrease without a decrease in demand, we see an increase in passenger loading on rail cars.  We measure that with a metric called passengers per car, or PPC.

Our rail cars are designed to comfortably transport around 100 passengers each, with most sitting and a few customers standing.  After special events (or any given weekday on some lines) we often find rail cars with much higher passenger loads. From a planning perspective, an average PPC of greater than 120 is considered crowded.  Also, we know that customers don’t evenly distribute themselves across rail cars, so an average PPC of 120 means some cars are much more crowded. Read more…

Categories: Engage Tags: , , , ,

Monitoring Passengers Loads on Metrorail – Using New Tools to Examine the Data

January 5th, 2016 8 comments

The new version of the Line Load Application now models passengers into trains by cars. Let’s take a look at this new feature!

Remember in May when we said an updated version of the Line Load Application was coming that would include passenger distribution data at max load locations? Well it’s here now!

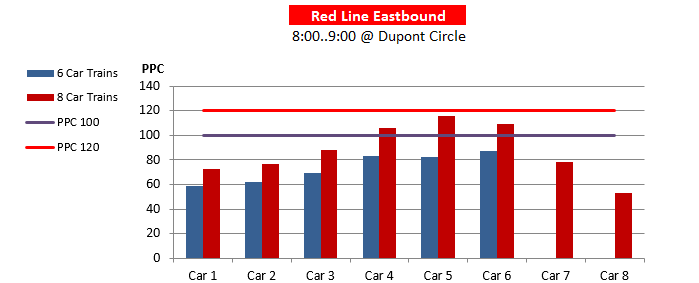
If you’ve seen Metro employees with clipboards out during rush hour at major stations, then chances are you’ve seen the Metro load checkers. These individuals mark down the loads of these trains. They also mark down any people who didn’t board. Last but not least, they are also doing this by car, and with that information Metro has been keeping track of the spread of the loads on the cars at the max load stations.

carloads

Average Car Loads in the AM Peak Hour – October 2014 Weekdays – Modeled Distribution of Passengers at Dupont Circle **The estimated railcar crowding is based on the scheduled Red Line service.

Read more…

Planning Tool Update Sheds Light on Rail Car Crowding Distribution

May 18th, 2015 19 comments

Latest version of Line Load tool will feature modeled car-crowding numbers.

Many factors influence which car number of a Metrorail train a customer rides.  Infrequent riders may wait for the train near the escalator and board the nearest rail car. Savvier customers may prefer to ensure they are the first to exit at their destination station or have an shorter walk at a transfer station.  Others may board cars based on understanding where seats are more likely to be available.  All of this activity can result in uneven loading of Metrorail cars across a given train, with some rail cars crowded and others near empty.

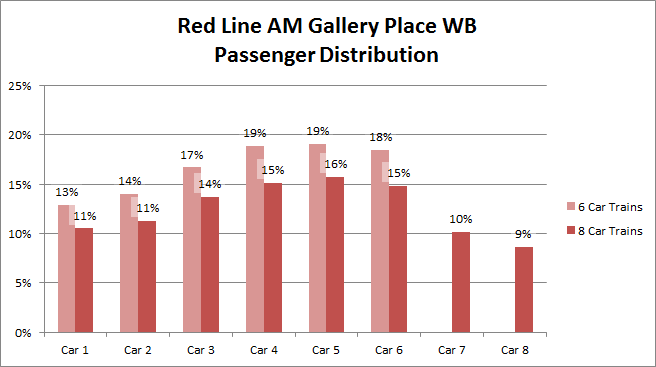
As we mentioned in 2013, the Office of Planning has an in-house tool that allows planners to estimate how crowded trains are based on origin-destination ridership data. Currently we are in the midst of a few updates, which will include the Silver Line that opened last year.  Another of the new features that we are excited about is a rail car crowding analysis for the system’s most critical segments.  Based on over six months of rail car-crowding data that was collected at selected stations by rail passenger “checkers,” the train-based ridership data will be distributed across the cars so we can estimate what kind of crowding we have by car number, at the peak load points. The following graph illustrates the observed car crowding variations at Gallery Place.

carcrowding

Customers may experience crowded conditions even when the average rail passenger per car (PPC) numbers (PDF) would indicate otherwise. This new feature is an important addition that will help Metro planners better understand the customer experience.  The car crowding analysis will begin to identify which cars of a train tend to be crowded in the peak hours, and which are less crowded.  This information will the be used as a starting point for devising strategies for better spreading customers across all cars of a train.

How do you choose which rail car you ride in?  Other than berthing trains at the center of the platform (see this informative article over at Greater Greater Washington on that topic), what strategies might Metro consider to better balance customers across rail cars?


Metro 2025: Why Now?

March 11th, 2014 1 comment

Four reasons why we need to begin the Metro 2025 investments now.

1. Because Metro 2025 is critical for growth. For the last three decades, the Washington region has grown in lockstep with an expanding transit system.  Since Metrorail opened in the late 1970s, the system has grown steadily, and in 2014 Metro provides two to three times more service (rail and bus vehicle-miles) than it once did.

For decades, this region has grown in lockstep with Metro.

Today, no significant new Metro service is planned beyond the Silver Line, yet MWCOG estimates that the region will continue to grow at a steady clip for years to come.  The only transit expansion projects that are planned complement and depend on connections to Metro, such as the Corridor Cities Transitway or Columbia Pike Streetcar, and may even increase the strain on Metrorail’s core.

2. Because we could lose jobs.  Without investment in the region’s transit backbone, economic growth and prosperity is threatened. In fact, studies have shown a clear link between growing congestion and declines in job growth. Without Metro 2025, this region could stand to lose nearly 133,000 jobs by 2040.

3. Because Metrorail is crowded, and it will get worse without Metro 2025. Today, Metrorail is reaching its capacity in many places. On the Blue and Orange lines for instance, Metro is running trains every 2.5 minutes, which is the most the infrastructure can handle, but even so, many trains are too full to board, or experience uncomfortable levels of crowding. Lines form at many stations to get through escalators, elevators, and fare gates.

Without eight-car trains and fixing station bottlenecks, crowding and congestion on Metrorail will continue. The map below shows our projections of crowding (passengers per car) into the future, if we don’t undertake Metro 2025:
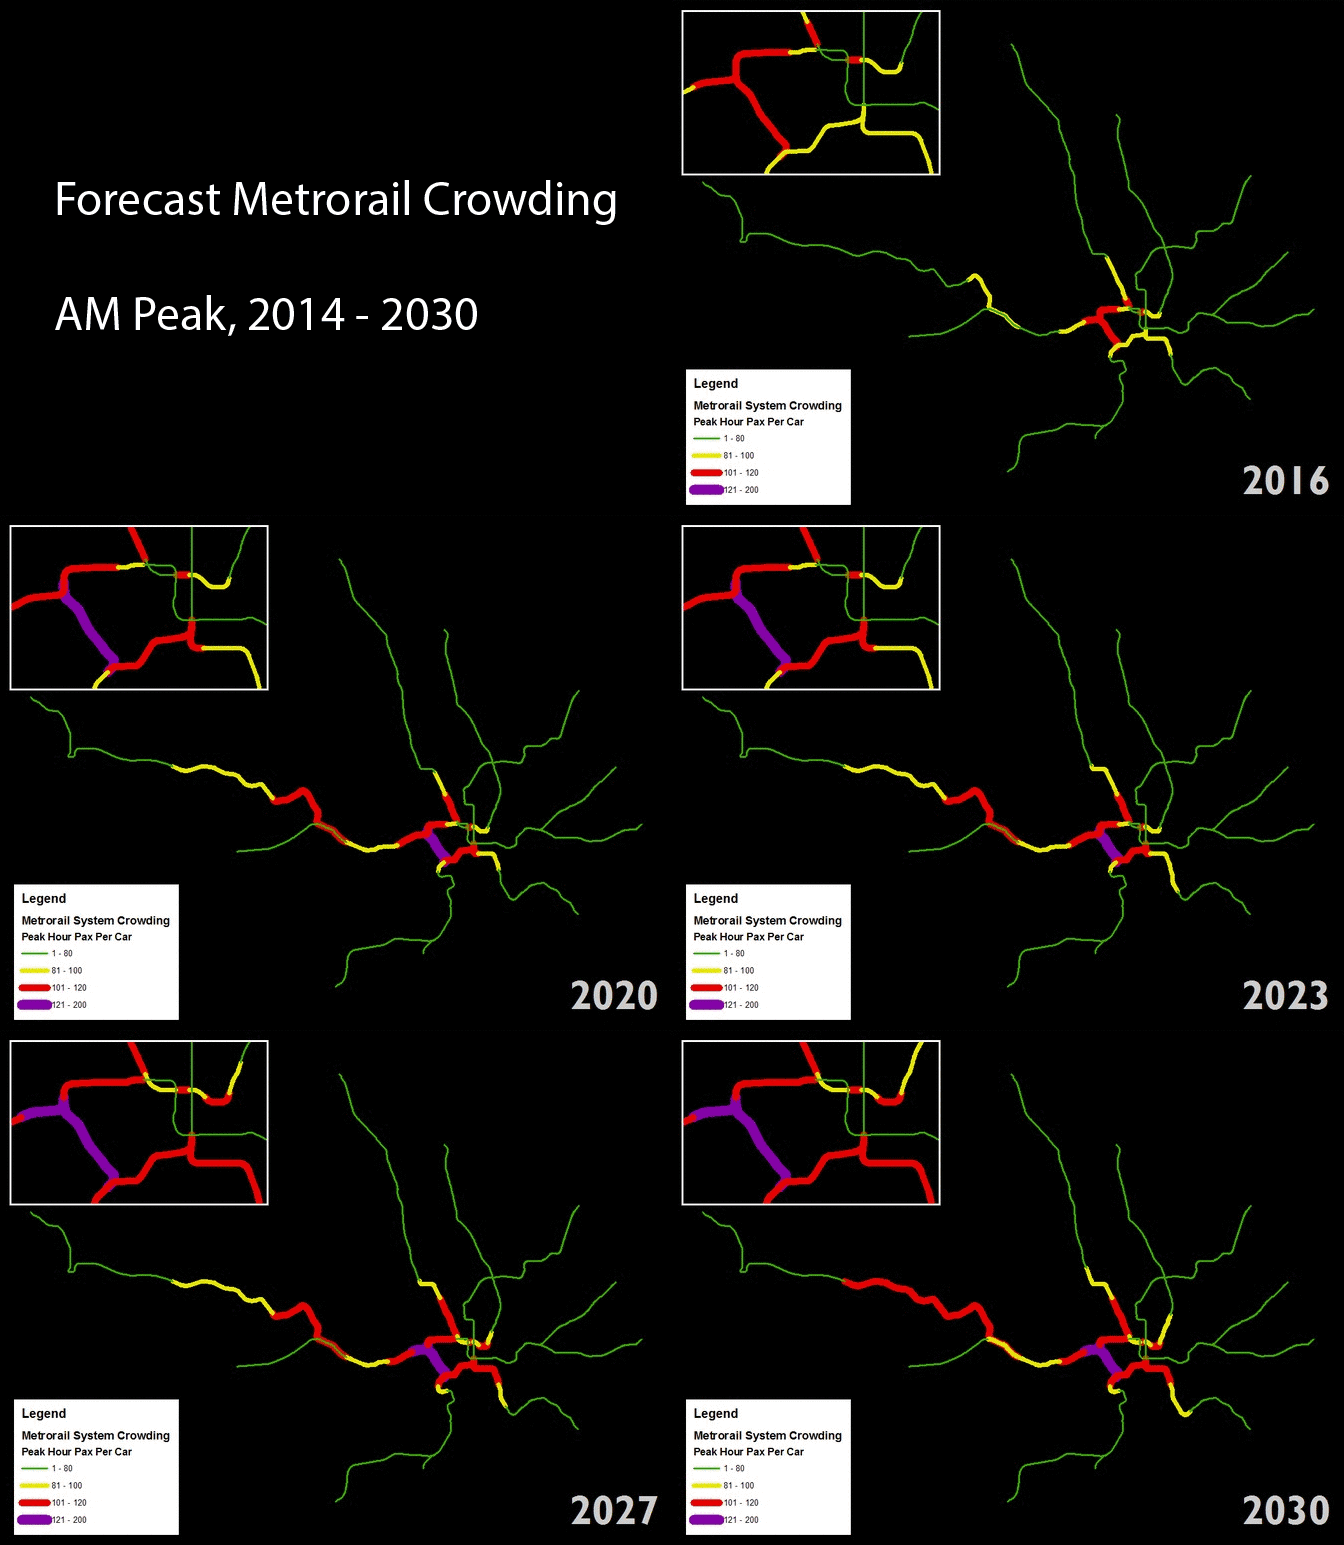
Crowding on Metrorail will worsen without the investments in Metro2025.

Crowding on Metrorail will worsen without the investments in Metro 2025. (Animated.)


4. Because Metrobus is stuck in traffic and needs relief. Metro’s buses are frequently caught in street traffic, which increases travel times, degrades reliability, and increases Metro’s operating costs just to maintain frequencies.
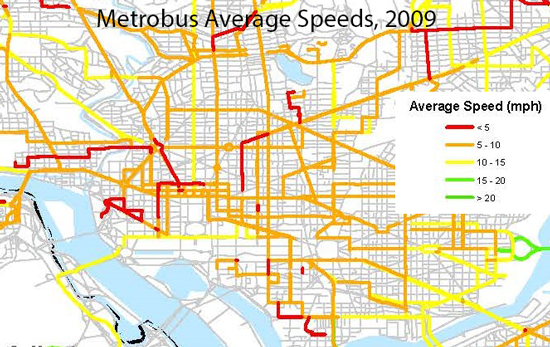
Bus-Speeds

Illustration of Metrobus speeds from 2009. The red is 5 MPH or less. Click for full version.

In fact, numerous Metrobus corridors operate at speeds of less than 10 MPH, and several showed speeds of under 5 MPH.  On many corridors, buses operate at a brisk walking pace even though they are carrying many more passengers than the traffic around them.  On H and I Streets NW, buses carry 40% of the passengers but are only 2% of the vehicles. On 16th Street NW, buses carry 50% of the passengers, despite using just 3% of the vehicles.

To increase bus service, speeds, and reliability, we need to invest in bus-only lanes, bus priority at traffic signals, and additional buses.
 

Metro Develops New Tool To Assess Transit Crowding

October 24th, 2013 2 comments

Our new “Line-Load Application” is expected to provide more accurate reports of system crowding by segment.

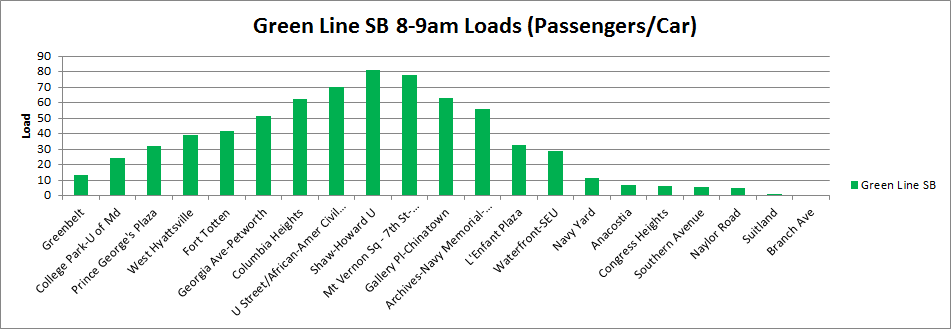
We recently finished testing a new version of the Line Load Application, a custom-developed application that distributes the load of passengers across the Metrorail system based on their points of entry and exit.  This application allows us to estimate the passenger loads on rail system per segment (rail between stations).  It is very important for Metro to be able to track the passengers per car across the rail system, both for peak hours on average weekdays and before and after special events. Because the new system is based on rail schedules, each passenger is assigned to an individual car for the assessment of passengers per car (PPC).

May1Load

Example of southbound Green Line passenger loads, May 1, 2013, 8am-9am

Our current method of assessing passenger crowding is by stationing rail passenger counting personnel at key stations during peak periods, approximately twice per month per station.  Because the inputs to the new application are faregate entry and exit data, this application is providing data like Metro has never seen before, including load factors and passengers per car for all stations at all times of the day.

Upon review,  the output data from this tool appears to match expectations of passenger loads at major checkpoints in the system during peak periods with no disruptions.  Output from this tool covering non-core checkpoints and non-peak periods will be validated soon.

In the next phase of improvements for this application, we will work to incorporate actual train arrival and departure times as an alternative to using schedules.  This will allow us to understand the actual conditions our customers experience during service disruptions or after special events.

The completion of the development of the Line Load application comes at a point in time when Metro is striving to increase safety and relieve the crowding on the rail system, both of which are major topics of our new strategic plan, Momentum.

CTA’s Decrowding Measures Having an Impact

August 12th, 2013 1 comment

The Chicago Transit Authority (CTA) proposed a decrowding plan last fall, and after one quarter, it appears to be working.

cta_bus_crowding

Source: CTA Crowding Reduction Plan: http://www.transitchicago.com/assets/1/miscellaneous_documents/Public_hearing_presentation_FINAL_090412s.pdf

They proposed the plan to reduce crowding and meet growing ridership needs (In September, they announced that “CTA ridership has risen 16 straight months, adding 22 million riders since June 2011.”)  The original plan essentially:

  • added service to 48 high ridership bus routes
  • added 17 rail trips to the Red, Blue, Green, Purple, Brown, and Orange lines during weekday rush hour
  • added rail trips to the Red, Brown, and Blue lines during weekend service
  • discontinued service on 12 low ridership bus routes (or duplicative)
  • discontinued service on 4 bus route segments (the entire bus route was not axed).

These service changes went into effect mid-December, 2012. The reasoning behind the addition of service and discontinuation of service was justified by the fact that the high ridership bus and rail routes represent more than 75% of the average daily ridership while the discontinued routes only represented less than 2% of its average daily ridership. Additionally, for the discontinued routes, there was another transit option nearby, such as a rail line, or another bus route. These cuts were also closely coordinated with the suburban bus company, Pace.

Read more…

Categories: In The News Tags: , , ,