Posts Tagged ‘bus ridership’

Is the DC Streetcar Hurting Ridership on Metrobus X2+X9? No.

December 12th, 2016 Comments off

The DC Streetcar has not significantly changed ridership on Metrobus X2 and X9, even though the services overlap on H Street NE. Instead, the Streetcar appears to be serving a new, different market – and has increased net transit ridership in the corridor by 15%.

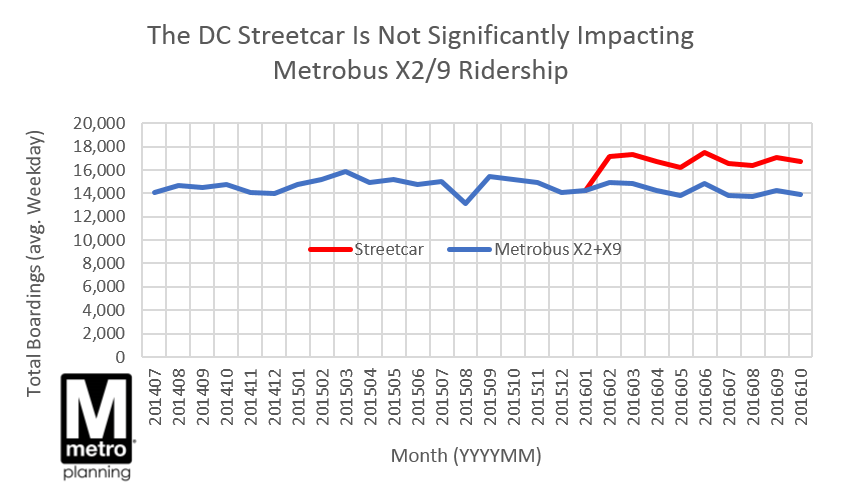
Although the new first phase of the DC Streetcar serves some of the same sections of H Street NE as the existing Metrobus routes X2 and X9, the streetcar appears to be serving almost an entirely new market of transit riders.  Ridership on the underlying Metrobus routes X2 and X9 have remained fairly steady, even as the Streetcar is serving over 2,500 new riders per weekday.

x2-v-streetcar-ridership-monthly-averages-2

Since it opened in February 2016, the DC Streetcar’s ridership has been climbing slowly and steadily, from around 2,400 to 2,800 boardings per weekday.  The route, just over 2 miles long, runs from near Union Station down the length of H Street NE.  The X2 and X9 buses run on the same stretch of H Street NE, but stop at different bus stops and connect farther west into downtown D.C., and farther east to Minnesota Avenue.  The overlap in markets is fairly small, and the ridership data confirm that the two modes are serving distinct markets – ridership on the X2 and X9 has remained flat, or only slightly down.  Overall transit boardings between the two modes combined have risen 15%, from around 14,700/day before the Streetcar to 16,800/day now.  (Note the lift in X2+X9 ridership in June, likely due to SafeTrack Surge 2).

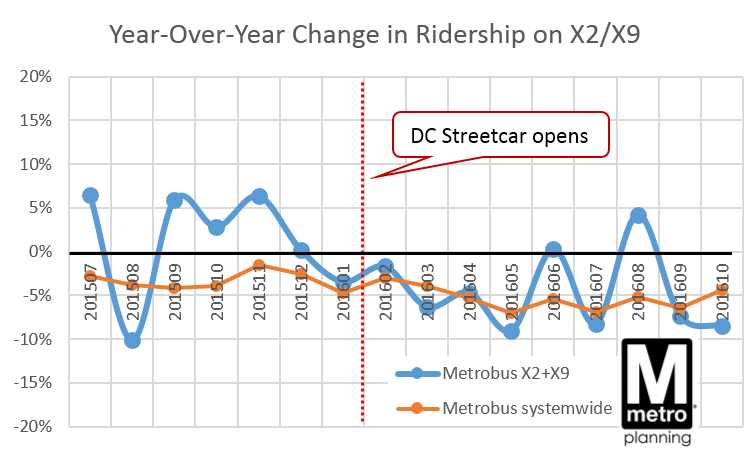
x29-yoy-change-in-ridership-vs-bus-systemwide

The Streetcar’s arrival does coincide with perhaps a minor shift in the rate of change in ridership on the X2+X9: monthly year-over-year change in ridership turned slightly negative last winter. But this is not dramatically different from the systemwide change in Metrobus ridership. So it’s not yet clear if this trend is due to riders switching to the Streetcar, or other forces.

Although the two modes overlap for a short stretch of H Street NE, the arrival of the DC Streetcar appears to be serving a new, distinct transit market. The Streetcar has not significantly poached riders from the existing X2 and X9 Metrobus routes, which have much higher overall ridership and serve a larger geographic area.

Metrobus Ridership During the Rail Safety Shutdown

May 23rd, 2016 2 comments

When Metrorail closed on March 16th, tens of thousands of rail riders switched to bus, including almost 20,000 riders who took their first bus ride in over a month! Bus-to-bus transfers spiked 45%, and ridership surged in downtown and central areas but fell in the suburbs.

Ballston Bus

Special thanks to the Systems & Performance Analysis team in Bus Planning for their help developing this analysis.

When Metrorail closed on Wednesday, March 16, Metrobus braced for impact as over 700,000 displaced rail trips sought alternatives. But there was little time or capacity to significantly alter bus service. What happened to bus ridership?

Overall ridership as tallied by the farebox came in at just 5% over the monthly average, or about 20,000 additional trips. So the changes look fairly small given the volume of displaced rail trips.

But don’t be fooled by the bottom line.  Underneath that total, a seismic shift was taking place. Read more…

Ridership Before and After the Blizzard of 2016

February 22nd, 2016 3 comments

What happens to ridership when a major snowstorm closes Metro?

The blizzard at the end of January dumped around two feet of snow on the Washington region over the course of a few days, making it the fourth-largest snowstorm in D.C. in over a century. To protect equipment, for the safety of employees and riders, and to focus on cleanup efforts, Metro ceased all operations for over three days. The Federal Government and schools were closed.

The chart below tells the story of the blizzard from a ridership perspective.  Actual bus and rail ridership by hour is shown as blue and red, with the orange dotted line showing a typical pattern from two weeks prior in January.

image012

Even before the snowflakes began falling on the afternoon of Friday, January 22, Metro’s ridership was impacted. That day, riders adjusted their normal routines by staying home, teleworking, or leaving early. The morning’s peak was half of normal. By Friday night, bus and rail operations ceased. No service operated Saturday or Sunday. Very limited bus and rail service was offered for a few hours on Monday, January 25 as cleanup and recovery began. Fares were not charged on rail, so we recorded very few transactions.

We recovered gradually on Tuesday and Wednesday, and nearly fully by Thursday, even as many school systems remained closed.

In the end, total ridership losses were estimated to be about 2.9 million boardings over five days, 1.6 million on rail and 1.3 million on bus. Bus took a proportionately bigger hit than rail given service restrictions from icy and unsafe road conditions.

What do you see in these numbers? Also, feel free to download the underlying data (.xlsx, 40kb) for yourself.

The K9 MetroExtra Bus Route Surpassing Expectations

April 30th, 2015 8 comments

Two years and 500,000 riders later, the K9 continues to demonstrates the benefits of MetroExtra limited-stop bus service.

At the end of this month, the K9 bus route will pass an important milestone – it will carry its half-millionth rider.  Since its inaugural run, the K9 has continually surpassed all of our expectations.

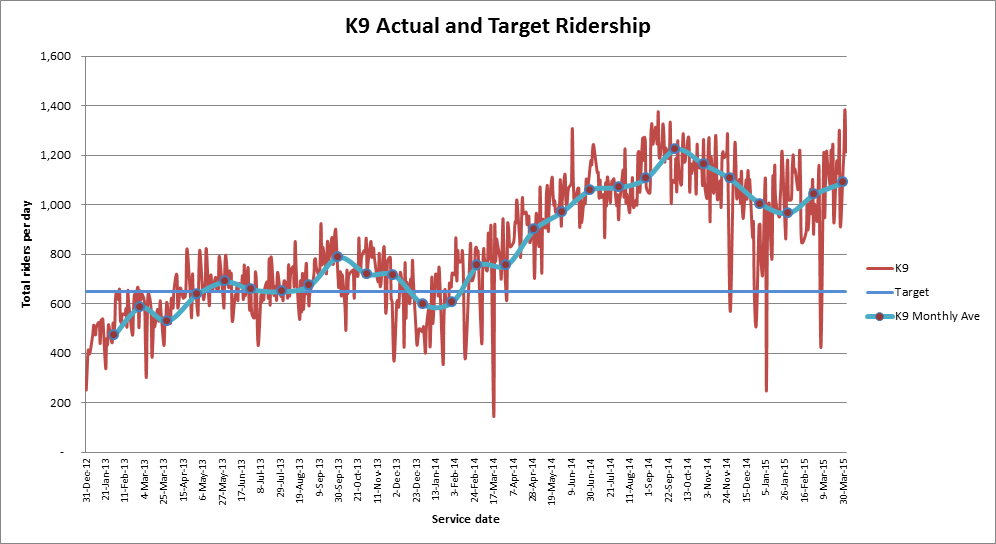
The concept for the K9 emerged from a year long study on bus service needs in the New Hampshire corridor and on New Year’s Eve 2012, Metro launched the K9 service – the first limited-stop bus service introduced in Maryland in many years. The K9 provided faster and more reliable service along New Hampshire Avenue between Fort Totten Metrorail station and the Northwest Park apartments in Montgomery County. Riders responded enthusiastically, pushing the K9 over its 6-month target of 650 daily riders in less than four months.  In March 2014, we extended the route north to the Federal Research Center in White Oak to coincide with the transfer of several thousand FDA employees to that facility and increased the service frequency to every 15 minutes.  Ridership surged again, passing 1,000 daily riders for first time only a week later. Two months later daily ridership was up another 20% to 1,200 daily riders.

K9 Ridership by day

Ridership on the K9 has grown an astonishing 50% year-over year for the past two years in a row, and this growth has not come at the expense of ridership on the underlying K6 local bus service (the K6 grew 2% between 2013 and 2014 and has been virtually flat for 2015).  Instead, the K9 has tapped into pent-up demand for transit service within the corridor by providing desperately needed capacity.  Read more…