
Metrorail Brought One-Third of Fans to Nationals Park in 2014
Carrying an average of 11,000 riders to every Nationals home game, Metrorail maintained a 34% mode share to Nationals park in the 2014 season.
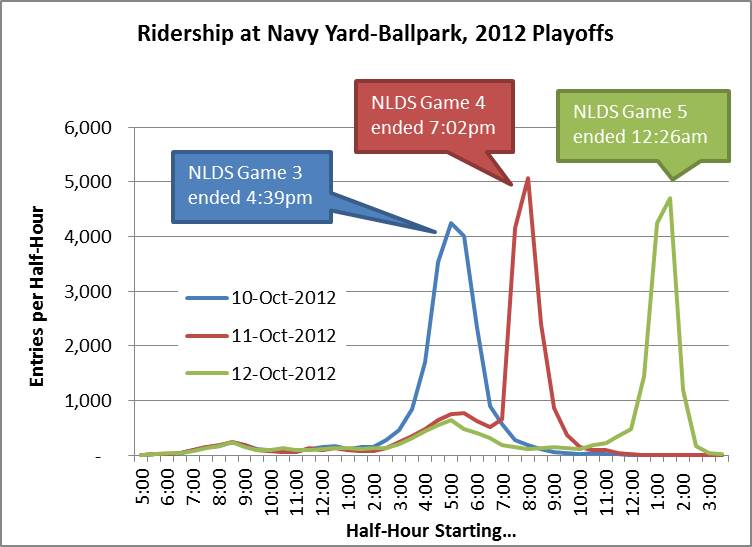
How many baseball fans take Metro to Nationals Park? Metro’s rail planning team tracks this statistic, by looking at activity around game times at Navy Yard-Ballpark and Capitol South stations that exceed our typical baseline ridership. On game days, Metro provides special game-day trains on the Green Line to handle increased loads to and from Navy Yard-Ballpark station.

Over the 81 home games in 2014, Metrorail brought an estimated 890,000 total riders to the ballpark, or about 11,000 riders per game. Compared to the average attendance of 31,000 at Nationals Park this year, this equates to a 34% mode share for Metrorail at Nationals Park. Including both entries and exits, Nationals games generated about 1.7 million total trips for Metrorail this season. A few more observations:
- Interestingly, ridership to the game is typically 8% higher than ridership from the game – some spectators must be finding another way home!
- Metrorail’s mode share was highest for Friday games (38%), and lowest for Wednesday games (32%)
- Mode share increases slightly for high-attendance games, but the relationship is weak. Metrorail’s market share remains mostly stable in the 30-40% range, whether attendance was 20,000 or 40,000.
We’ve posted additional visualizations and the raw data, in addition to the charts in this post. What do you think? What patterns do you see?


Recent Comments