‘Strategic Planning’

Vast Majority of New Office in Region Near Metro

April 22nd, 2015 2 comments

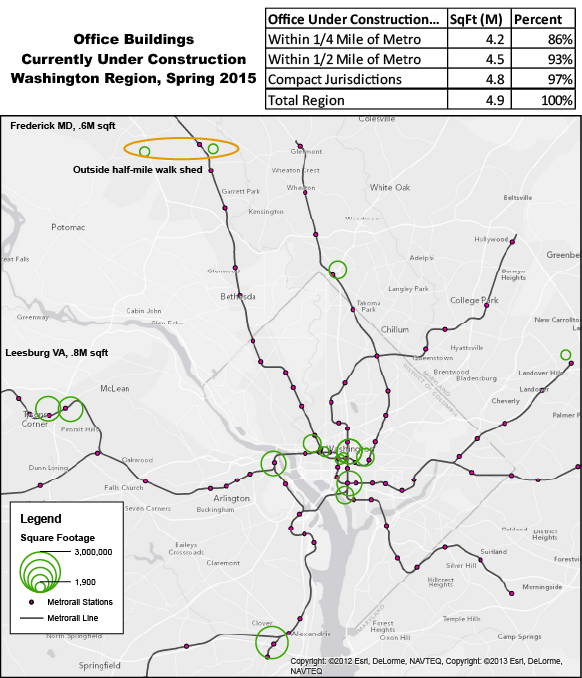
Approximately 86% of the region’s new office construction is occurring within one-quarter mile of Metrorail stations, 93% within the half-mile walk sheds.

A Washington Post article from October 2013 made a staggering assertion:  That 84% of new office construction in the region is occurring within one quarter mile of a Metrorail station, according to Jones Lang LaSalle and other data sources.  As we continue to dig into walk sheds and the land-use/transportation connection, we thought we would revisit this assertion and update it for 2015.

Since the Post article was written, we have begun to plan for near-term capacity constraints that might result from increased ridership caused by new households and jobs near Metro.  And part of this planning is gaining insight as to where and when new housing units and office space may come online through real estate industry data sources.   Through this research, we are able to update the statistic above:

86% of new office construction in the Washington region is occurring within one-quarter mile of a Metrorail station. 

UnderConstructionMap-01

New office currently under construction in the Washington region. All but four projects are within a half-mile of Metrorail.  Data from Jones, Lang, LaSalle.

Read more…

Metrorail: A Long-Term Solution

April 20th, 2015 12 comments

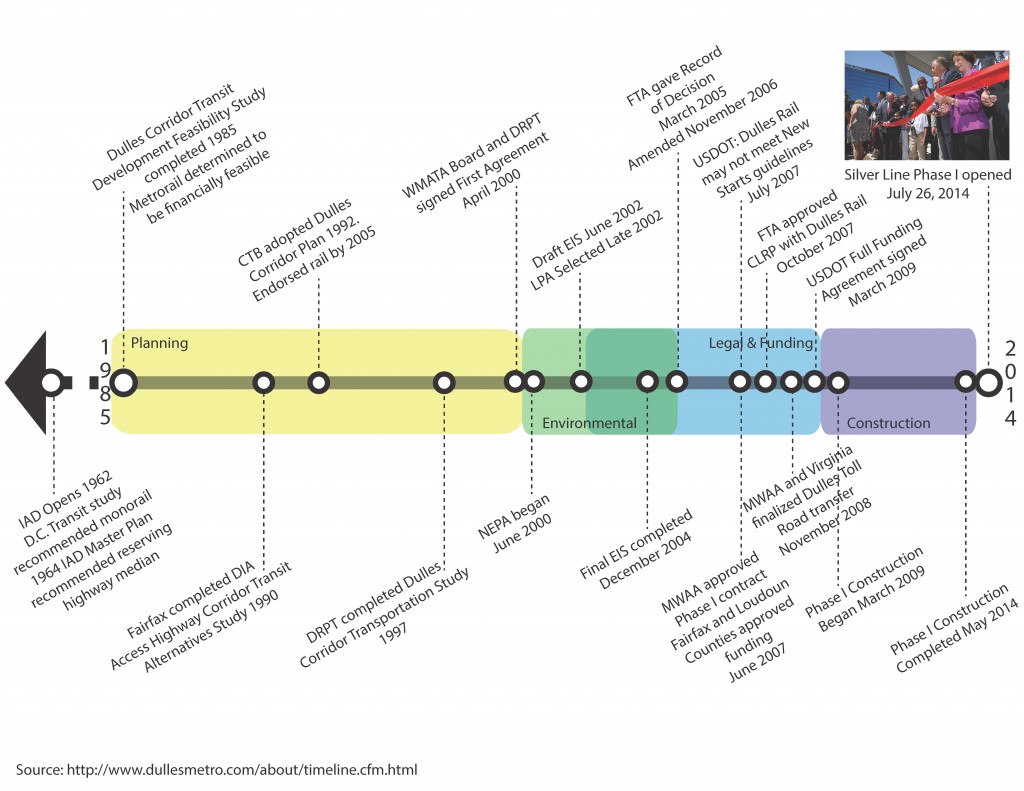
Metrorail has had a huge impact on the region, but as we’ve seen with the Silver Line, it can take decades to get from concept to execution.

One of the questions I hear most often as a planner for Metro is When will a Metro station open in xyz neighborhood, “in Georgetown”, or “at BWI”? It was the first question at the March Citizens Association of Georgetown meeting. My response — “Decades” — often elicits audible groans.

Given last summer’s opening of the Silver Line, we have a case study that can provide insight on how long it takes to plan, fund, and construct large infrastructure projects. The Dulles Corridor Metrorail Project has done a phenomenal job of maintaining a project timeline. Since the region has many recent newcomers, it is helpful to revisit many of the key milestones, as shown below. It is also helpful to remind readers that the Metropolitan Washington Airports Authority (MWAA) was the ultimate developer of the Silver Line (both Phases I and II) and that the project “only” required cooperation among the Commonwealth of Virginia, MWAA, Metro, the federal government, and Fairfax and Loudoun Counties. While just one example, the Silver Line’s long story is not vastly different from other mega-projects happening in the region and across the country.

Timeline for Planning, Environmental Process, Legal and Financing, and Constructing the Silver Line

Read more…

Going Up – Why the Construction Pipeline Means Higher Metrorail Ridership (Part Two)

April 7th, 2015 6 comments

In Part Two of this series, we forecast the impact of the region’s near-term development pipeline on Metrorail ridership, using the Land Use-Ridership model. The good news? Metrorail ridership is set to show big gains. The bad news? Your ride just got less roomy.

Just as we were putting the finishing touches on this post, we saw a flurry of news articles detailing the regional market forces that portend increased rail ridership. Millennials choosing not to drive, even as they grow up.  Office parks in far-flung places experiencing devaluations while Metrorail-adjacent areas capturing the lion’s share of new leases.  Marriott announcing that it will seek a transit-accessible location when it moves.  And even defense contractors coming to bat to argue for the economic benefits of the Purple Line. All of this free publicity set us up nicely for what we wanted to share with you – the first results of the Office of Planning’s Land Use-Ridership model as applied to near-term development projects.

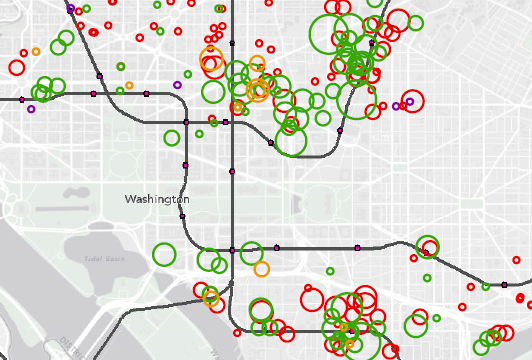
The Near-Term Pipeline. Researchers at Jones Lang LaSalle have been compiling a list of actual development projects – under construction, or planned – near Metrorail stations, so that we can forecast the near-term capital needs for the system. A huge amount of development (over 105 million square feet!) is on the books for within a half-mile of a Metrorail station.

NearTermPipeline_Thumbnail

Map of near-term development projects near Metrorail, by building type (click for full image)

So, How Much Ridership? What impact will all of this have on Metrorail? We ran these projects through the Land Use-Ridership model, and what we found was both intuitive – and startling. Read more…

Going Up – Why the Construction Pipeline Means Higher Metrorail Ridership (Part One)

April 6th, 2015 5 comments

We’ve claimed that Transit-Oriented Development (TOD) projects in this region will be critical to Metrorail ridership and sustainability. The good news is that our assertions are grounded in statistically rigorous evaluations of TOD’s impact on Metrorail ridership – here’s how. (Part one of a two-part series).

While factors like fares, service, and the economy can certainly explain some changes in Metrorail ridership, one absolutely fundamental explanation of differences in walk ridership between stations is development.  Why does a station like Landover see only 50 riders arrive on foot each morning, and a station like Crystal City see over 3,000?  Why does a station like Bethesda see balanced ridership in all directions, where a station like Suitland is almost entirely one-direction? Development. Even a simple scatter plot shows that households alone near the station explain 70% of AM Peak walk ridership!

Planning studies have long-posited that transit-oriented development is such a key part of driving ridership, and if that is the case, then TOD is vitally important to Metro’s long-term financial sustainability.  We at Metro needed to quantify this link in a more sophisticated and system-specific way, and so we created a way to calculate the impact of land use changes (household growth, employment growth, new development) on ridership and revenue.

What is a Land Use-Ridership Model? To help, Metro’s Planning Office has built a Land Use-Ridership Model that will predict changes in Metrorail ridership as a result of occupancy changes (growth, decline, new development, etc.) in the station area.  This model helps us get very specific when it comes to modeling the impact of land use changes on ridership and revenue.  It helps us answer questions such as: “When developers build a new apartment building next to a Metrorail station how much ridership and revenue will Metro realize?”, and; “If an office building is proposed at one of four Metrorail stations, which location maximizes ridership and revenue without exacerbating core capacity constraints?”

LURM general flow

This tool is based on a rigorous understanding of the link between land use and the rail ridership we see today and is built on “direct ridership modeling techniques” found in academia.  It also focuses specifically on “walk ridership” (which constitutes 38% and 78% of our AM and PM peak ridership), since rides related to bus transfers, parking, and other access modes are less related to adjacent land uses.

To build this, we analyzed the actual quantity of walkable land uses from each station area, assembled detailed information about land uses and densities in those areas (households, jobs by industry type), and also controlled for other, non-land-use factors that shape ridership – like network accessibility. In all we worked through over 200 independent variables in our modeling and also brought in experts from the University of Maryland’s Center for Smart Growth, professors Hiroyuki Iseki, Ph.D. and Chao Liu, Ph.D., to bring their analytical and statistical firepower to the fray.

How We Built It. We defined the walkable area as a half-mile walk along a road network, so we account for barriers like highways and fences.  The half-mile cutoff is a bit longer than the median actual walk distance reported by our riders in the 2012 Metrorail Passenger Survey. For each station and its walk shed, we tested the following kinds of factors: Read more…

Mass Transit Needs Mass

October 15th, 2014 7 comments

Transit expansion is in demand but Metrorail, light rail, and other high capacity transit projects can be expensive to build, operate and maintain.  With limited resources to invest, our region must ensure that these projects serve the most robust transit markets and are supported by strong transit friendly policies.

Informed by our peers and local performance measures, Metro is developing guidelines that the region can use to inform development of high capacity transit projects. As we’ve explored previously, there’s much more to transit expansion than Metrorail. In fact, due to the cost associated with Metrorail expansion along with existing land uses and built environment in much of the region, most of our future high capacity transit projects will be made up of other transit modes. But what is the best way to decide what mode best fits each corridor? The goal of the expansion guidelines is to inform those decisions.

Development in Arlington’s Rosslyn-Ballston Corridor has validated initial and ongoing investments in Metrorail. (source: Arlington County)

A literature and peer review included policy documents from BART (PDF), the Bay Area Metropolitan Transportation Commission, Florida DOT, Virginia DRPT, Federal Transit Administration (PDF), and research from the University of California Transportation Center (UCTC). The review found that ridership, density, the presence of walkable streets and sidewalks, local plans and policies, and cost effectiveness are the most relevant criteria to evaluate transit projects and that rigorous performance targets are needed to support each transit mode. Read more…

Funding Metro 2025 – Beyond Buzzwords

July 31st, 2014 Comments off

Fancy financing and accounting gymnastics won’t ride to the rescue for Metro 2025.

Public Private Partnerships.  Tax Increment Financing.  Infrastructure Banks.

These are among the many ideas discussed today as panaceas for public infrastructure funding, including major transit investment projects in the region and the nation.  Certainly they can be helpful tools, especially in an era of declining federal funds and a renewed emphasis on local fiscal austerity.  But can these tools be useful in funding or financing Metro 2025?

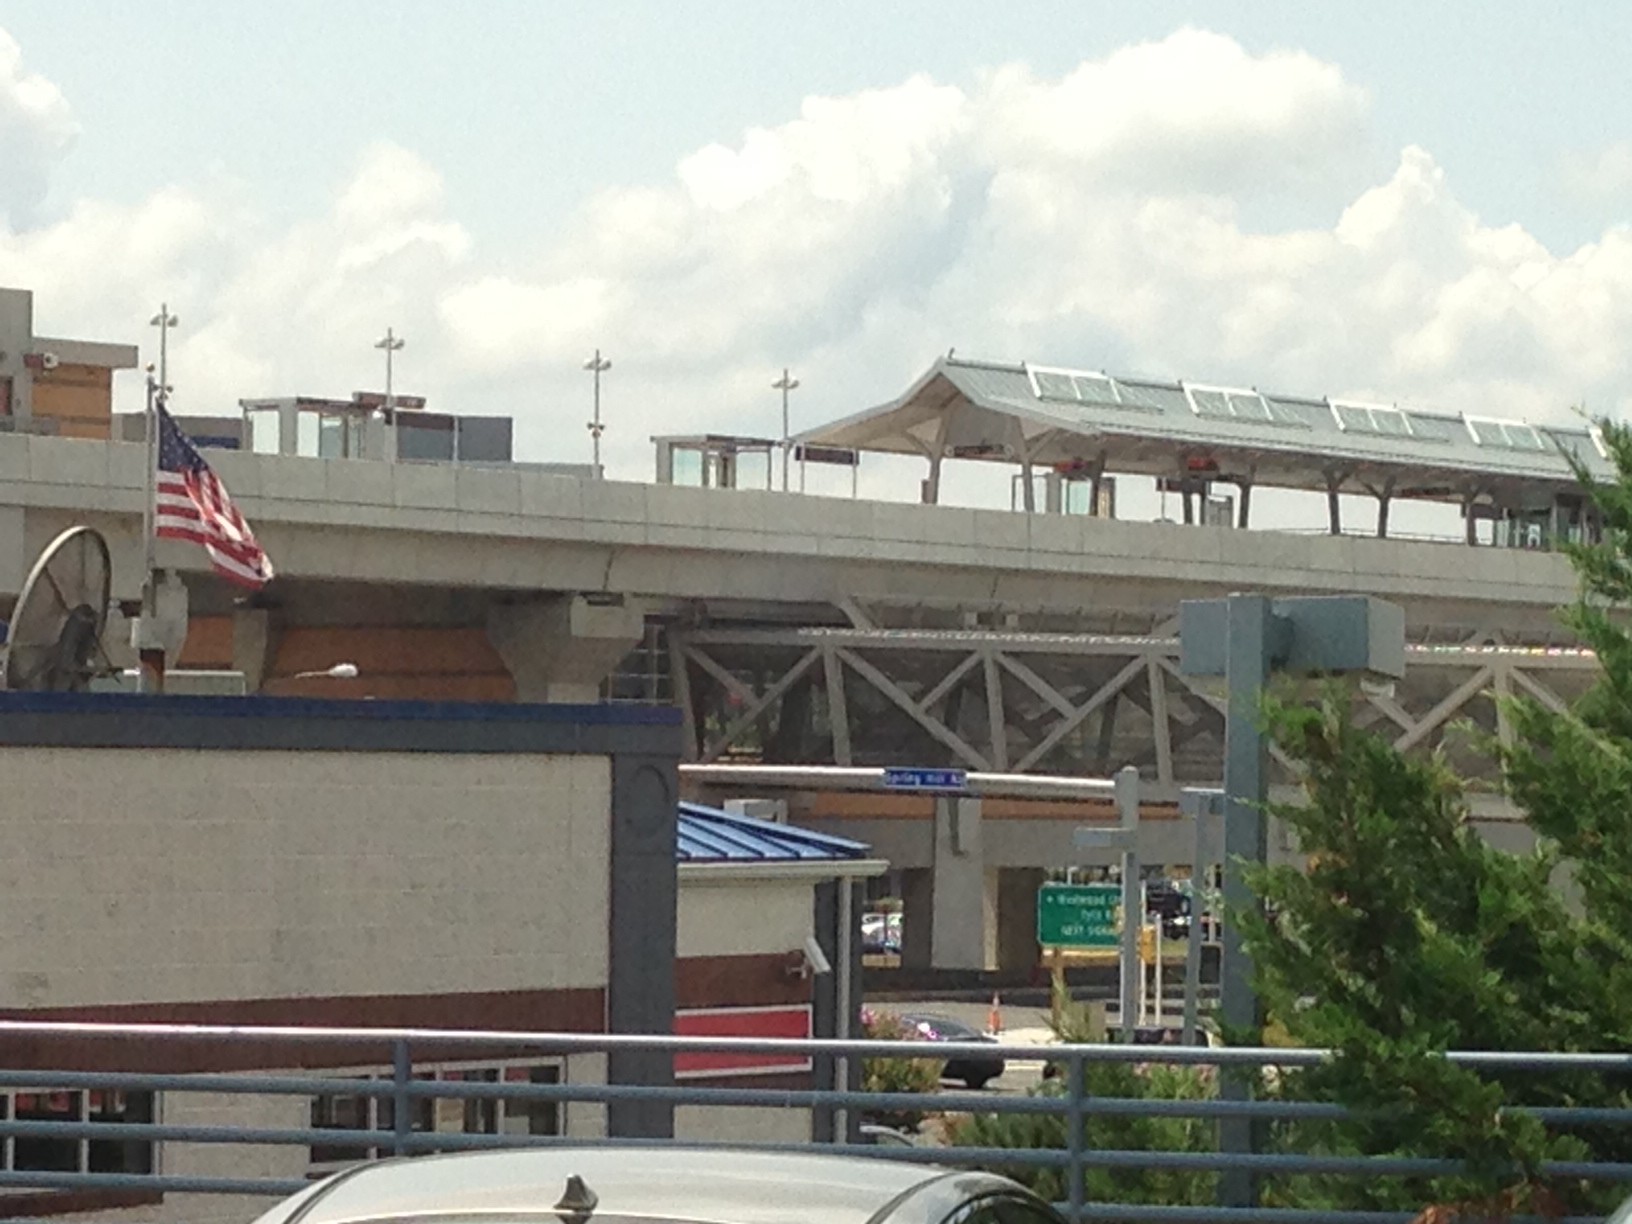
Spring Hill Silver Line station.  The Silver Line was financed in part by special tax districts.

Spring Hill Silver Line Metrorail station. The Silver Line was financed in part by special tax districts.

Metro leadership wanted to find out, so between November 2013 and January 2014, Metro gathered leading experts in real estate, transportation and municipal financing from academe, management consulting, policy advocacy and government to solicit the best ideas for innovative ways of addressing Metro’s challenge.  We learned that each of these financing techniques has differing strengths, weaknesses, and potential applications to capital projects.  We also learned that none of the techniques actually provides new funding. Which is, ultimately, what is necessary to make Metro 2025 a reality.

The distinction between financing and funding cannot be overstated, and is a key concept that often confuses the dialogue surrounding how to execute major capital projects such as transit investments.  Techniques such as Public-Private Partnerships, Infrastructure Banks, and Value Capture rely on existing sources of funding to channel and make more available monies to public entities to pay for varieties of projects.  These existing sources of funding are often taxes – either on households, businesses, or property owners – and backstopped by jurisdictional guarantees to tap into general funds or issue general obligation bonds should the stream of cashflows become unstable.  These financing techniques do not generate new monies nor eliminate the ultimate obligations of the public sector to provide the monies to contribute to the cashflows, either upfront or over time.  

You can read more in the attached report, and know that Metro’s leadership is committed to evaluating any and all options to fund Metro 2025.  Leaving no stone unturned, we conclude that as of this moment in time, regional leaders must step up to the plate and commit resources to Metro in order to make much-needed projects like eight-car trains, core station improvements, and the Metrobus Priority Corridor Network, leap off of the page and become part of the region’s transit network. 

Download:  Metro – Creative Financing (PDF, 1MB)


Fixing Core Stations in Metro 2025 Helps Riders from All Jurisdictions

June 12th, 2014 3 comments

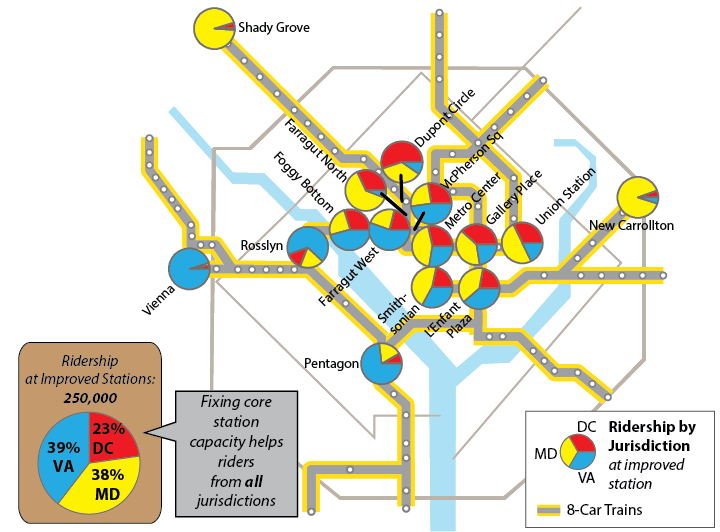
Though many of the stations that Metro 2025 seeks to improve are in the District of Columbia, the capacity expansion would help riders from all jurisdictions.  

Metro needs to improve the capacity at over a dozen stations:  some of these stations are at capacity today, and our 100% eight-car train program will bring even more customers to already crowded stations.  We know we need to build new escalators, expand mezzanines, and build pedestrian passageways to meet this future demand.

The fact is that Metro 2025 is designed to benefit the Washington metropolitan area, residents of the District, Maryland and Virginia, as well as visitors from around the country and the world.

If you’re a commuter in Maryland or Virginia, it may look like the benefit of these improvements are focused on D.C. residents.   After all, 10 out of the 15 stations are located in the District of Columbia.  But the diagram below shows most of the riders who use these stations – those who create the need today, and who would benefit from fixing it – live in Maryland or Virginia.  In fact, 77% of the users of the Metro 2025 stations live in the suburbs.

 Three-quarters of riders benefiting from the station improvements in Metro 2025 live in Maryland and Virginia

Fixing core stations in Metro 2025 helps riders from all jurisdictions

Help us make the Metro 2025 projects in Momentum a reality! Learn more about Momentum, call on your elected representatives, and endorse the plan.

How Do Different Modes Compare?

May 14th, 2014 6 comments

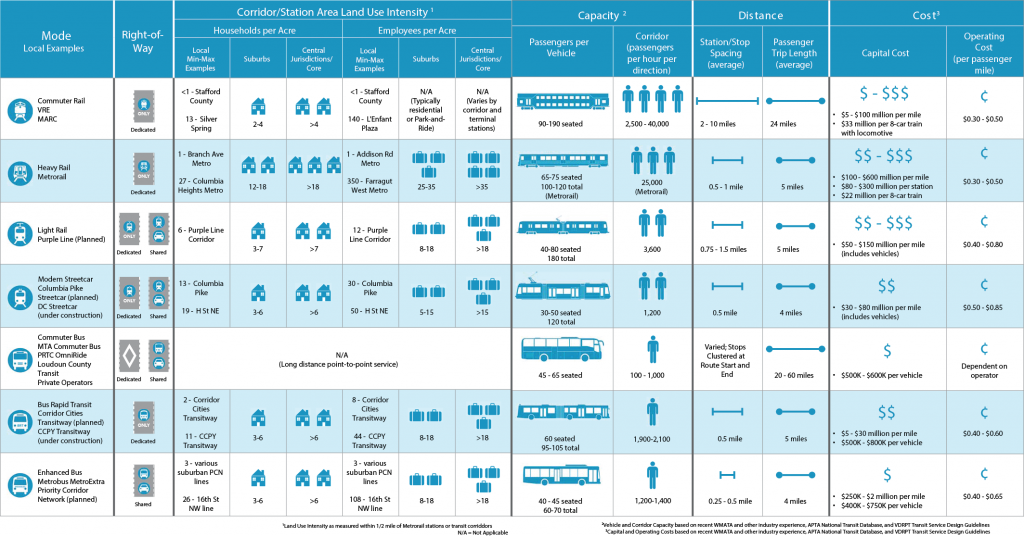
The region either already has or is planning for a variety of different modes. How do they compare? The Silver Line will soon open as a Metrorail line. Later this year, a streetcar will be operating on H Street, NE with others planned for Columbia Pike in Arlington and the District. Arlington and Alexandria are jointly building a bus rapid transit (BRT) line between Crystal City and Potomac Yard. Once funding is finalized, Maryland will build the Purple Line and light rail transit (LRT) will connect New Carrollton and Bethesda. This is all in addition to the region’s existing commuter rail, commuter bus, Metrorail, Metrobus, and MetroExtra services. The region is not only expanding transit services, but it also expanding the types of transit modes that will operate. At long last, instead of talking about Portland (streetcar), Jersey City (light rail), or Cleveland (bus rapid transit), we’ll be able to point directly to services and infrastructure in our backyard or take a trip and experience the pros and cons of these modes for ourselves.

So how do the different modes compare? What kind of purposes does each serve? There are many external factors and trade-offs that influence how agencies and jurisdictions select which mode to implement.  As we see from the ongoing debates in jurisdictions across the region between LRT and BRT or streetcar and enhanced bus, there is not always one perfect choice. However, an array of transit and land use measures can provide context to the conversation. As part of ConnectGreaterWashington: The 2040 Regional Transit System Plan, we developed the below table to compare commuter rail, commuter bus, heavy rail, light rail, streetcar, bus rapid transit, and enhanced bus across land use intensity (households and employment), vehicle capacity, stop spacing, trip length, and capital and operating costs.

What do you think? Does this information better inform the rail vs bus debate? What other information would provide more clarity on what modes work where?

Comparison of High-Capacity Transit Modes

Comparison of High-Capacity Transit Modes


What Metro 2025 Means to Virginia

March 20th, 2014 1 comment

Metro 2025 would bring significant benefits to northern Virginia, allowing the region to thrive economically while preserving regional vitality.

Think Metro’s Momentum plan is all about “downtown?” Think again! Our seven Metro 2025 initiatives – from eight-car trains to bus-only lanes will bring dramatic improvements to the quality of life and transportation to northern Virginia.


Benefits Icons_Expansion

Supports Virginia Transit Projects

Virginia is planning big for transit, which is great – but all of the planned projects rely on a robust Metrorail and Metrobus “backbone” to succeed:

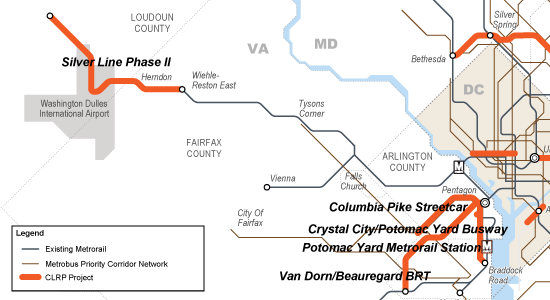
  • The Silver Line extends Metrorail by over 20 miles, and will generate tens of thousands of new riders per day when Phase II opens – many of whom will travel into Metrorail’s already congested core.
  • The Columbia Pike Streetcar will transfer 32,000 riders per day to and from Metrorail at Pentagon City – at a point in the system that is already maxxed out.
  • Two other planned busways (Crystal City/Potomac Yard, and Van Dorn/Beauregard) also connect with Metrorail stations.

All major transit projects funded in the CLRP in Northern Virginia depend on the "backbone" of Metrorail and Metrobus.

All major transit projects funded in the CLRP in Northern Virginia depend on the “backbone” of Metrorail and Metrobus.

By ensuring that Metro services can keep pace with congestion and demand, Metro 2025 is critical to making Virginia’s transit projects a success, and critical to helping the region and the state reach its transportation goals. Read more…

What Metro 2025 Means to Maryland

March 18th, 2014 1 comment

Metro 2025 would bring significant benefits to Maryland, supporting its economic growth and ensuring its future vitality.

Metro’s Momentum plan calls for seven Metro 2025 initiatives – from eight-car trains to bus-only lanes, which will bring dramatic improvements to the quality of life and transportation to Maryland.


Benefits Icons_Expansion

Ensures the Success of Maryland Transit Projects

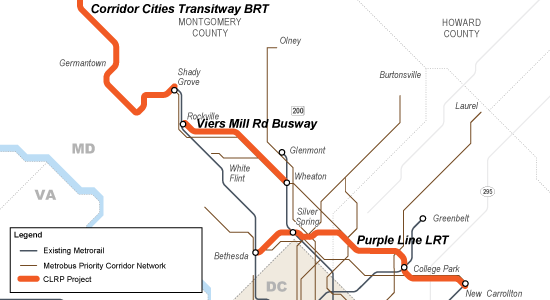
Maryland has great plans for transit.  The Corridor Cities Transitway, the Purple Line, and the Viers Mill Rd Busway are all included in the CLRP with a reasonable expectation for funding, and the Federal Transit Administration announced recently that the Purple Line would receive $100 million in Obama’s latest FY15 budget.  Additionally, Montgomery County is developing plans for a county-wide BRT system.

These projects are worthwhile ventures, but they will always rely on the supporting regional “backbone” of Metrorail and Metrobus to deliver their intended results. At the very least, these three important projects would not connect to each other if not for Metrorail and Metrobus.  And at the very worst, if these projects are built and connect to a system that is already over capacity, they may struggle to live up to their mobility goals.

  • The Corridor Cities Transitway will function as a BRT extension of the Red Line: 1,500 people per peak hour will transfer to Metrorail at Shady Grove by 2030. (For context, about 3,000 riders per peak hour enter Shady Grove in the peak hour today.)
  • The Viers Mill Rd Busway will connect to three Metrorail stations. The current Metrobus Q-Line, a part of the Priority Corridor Network (PCN), currently provides over 8,800 trips per day, including approximately 800 transfers a day to Metrorail.
  • 10,000 Purple Line riders per day will come to and from Metrorail, where the Purple Line connects to the Red, Green, and Orange lines. Many of these passengers will further strain the over-congested lines of the rail network.

x

Funded Maryland transit projects, in the CLRP.

By ensuring that Metro services can keep pace with congestion and demand, Metro 2025 is critical to making Maryland’s transit projects a success, and critical to helping the region and the state reach its transportation goals.


Benefits Icons_Support Growth

Supports Maryland’s Growth Prospects

Maryland’s population in the Compact region is growing steadily and projected to continue growing. This growth is crucial to the economy of the state – 40% of Maryland’s state economic output came from the Washington region’s suburbs in 2012.  With that growth comes significant transportation needs, and Metro 2025 is critical to meeting that growth.

When congestion goes up, job growth goes down, and if Maryland wants to see growth potential turn into actual jobs, it needs to tame congestion.  Simply, Maryland needs the mobility that Metro 2025 would deliver: 8-car trains capable of moving the equivalent of 16-18 lanes of highways (in each direction) and connect Maryland to other regional job centers, superior bus service that can create much-needed east-west connections that bypass snarling congestion, and more. Read more…