‘Planning Studies’

Since Time is Money, Metro Wants a Business Partner to Help Metrobus Go More and Stop Less

September 11th, 2015 3 comments

Metro is exploring opportunities to partner with a private company or investor to pilot off-board SmarTrip® loading to help improve customer travel times and lower our operating costs.

Metrobus speeds have steadily decreased over time as the region grew and traffic worsened. This not only negatively impacts Metro customers, but also increases our operating costs. As traffic congestion erodes bus speeds, we need to deploy more vehicles and operators on the busiest routes in order to maintain service frequencies. We know that behind the statistics stand legions of bus riders who want faster service, as well as counties and cities that want lower bills for that service.

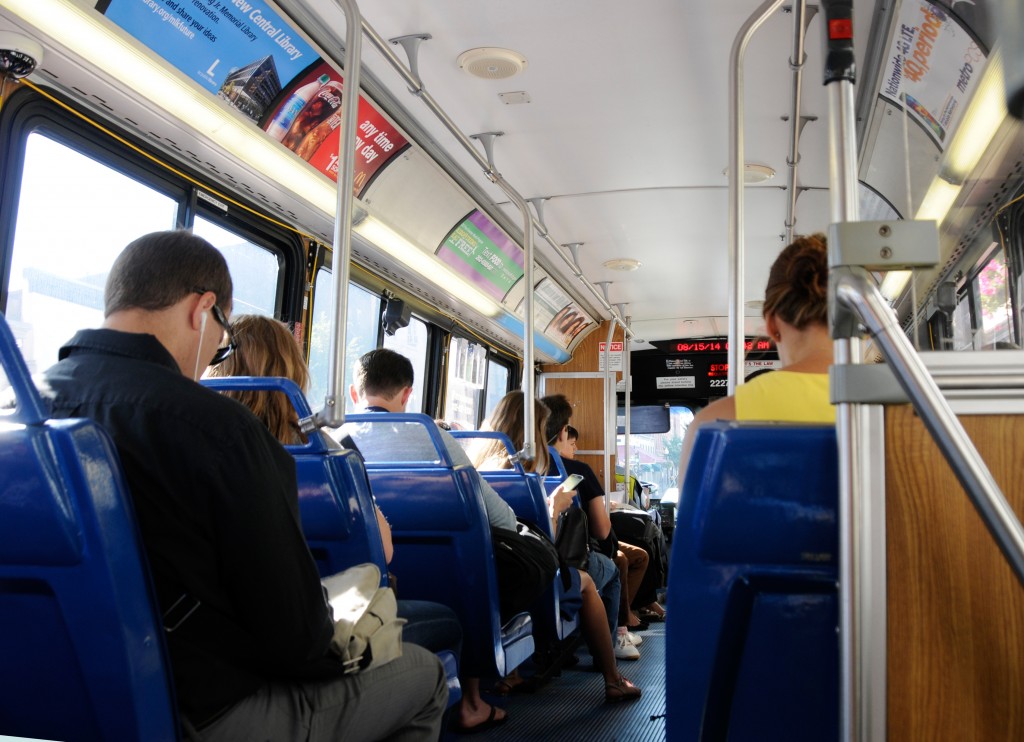
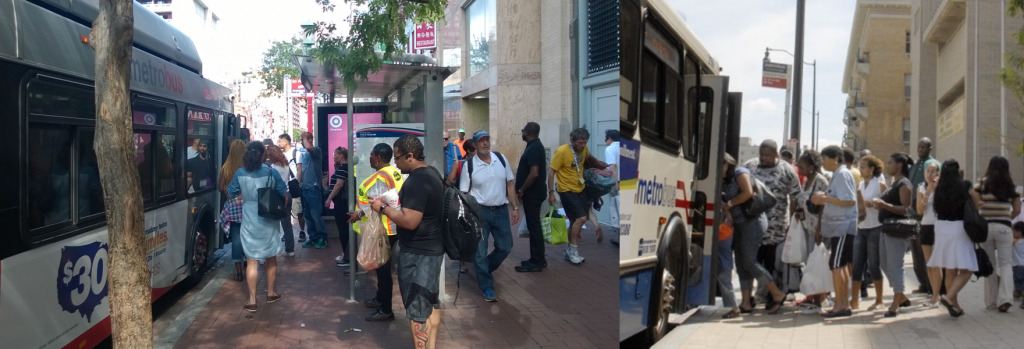
Crowded boarding and long dwell times

Crowded boarding and long dwell times

Off-Board Fare Payment and Transit Prioritization

There is no silver bullet to speed up transit. Instead, agencies can use a combination of technology and on-street treatments to increase bus speeds and move more passengers. One of the few prioritization strategies Metro can undertake on its own is allowing off-board fare loading, moving all SmarTrip® value loading from the farebox to kiosks near bus stops. This would reduce the amount of time it takes for passengers to board buses and pay fares, in turn speeding up bus trips.  We have looked into this in the past and have recently revisited this important concept. Read more…

Does Metrobus Need a Refresh?

August 31st, 2015 4 comments

Metrobus has a strong identity as a regional transit provider, but as the region has grown it hasn’t kept up with changing development patterns. Does the regional role of Metrobus need to be rethought?

A previous post described the historical context of Metrobus as a regional bus service provider, as well as the Metrobus regional service criteria developed by a regional “Blue Ribbon Mobility Panel” in 1997.  What has happened to the Metrobus regional service since the 1998 Board action? Does today’s regional service still meet the original criteria?  Metro’s planners recently conducted an assessment to address these questions.

Majority of “regional” Metrobus service performs well

Overall, Metrobus regional lines provide higher levels of service and achieve higher cost efficiency than non-regional lines.  Currently Metrobus operates 106 regional lines and 55 non-regional lines  The overall higher ridership of the regional lines resulted in an average operating cost of $3.50 per passenger trip, lower than the non-regional service at $4.50.


Read more…

Categories: Metrobus Studies Tags:

Ask the Professors – How Local Land Use Decisions Impact Metrorail Ridership

August 24th, 2015 1 comment

This post is guest-written by Chao Liu, Hiro Iseki, and Gerrit Knaap, researchers from University of Maryland’s National Center for Smart Growth, who helped Metro develop our Land Use Ridership Model.

Even though Metro doesn’t control where new jobs and households locate in the region, these decisions are critical to the agency’s ridership and financial future. 

It is well known that the form and intensity of development in and near rail transit station areas can have measurable impacts on transit ridership.  For these reasons, transit oriented developments (TOD) generally feature high-density construction, mixed land uses, and bike and pedestrian friendly infrastructure.  But not all TODs are alike, and the effects of TOD on transit ridership are likely to depend on how well the station is connected both locally and regionally, whether the station is near the center or end of a transit corridor, and what kinds of jobs and household are located nearby.

To explore how different forms of development might impact ridership on the Washington Metrorail system, Dr. Hiroyuki Iseki and Dr. Chao Liu assisted Metro to develop a direct ridership model (DRM), called Metro’s Land Use Ridership Model.  A DRM uses statistical techniques to quantify the relationship between entries and exits at rail stations and land uses nearby.  This model can then be used to estimate the number of passengers who will access the station, by waking or biking, as a result of changes in land use features, transit service characteristics, and socio-demographics within the walkshed of any given station.

The direct ridership model includes a large number of variables for each station, including the density, diversity, and design of local environment; transit service and connectivity; job accessibility by auto and transit; walk score; the availability of parking; the demographics of nearby residents; the number and types of jobs nearby, and more.  The model was estimated for the AM Peak, Midday, PM Peak, and Evening travel periods.  The AM Peak model is best suited for estimating the increase in morning boardings that would result from locating more households near the station; the PM Peak model is best suited for estimating the increase in afternoon boardings that would result from locating more jobs near the station.
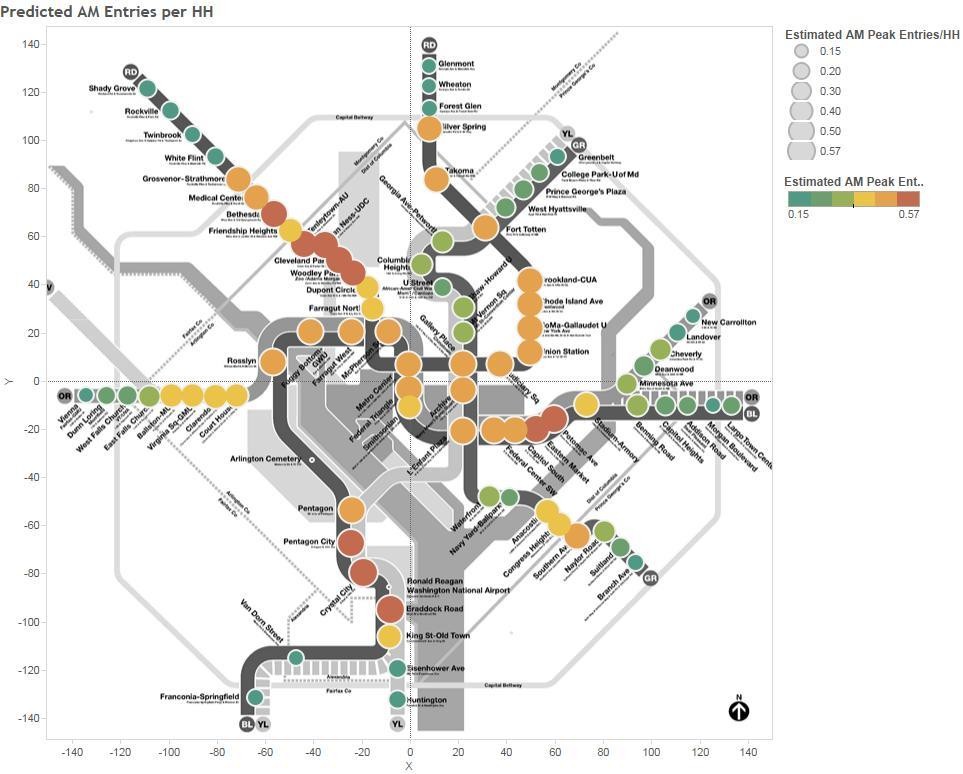
Pedicted AM Peak Entries per New HH

Map 1. Predicted AM Peak Entries per New Household

The impact of adding jobs and households near stations varies by station area.  Map 1 above, for example, shows the estimated entries per new household in the morning peak—that is, how many additional boardings would occur in the AM peak if one additional household was located in the walkshed of the station.  Stations shown by red dots gain more than 0.57 boardings per day, for each new household in the walk shed, while stations shown with green dots gain only about 0.20 boardings per day. As a concrete example, Rhode Island Row is a 274-unit, mixed-use, TOD project built on a WMATA site.  Situated along the busy Red Line, the project has long been considered as a prime location for new housing development.  According to the DRM model, adding 274 new households near the Rhode Island station would increase boardings by 144 passengers in the AM peak.  The same development at the New Carrollton station, however, would have added only 52 passengers.  This is because, compared to New Carrollton, the Rhode Island Avenue station has better job accessibility and more frequent transit service, and is thus likely to stimulate more transit ridership. Read more…

2014 “Metrobus Survey” Complete

August 5th, 2015 Comments off

Metro is pleased to announce that the 2014 “Metrobus Survey” is officially complete. Stay tuned for results.

30s buses 081514

Read more…

Categories: Planning Studies Tags:

Imagining Metrobus 2.0

October 20th, 2014 23 comments

Metro is re-imagining the region’s bus network to improve travel times, enhance connectivity, and deliver service cost-effectively.

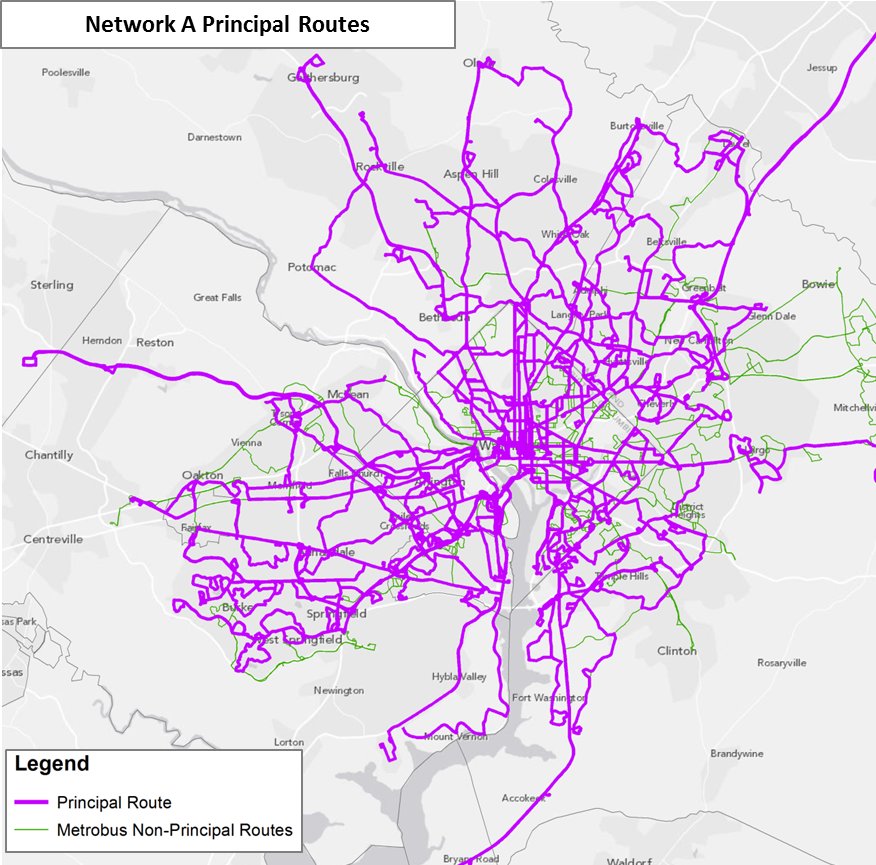
Network A - Principal Routes

Over the past year, as part of the Metrobus Network Effectiveness Study, Metro began exploring potential future Metrobus restructuring scenarios based on the region’s growth trajectory over the next two decades. The scenarios also reflect the market segments where Metrobus can be more effective — places like the urban core, activity centers, and major arterial streets. Planners took the Metrobus network in the region’s Constrained Long-Range Plan (CLRP) for 2030 as the basis of comparison and formulated several network restructuring alternatives. This post will introduce the alternative networks, while future posts will present the performance of the networks, as well as a completely new proposed network built from the ground up. The flow chart below illustrates the network alternatives, followed by a brief explanation about each alternative.

Read more…

Where are the Late Night Metrobus Riders?

August 27th, 2014 1 comment

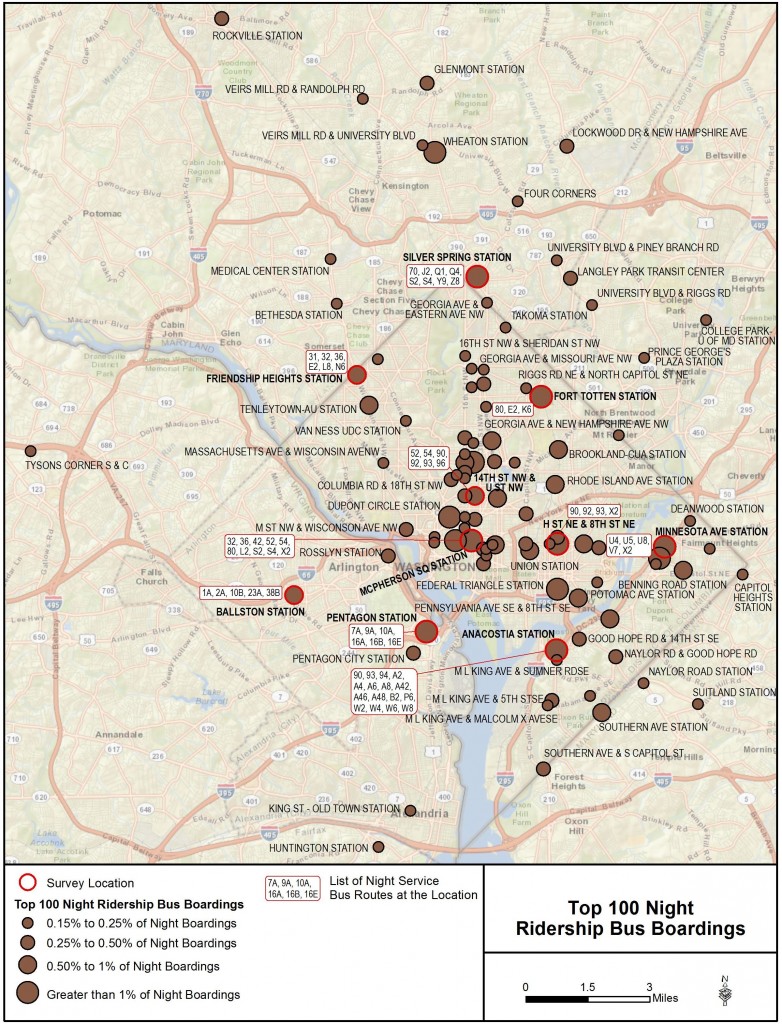
The majority of late night bus boardings are in DC, focused along the 14th/16th Streets NW corridor.

As we’ve mentioned before, Metro is conducting a study examining late night bus service in the region.  An initial step was to assess where the late night boardings are happening in order to determine which might be the best locations to focus in-person survey efforts.  Below is a map showing the locations of the top 100 locations where riders board Metrobus from 11pm-4am each night.  Rather than reflecting the total ridership of a stop, the magnitude of the circles on the map reflect that location’s share of overall late night bus ridership.

Top 100 Late Night Metrobus Boarding Locations

Top 100 Late Night Metrobus Boarding Locations*

Some notes on the map:

  • Almost all of the major bus boarding locations (those with more than 1% of the total) are at Metrorail Stations, even though Metrorail stops operating just one hour into the late night period on weeknights.
  • Not surprisingly, most of the boardings are in DC, many of which are concentrated in the 16th/14th St NW corridor from downtown to Columbia Heights.
  • The data only reflect Metrobus boardings, so if boardings on local operators such as DC Circulator are added, the total numbers of late night bus boardings would be higher than what is shown here.
  • Of course this only tells us where the riders are boarding, not necessarily where they’re going; we are investigating that as part of the study.

What do you see that stands out?

* Note that Southern Avenue Metro Station replaced 14th & U Street as an in-person rider survey location.

Categories: Metrobus Studies Tags: , ,

A Half-Mile Walk to the Nearest Metrorail Station, Mapped

August 4th, 2014 21 comments

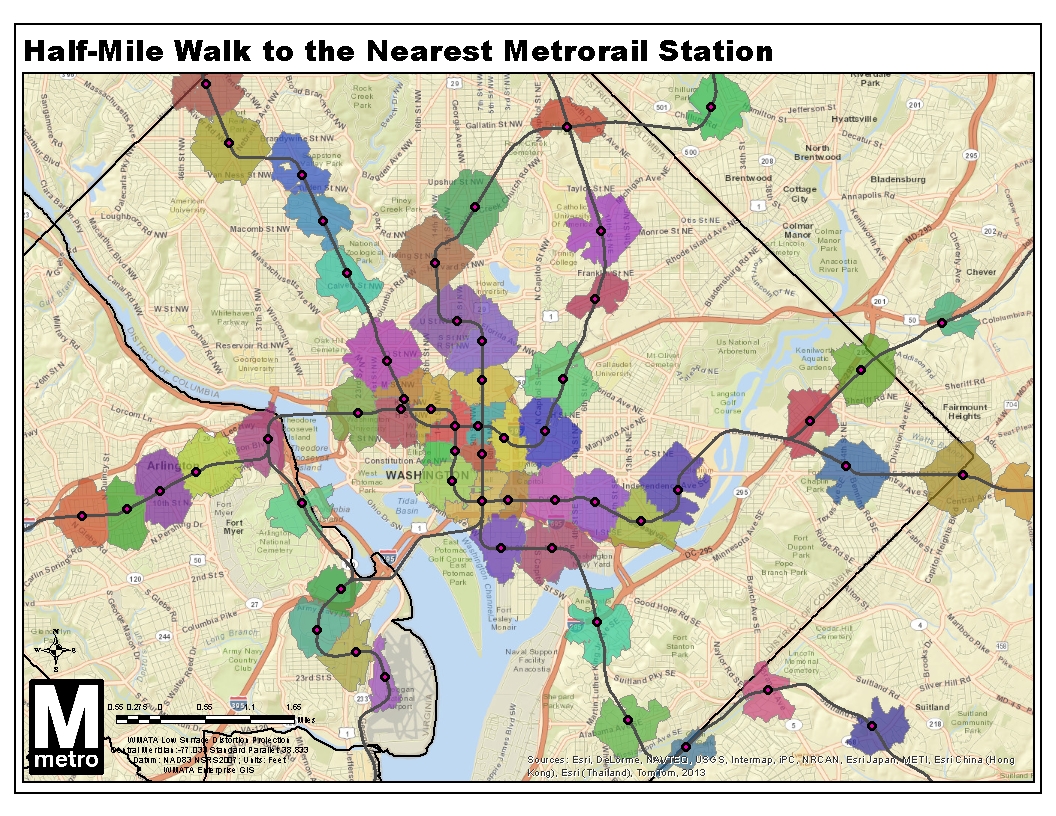
Here’s a map showing the walkable area around the nearest Metrorail station.

eGISBaseLTR_RailPedSheds NonOverlap

Did you ever wonder which Metrorail station is closest? Where’s the breakeven point between two stations? This map shows the areas you can actually reach within a half-mile walk along the roadway network, as we described previously. The twist this time is that I disallowed “overlap” within the GIS network analysis, so land is allotted to the closest station only, calculated by network walk distance.

What do you see in this map?  Here’s a regional view with all stations, as well.

Update 9/2/2014: the GIS source file for this map is now available for download, in geodatabase (.gdb) format.

Study Recommends New Mezzanine to Connect Red/Purple at Silver Spring

July 10th, 2014 3 comments

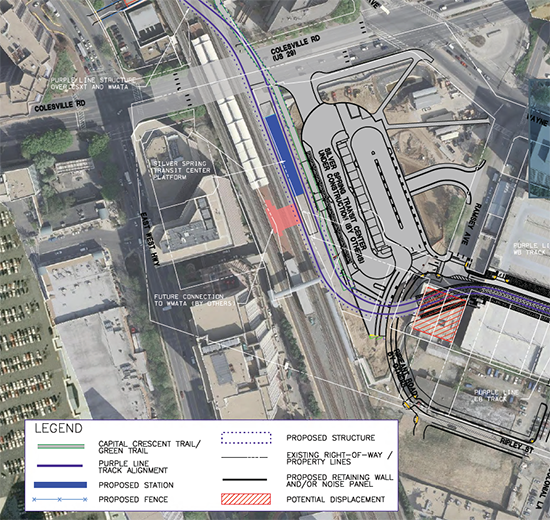
To handle future ridership demand, Silver Spring may need a new mezzanine to connect Metrorail to the planned Purple Line light rail station.

Last year, we began a study looking at potential station capacity issues at Silver Spring.  The assessment determined that the demand at the Silver Spring Metrorail station (entries and exits) is adequately served by the existing station infrastructure.   Since then, the study has assessed the future conditions that will be impacted both by ridership growth due to growth of jobs and households in the station area, but also the arrival of the Purple Line light rail to Silver Spring.

Purple Line station and potential Metrorail connection at Silver Spring.  Source, purplelinemd.com, PDF.

Purple Line station and potential Metrorail connection at Silver Spring. Source, purplelinemd.com, PDF.

The Purple Line station at Silver Spring is planned as an elevated platform and mezzanine, with the mezzanine connecting to the top floor of Silver Spring Transit Center, Metropolitan Branch Trail, and  Ripley Street to the south.   The elevated light rail platform will be approximately 80 feet above the street, about the height of the current MARC pedestrian bridge.  The MTA design team envisioned a possible direct connection between Metrorail and the Purple Line, as illustrated in the red shape in the center of the above image.  Without such a connection, riders transferring between Metrorail and the Purple Line at Silver Spring would have to descend those 80 feet to the ground level, enter an existing Metrorail mezzanine, and then ascend again to the Red Line platform. Read more…

New Blue Line Connections Revisited

July 3rd, 2014 25 comments

A recent Metro study determined that a Rosslyn bypass is infeasible but a second Metrorail station in Rosslyn to restore frequent peak period Blue Line service is possible.

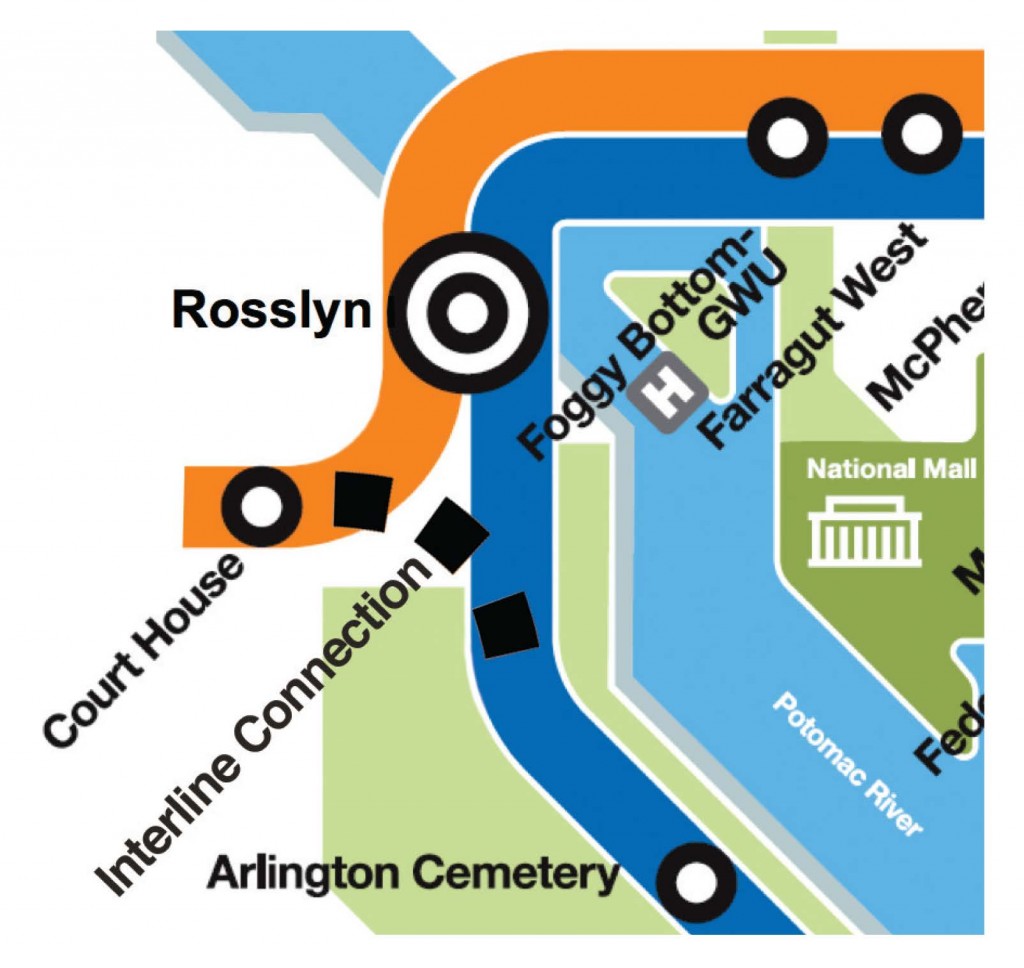
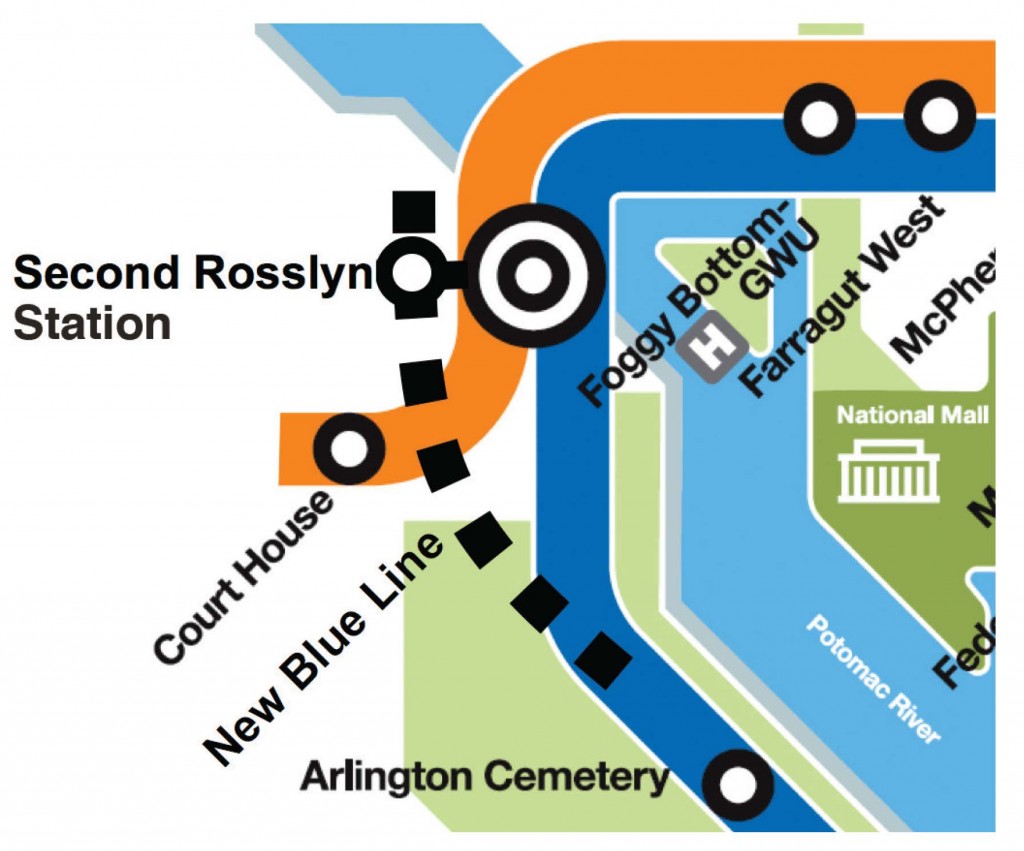
In a post last year describing the strategies in Metro 2025, we described some options for new Blue Line connections.  The first was a Rosslyn bypass that would allow some Blue Line trains to connect directly to the Orange Line at Court House.  The second was a second Rosslyn station that would connect to the current Rosslyn station via an underground walkway.  Both of these options, illustrated in the graphics below, would allow increased frequencies on the Blue Line during peak periods.

Graphic for Rosslyn Interline ConnectionGraphic for Second Rosslyn Station

Metro recently completed a study that evaluated these two options (pdf).  The bad news is that the Rosslyn bypass (interline connection) was deemed infeasible.  This is due to the location of building foundations and the turning radius required by the track.

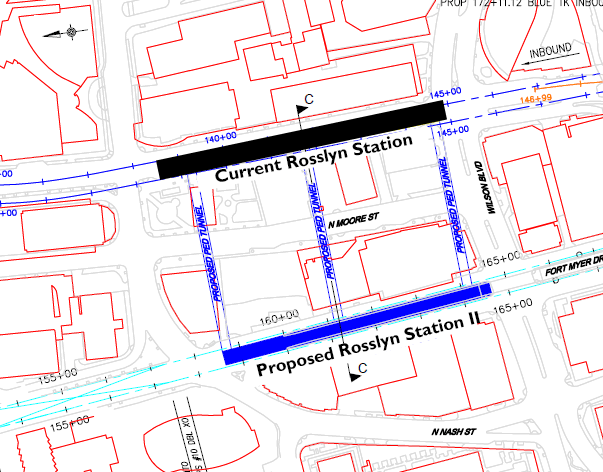
However, the second Rosslyn station was deemed feasible, as illustrated in the map below.

second_rosslyn

Location for a proposed second Rosslyn Station, including three potential options for a pedestrian walkway.

This new Metrorail station would connect to the current Rosslyn station via one underground walkway.

Metro Office of Planning is submitting the second Rosslyn station for project development funding.


Less Stop, More Go: The 23 Line

June 2nd, 2014 4 comments

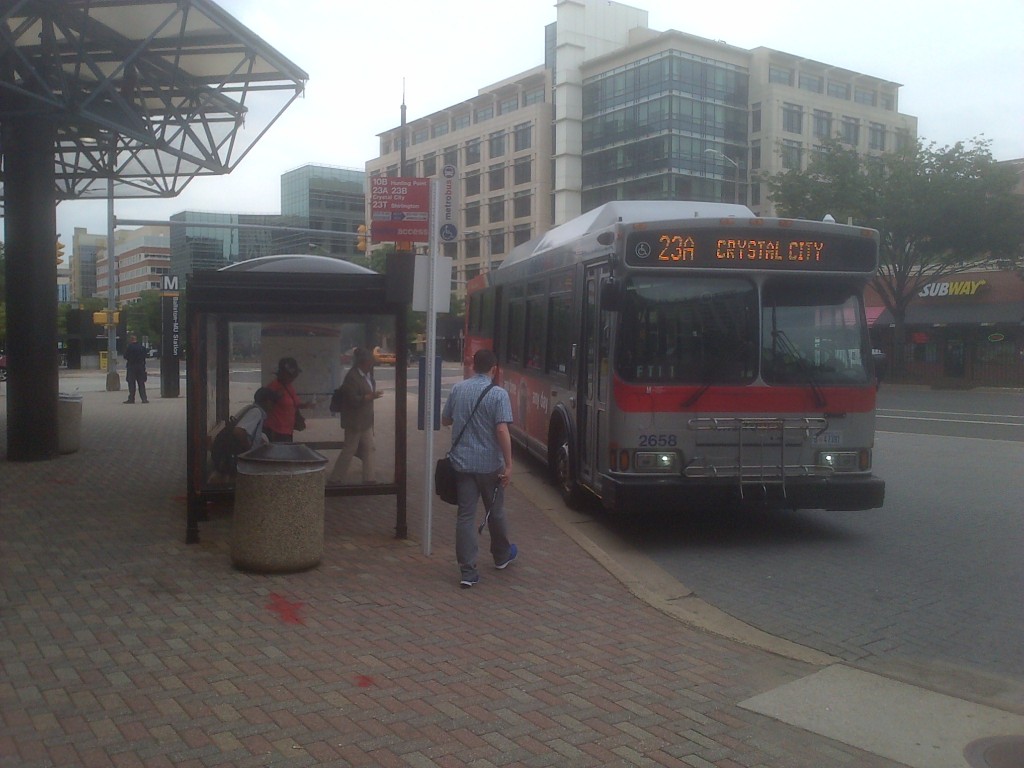
Customers boarding the 23A at Ballston

Customers boarding the 23A at Ballston

The distance between stops is of key concern to Metro and its customers. More closely spaced stops provide customers with more convenient access, as they are likely to experience a shorter walk to the nearest bus stop. However, closely-spaced stops are also likely to result in a longer ride for customers because of the number of times the bus stops — to decelerate, come to a complete stop and then accelerate and re-merge into traffic — is increased. This also can lead to increased fuel and maintenance costs.

Having fewer stops along a bus route benefits passengers not only by reducing the time it takes for them to make their trip, but by making the service more reliable and predictable.

Read more…