Metro needs to invest $17B over 10 years to achieve and maintain a State of Good Repair.
In June 2016, we introduced the initiation of the 2016 Capital Needs Inventory (CNI), with the goal to develop a list of fiscally unconstrained and prioritized investment needs over the next ten years and to meet the new federal Transit Asset Management (TAM) requirements. After seven months of rigorous work, the first phase of the CNI is coming to a completion!
CNI Final Report (click for link to PDF)
What distinguishes this CNI from Metro’s efforts in previous decades? Breakthroughs on several fronts:
- It represents the first time that Metro developed a ground-up, data-driven and FTA-compliant method for asset prioritization.
- It consolidates asset data sources and builds a complete asset inventory database that catalogue higher-level assets and asset features.
- It estimates asset condition (and need rehab/replacement date) based on measurable data such as age of asset and history of rehabilitation, and projects replacement and rehabilitation needs to advance a State of Good Repair (SGR).
- It establishes a prioritization methodology aligned with Metro’s strategic goals and priorities and uses FTA’s TERM (Transit Economic Requirements Model) to prioritize all asset needs.
Here is a sneak peek of the CNI:
Read more…
February 23rd, 2016
Wendy
At the 2016 TRB Annual Meeting last month, Metro, together with DDOT and AECOM, presented the H and I Streets Bus Lanes as a case study of a bus lane in a downtown environment. TCRP Report 118 concluded that arterial bus lanes, ranging from low-cost restriping of existing lanes to new bus lanes, could offer 12-57% reliability improvements.
The presentation, built upon the 2013 study – H and I Streets Bus Improvements, highlighted the need for actions for all users and provided a range of improvement options for the H and I Streets corridor through downtown DC. We discussed details of the bus lane alternatives and benefits back in November 2013, and in the study’s final report (PDF). Here is a snapshot of the alternatives considered in the study:
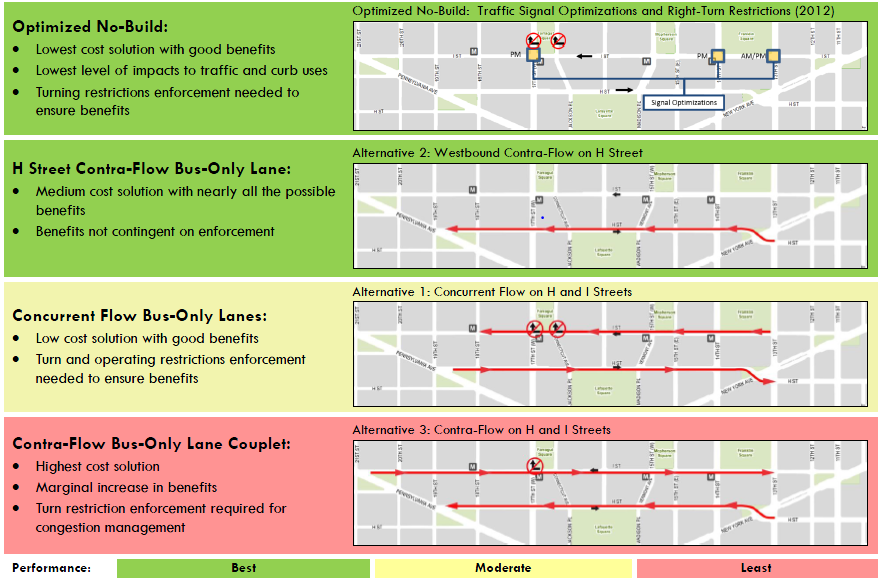
Summary of Alternatives, click for a larger version.
The TRB session participants were interested in the status of the study recommendations, and raised a big question on how to solve bus delays in a large downtown area including river crossings. The good news is that DDOT is including the bus lane alternatives in a new study — more details soon — that aims to improve the urban design and enhance the streetscape along Pennsylvania Avenue between 17th St. NW and Washington Circle. The DDOT study intends to assess the operational feasibility of the contra-flow bus lane on H Street – the best performing bus lane alternative in the 2013 study. This study will be initiated in 2016.
Stay tuned.
Update, 2/25/2016: The paper has been accepted for publication in the Transportation Research Record, Journal of the Transportation Research Board.
The 95th Transportation Research Board (TRB) annual meeting is coming to town! This annual meeting will host 12,000 transportation professionals from around the world and more than 5,000 presentations covering all transportation modes, including public transportation. At the 2016 annual meeting, Metro staff will be sharing Metro’s experience and best practices on a number of transit development and planning initiatives.
Jordan from the Office of Performance will introduce the development of a new performance measure of travel time reliability (Event 823: Where is My Ride?). This new measure can be used by customers to better plan their trips and by Metro to optimize rail operations. Read more…
November 18th, 2015
Wendy
Metrorail ridership isn’t only about rush hour! Here’s a deeper look at why off-peak riders travel, and what segments are most traveled.
You may not be surprised that the peak period travel on Metrorail is dominated by commuting and business related trips. Every day from opening to 9:30am, nearly 90 percent of passengers travel to work and business. However do you know that over almost a third of daily ridership takes place in the off peak? This post explores what is happening during weekday off-peak periods.
The weekday “off-peak” time typically refers to the weekday midday period (9:30am to 3:00pm) and the weekday evening period (from 7:00pm to closing), excluding late night service on Friday and Saturdays between midnight and 3:00am. In recent years, weekday off-peak travel demand has remained stable at 32 percent of the daily ridership, with the midday ridership at 19-20 percent and the evening ridership at 12 percent.
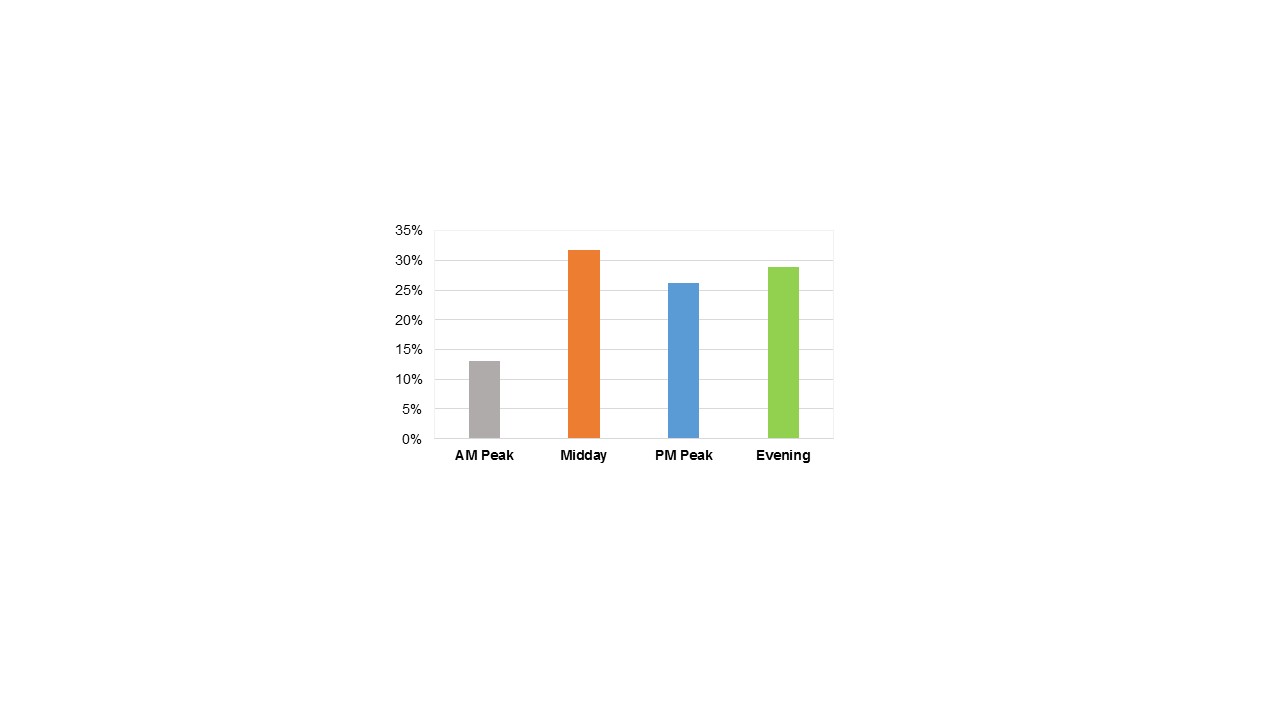
Most non-work trips, such as personal, recreational, and shopping trips, occur during the off-peak times and are spread fairly evenly between the midday and evening, as illustrated in Figure 1.
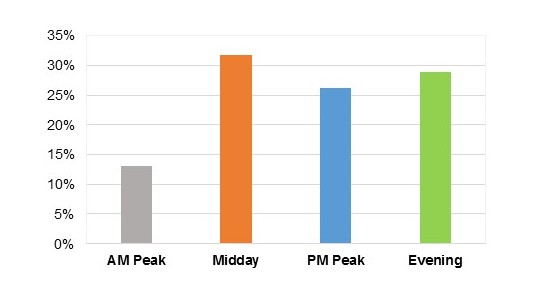
Figure 1: Percentage of Non-Work Trips by Time of Day (2012 Metrorail Passenger Survey)
The off-peak, non-work travel market has showed strong growth between 2007 and 2012 (our last two passenger surveys where we can distinguish between work and non-work travel). According to the Metrorail passenger surveys, off-peak non-work trips grew by 15 percent for the midday and evening from 2007 to 2012, higher than the 9 percent increase in the daily non-work trips. Read more…
Metrobus has a strong identity as a regional transit provider, but as the region has grown it hasn’t kept up with changing development patterns. Does the regional role of Metrobus need to be rethought?
A previous post described the historical context of Metrobus as a regional bus service provider, as well as the Metrobus regional service criteria developed by a regional “Blue Ribbon Mobility Panel” in 1997. What has happened to the Metrobus regional service since the 1998 Board action? Does today’s regional service still meet the original criteria? Metro’s planners recently conducted an assessment to address these questions.
Majority of “regional” Metrobus service performs well
Overall, Metrobus regional lines provide higher levels of service and achieve higher cost efficiency than non-regional lines. Currently Metrobus operates 106 regional lines and 55 non-regional lines The overall higher ridership of the regional lines resulted in an average operating cost of $3.50 per passenger trip, lower than the non-regional service at $4.50.

Read more…
Metro is re-imagining the region’s bus network to improve travel times, enhance connectivity, and deliver service cost-effectively.
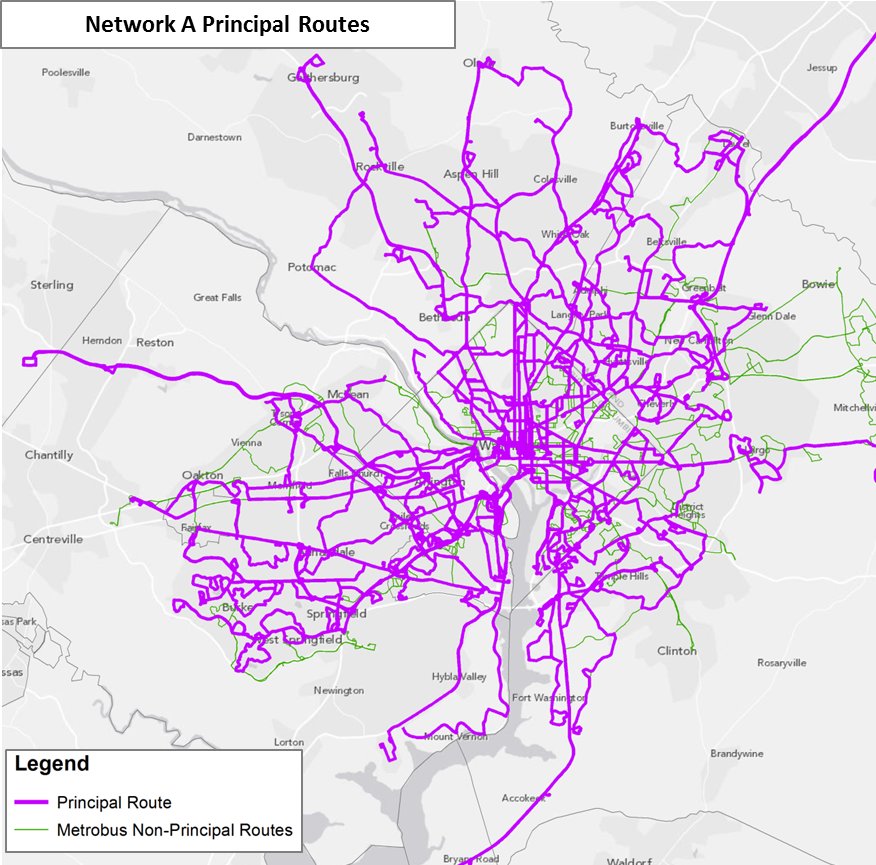
Over the past year, as part of the Metrobus Network Effectiveness Study, Metro began exploring potential future Metrobus restructuring scenarios based on the region’s growth trajectory over the next two decades. The scenarios also reflect the market segments where Metrobus can be more effective — places like the urban core, activity centers, and major arterial streets. Planners took the Metrobus network in the region’s Constrained Long-Range Plan (CLRP) for 2030 as the basis of comparison and formulated several network restructuring alternatives. This post will introduce the alternative networks, while future posts will present the performance of the networks, as well as a completely new proposed network built from the ground up. The flow chart below illustrates the network alternatives, followed by a brief explanation about each alternative.
Read more…
September 22nd, 2014
Wendy
Local leaders are set to commit to Metro’s long term state of good repair needs for the first time through the region’s transportation plan, but the plan omits key investments that are critical to solving some of the region’s most critical needs.
This fall the region’s transportation leaders will approve an update the Constrained Long Range Plan (CLRP) financial plan, required by federal law every four years, to ensure the region’s ability to pay for transportation expenditures with reasonably anticipated revenues. During the 2014 update, Metro collaborated with staff from the Transportation Planning Board (TPB), the region’s Metropolitan Planning Organization, and the three state DOTs to identify funding for the system’s long-term operations and maintenance (O&M) and capital needs. The draft plan, which expresses the region’s major transportation priorities, is scheduled to be adopted by the TPB on October 15th.
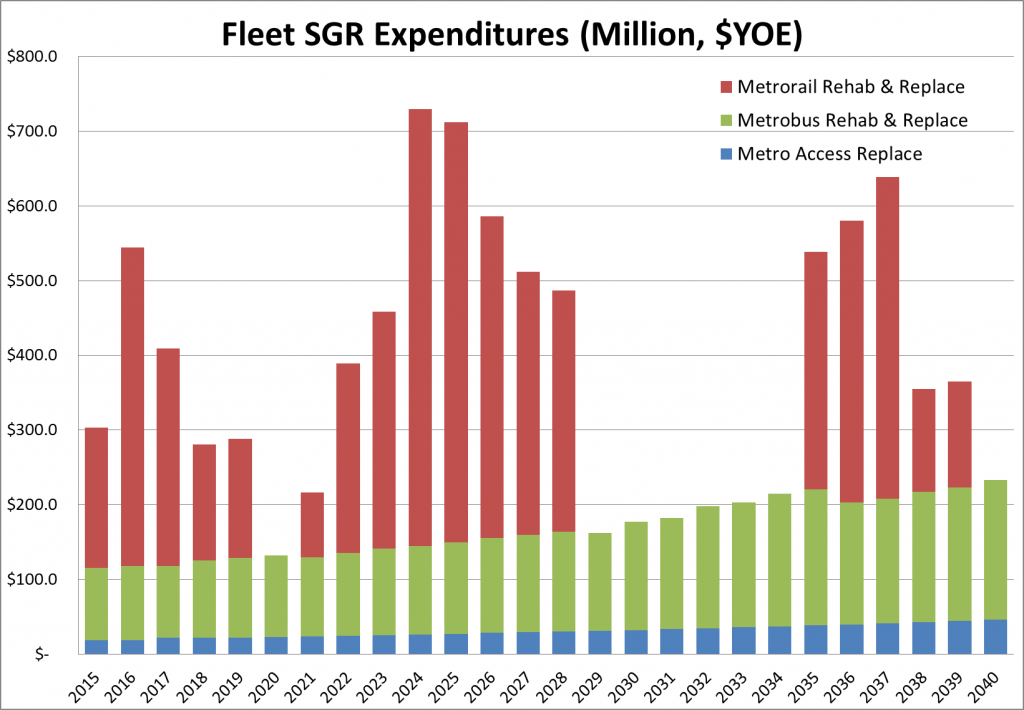
Projection of Metro’s future fleet State of Good Repair (SGR) capital needs
Read more…
November 14th, 2013
Wendy
Metro has released the final technical report of the H and I Streets Bus Improvements Study, making a compelling case for traffic management improvements and bus lane alternatives in the region’s most heavily traveled bus corridor.
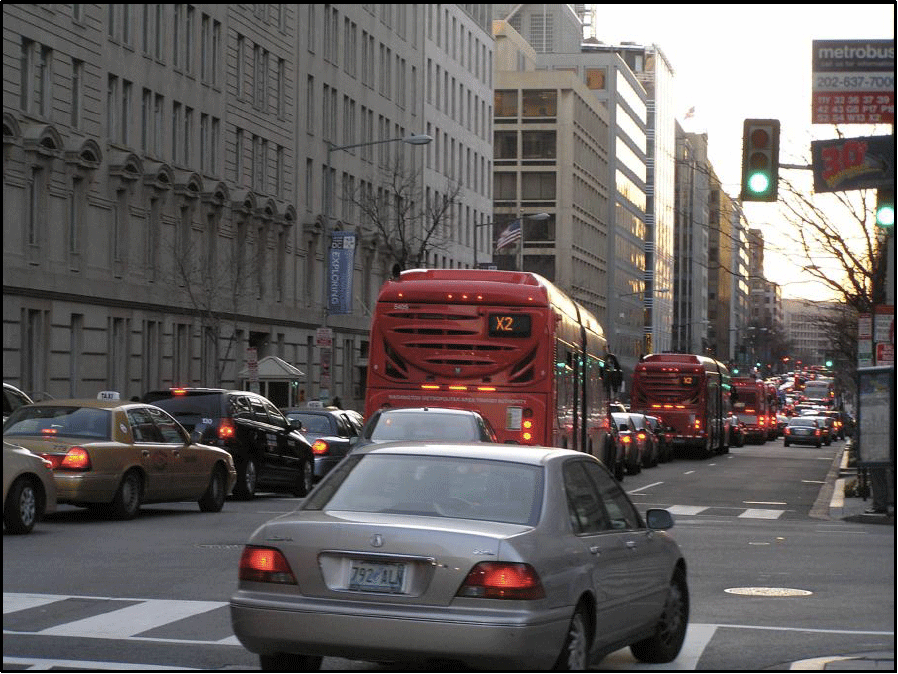
Congestion on I Street caused by bottleneck at 17th Street, creating long queues backing up to 15th Street.
DC’s downtown core is a vibrant community, with 380,000 jobs today and significant residential and retail development in the coming decade. While growth will transform the core and create opportunities, it is likely to increase the burden on the transportation network that is already strained by the closure of Pennsylvania Ave.
Today, all users—drivers, bus passengers, pedestrians and bicyclists—experience congestion during peak periods. Besides high-volume traffic in the corridor, the constant friction among buses, vehicles and delivery trucks further aggravates travel experience. For bus passengers, the current corridor congestion severely affects travel time and service reliability—a short bus ride on I Street from 13th St to 19th St could take more than 10-15 minutes during rush hours.
Metro and DDOT collectively launched the H and I Streets Bus Improvements Study last year to explore bus improvements on H and I Streets NW in the downtown core, the region’s most heavily traveled and most productive bus corridor. The study investigated traffic management improvements and bus-only lane options with the objective of providing reliable and efficient bus service and alleviating Metrorail core congestion through innovative surface transit improvements.
The technical report is available for download (PDF) and posted on Metro’s Planning and Development webpage.
Four bus improvement options developed for analysis, as described and illustrated below: Read more…
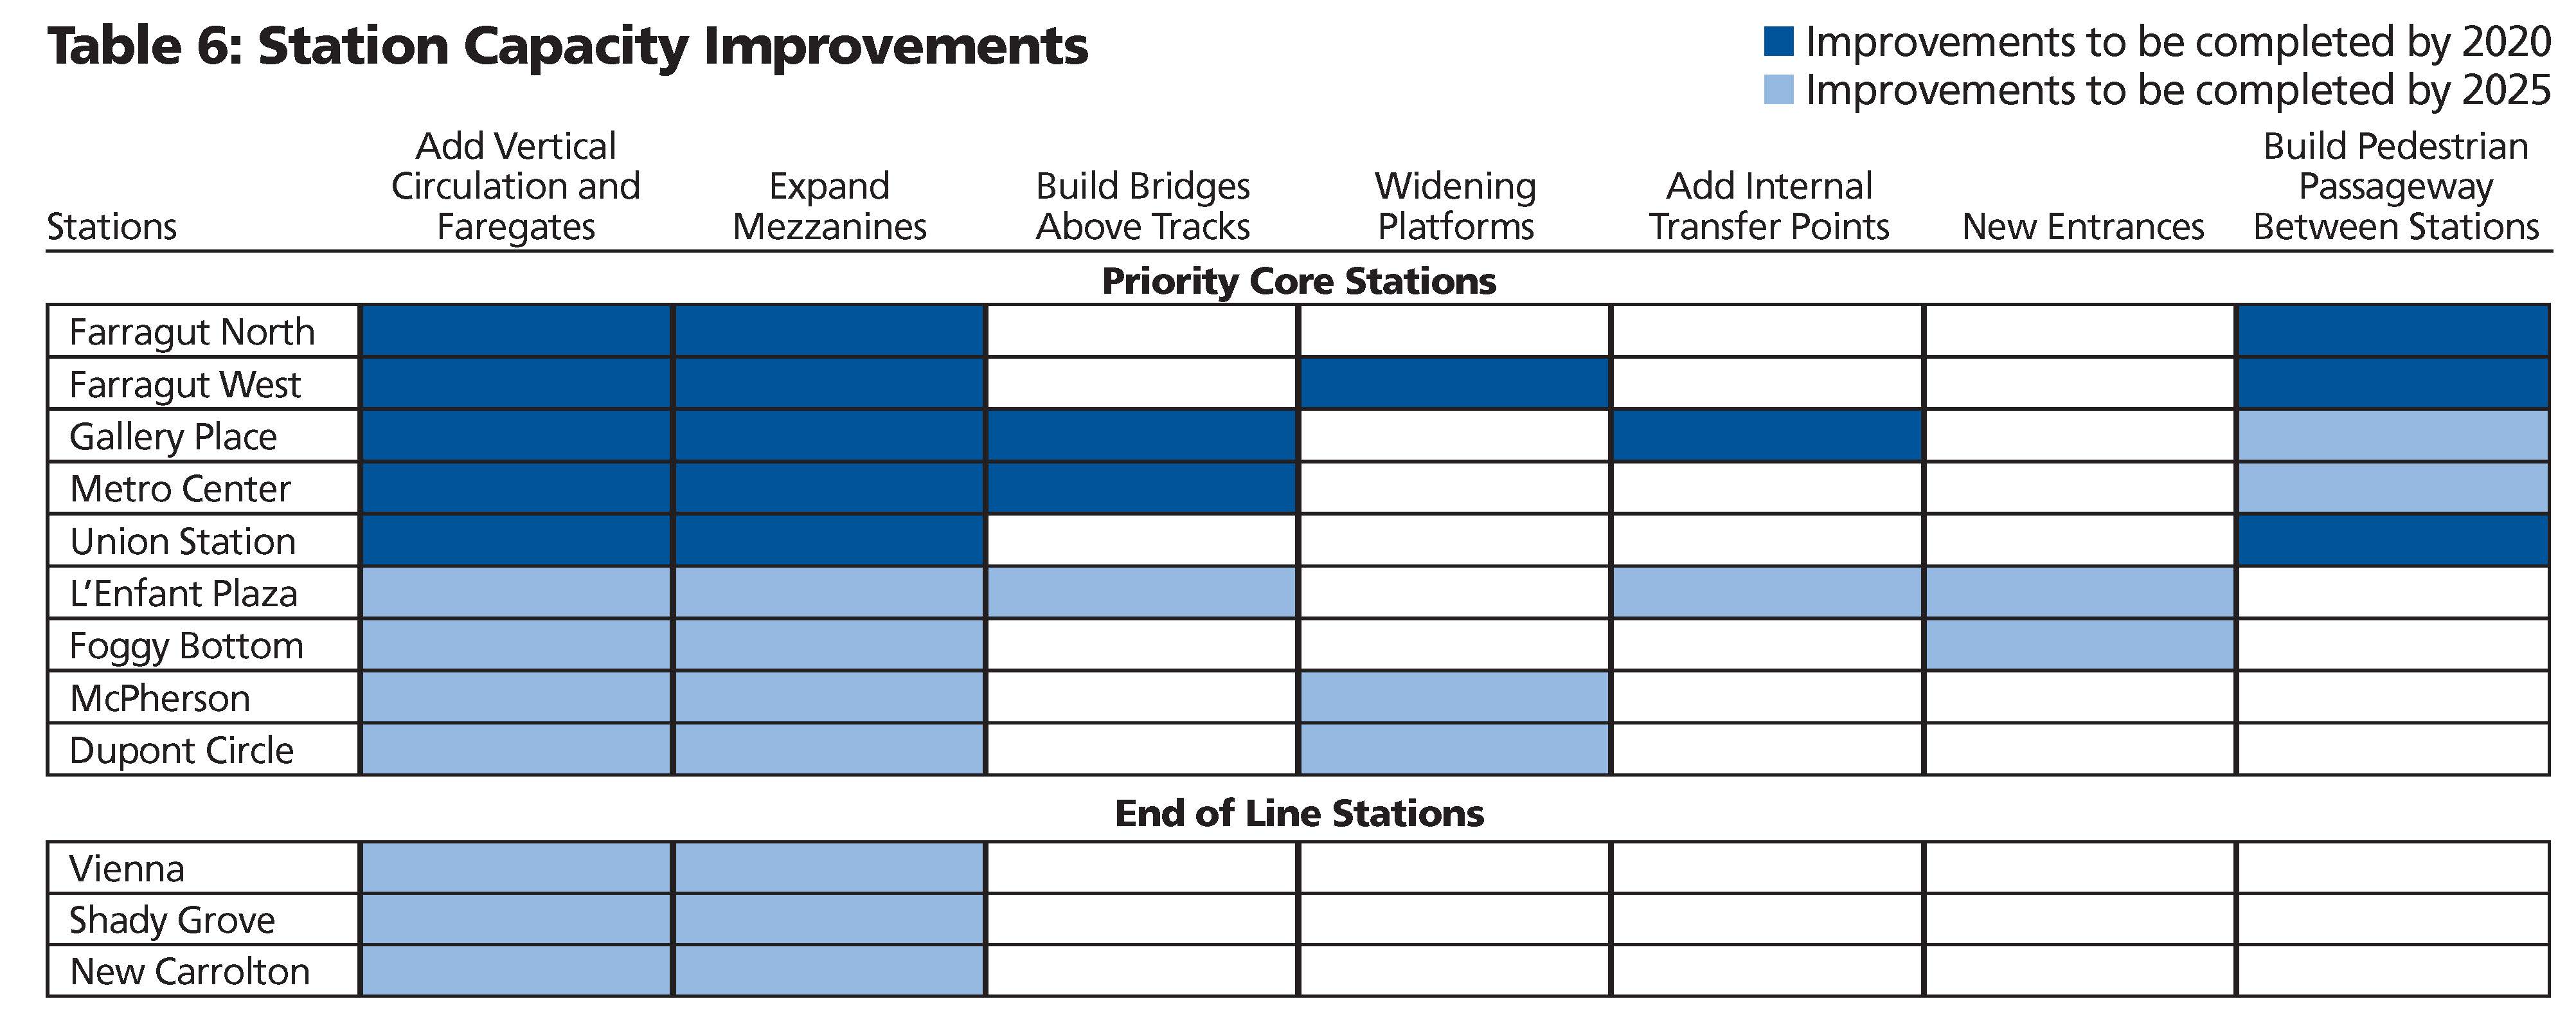
Improving and expanding capacity at high ridership stations will ensure safe and efficient operations and facilitate passenger movements from street-level to platform as well as transfers between lines. The proposed stations, most of which are in the system’s core, already experience crowding or would reach capacity by 2025. Proposed improvements vary from adding escalators and stairs to building pedestrian passageways connecting platforms within a station and between stations.

December 21st, 2012
Wendy

Photo of a 1969 1968 map of DC Transit System Inc routes. Many routes listed here are still running today.
WMATA bus began operations in 1973, when it consolidated the four Washington-region bus operators under one system and brand. As many commented in MindMixer, many of these lines were originally streetcar lines established in the late 19th century and majority of services were based in the inner areas.
The inclusion of old streetcar lines in the current Metrobus network informs a rich history about natural progression of transit network and the interaction between urban development and transit investment. The century-old streetcar investment helped develop those areas and transform them into transit-friendly markets. In return, these areas and corridors are among the most transit supportive markets today, generating high bus ridership.
Over the past 30 years, strong growth in jobs, population and urban development in the DC region continued to demand the expansion of bus transit service from the central core to suburbs, from traditional activity centers and corridors to the new or emerging local centers and corridors, some of which are near or beyond the edge of Metrobus market. Metro currently operates nearly 300 revenue bus routes organized into approximately 150 lines throughout the jurisdictions in the Metro compact area.
To better understand how the current Metrobus system serves travel needs in the DC region, Metro’s planners are conducting the Metrobus Market Effectiveness Study to identify market constraints and opportunities for Metrobus, and most importantly, strategically position Metrobus toward building an effective network that can better serve current and future demand, enhance productivity and efficiency, and improve integration between Metrobus and local services.


Recent Comments