Author Archive

Returning Metro’s Assets to a State of Good Repair

January 3rd, 2017 Comments off

Metro needs over $17B in the next ten years to reach and maintain the State of Good Repair (SGR), which accounts for approximately 70% of its total needs over the same period.

As noted in our our previous post, Metro’s SGR needs are built off of a comprehensive inventory of existing assets as a part of the Capital Needs Inventory (CNI). Each record in this inventory documents the asset’s type, age, expected life, replacement cost, and other attributes required to assess that asset’s 10-year reinvestment requirements. SGR investments include:

  • Rehabilitation that require capital maintenance (including major overhauls, renovations, or rebuilds)
  • Replacements
  • Annual capital maintenance (generally occurs for larger assets such as tunnel or bridges, which require periodic infusions of capital to maintain SGR).

Fig. 1: Risk profile of SGR needs (assets > $10M)

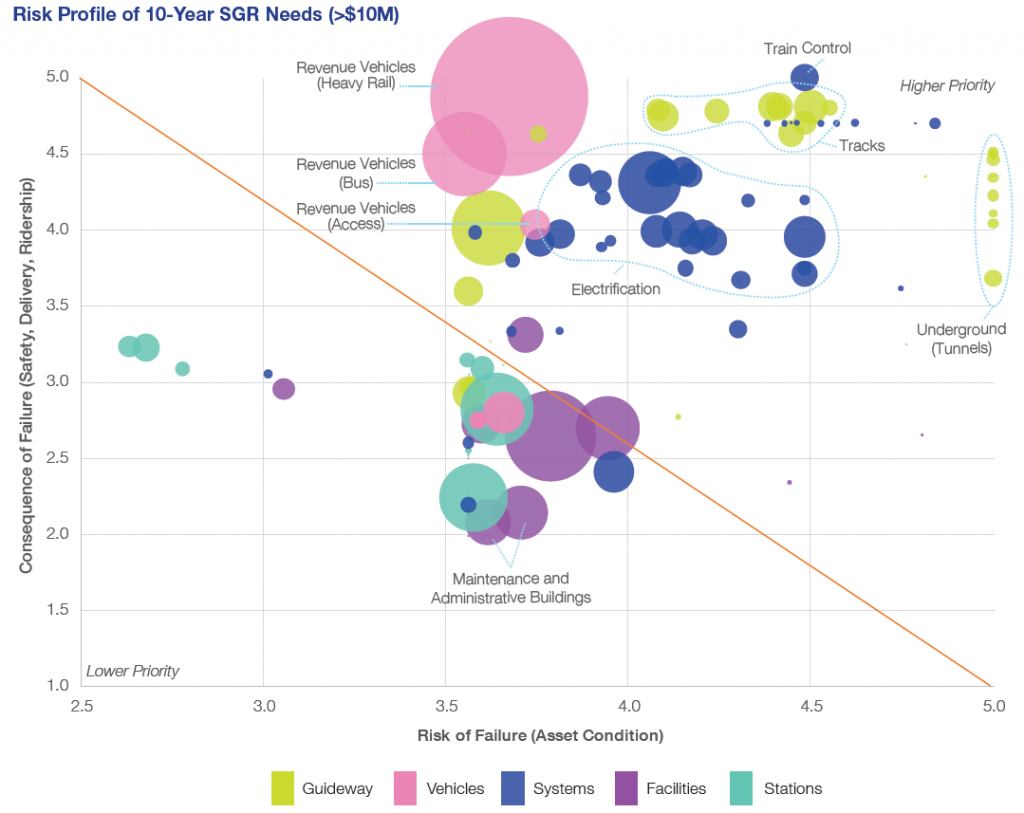
Fig. 1: Risk profile of SGR needs for assets > $10M (click for full report)

After being inventoried, the existing assets then went through the prioritization process using the risk-based prioritization approach, as described in Ramona’s blog post.  Figure 1 illustrates the risk profile of SGR investment needs for assets exceeding $10M, based on the risk of failure and the consequence of failure. The asset groups above the diagonal line carry a higher level of risk and have bigger impacts on safety, reliability, and ridership.

Ten-Year SGR Needs

Given the 10-year SGR needs total to $17B alone, what are some of the major investments that are involved?

  • Railcar Replacement and Rehabilitation Program: $5B over the next 10 years, which is about 28% of total SGR needs.
  • Track and Structure Rehabilitation Program & Rail Systems Program: $3B each, to reach and sustain SGR. The combined $6B for both programs will cover fixed rail, guideway structures, track maintenance equipment, electrification, communications, signals, and other related assets.
  • Bus & Paratransit Program: $2.3B for fleet, facilities, and maintenance equipment.
  • Stations and Passenger Facilities Program: $2.4B to improve or upgrade platforms, station structures, vertical circulation, fare collection, and parking facilities.
  • Business Support Program: $1.7B to maintain and upgrade software and hardware, supporting equipment and services, as well as the Metro Transit Police Department’s assets.

Fig. 2: Total current SGR backlog

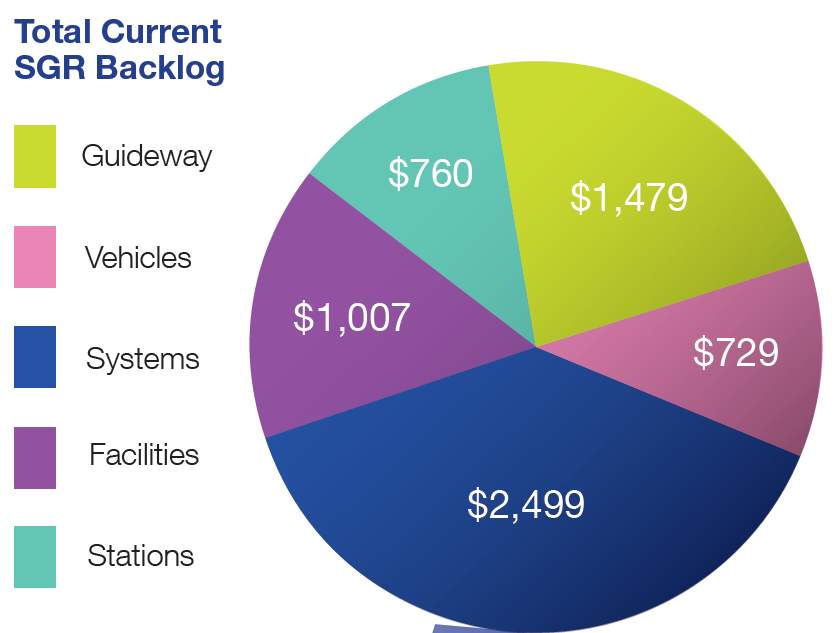
Fig. 2: Total current SGR backlog (click for full report)

Backlog and Compliance Needs

Metro’s SGR needs include $6.66B in backlog, also known as deferred asset needs. The assets in the backlog require immediate reinvestment as they are past their useful lives or require rehabilitation or replacement due to compliance issues. Metro’s backlog needs make up approximately 16% of Metro’s total asset base across all asset categories. The largest proportion of backlog are in major systems such as traction power and train control (Figure 2) with guideway elements (i.e., track, tunnels, bridges, and other structures) making up the next largest portion of deferred needs. About 30% of the backlog are compliance based investments such as safety directives to replace track circuits and improve tunnel ventilation. These items, totaling $2B in needs, have been marked as priority as they are needed to address compliance and/or regulatory requirements.

Scheduled SGR Needs

Over the next ten years, different assets will be due for scheduled SGR investments. For example, besides the ongoing replacement of the 1000- and 4000-series rail cars, Metro will need to complete the replacement of the 2000-, 3000-, and 5000-series rail cars during the period of the CNI, along with rehabilitation of all fleets to maintain SGR.

Given that Metro’s capital budget averaged $1B a year for the past six years, maintaining assets in a SGR as identified by the CNI would require an annual average of $1.7B in the capital budget – a 62% increase above today’s level. To support CNI’s SGR investments, Metro would need the region to significantly increase funding to execute these important needs and keep Metro healthy into the future.

What do you notice in this list of repair needs? Are there any surprises?

Safety First!

February 10th, 2016 Comments off

It’s a new year! Let’s vow to stay safe when around Metrorail and Metrobuses!

Denver RTD recently partnered with Metro Trains of Melbourne (Australia) to remind its riders to be safe.  They used the characters and theme song  (“Dumb Ways to Die”) developed by Metro Trains to appeal and get their message across to their younger riders, who often fail to pay attention to safety messages otherwise.  The original video/song, when first released, became the world’s most shared video for awhile in November 2012! Also, Melbourne saw a 20% decrease in accidents after the song became a hit around the country. Along with the video and song, posters were created, as were books, which all asked for people to pledge to be safe around trains.  Check out the Denver safety video:

Relating back to Metro, Metro would like to remind everyone that safety is its number one priority. Please review Metro’s safety tips.

Here are some key tips when it comes to direct accidents with trains and buses. If someone is standing too close to the curb or the edge of the platform in an unsafe manner, please inform a Metro uniformed employee or police officer immediately. Metro police can be reached at 202-962-2121 or by texting ‘MyMTPD’.  Metro’s suicide hotline is posted on the signs: 1-855-320-LIFE (5433).   If you drop something in onto the tracks, never retrieve it yourself. Ask for help. Check out New York City Transit’s message relating to falling into the path of a train.


Also, in light of recent winter weather, be careful when walking to and from the bus stop and rail station. Do not run in the stations. The floors can be very slippery, and remember that there is always another train. There is no need to push people out of the way, and run after a train, or bus, for that matter. Always face forward on escalators, and hold onto the handrails. Watch out for loose clothing or footwear that could get caught in the moving parts of the escalator.

Last but not least, if someone is sick or not feeling well, it’s best for them to get off the train or bus and seek help. Help can come sooner when they are at a rail station or bus stop.

Would Metro riders like to see WMATA develop more safety video messages? What type? What are the unsafe behaviors you see the most? We would like to hear your input.

Categories: In The News Tags: , ,

When in Hamburg, Germany…

February 3rd, 2016 1 comment

If you ever find yourself in Hamburg, Germany, then you must visit the Miniatur Wunderland.

This is the world’s largest miniature train exhibit, and it is definitely a ‘must-see’ for train lovers. As of September 2015, it had over 13 kilometer of tracks.  Additionally, multiple countries and regions are represented in the settings, including Germany, Austria, Switzerland, Scandinavia, and the US. This entire model setting took over 500,000 hours to create.  There are 900 trains and 1,200 train cars, with the longest train being 14.51 meters long.

If you don’t have the time, or money, to make a visit, you can check out the video below to see how complex the Wunderland is.

Below are some up close shots from 2005. This exhibit is continually changing and growing, so no two visit are alike. What is impressive about this exhibit is the fact that not only are trains in constant motion, there are also wireless controlled vehicles moving about. The exhibit also squeezes in some humor with hidden quirks for those who are observant.

What are some of your favorite train/bus related museums?


Monitoring Passengers Loads on Metrorail – Using New Tools to Examine the Data

January 5th, 2016 8 comments

The new version of the Line Load Application now models passengers into trains by cars. Let’s take a look at this new feature!

Remember in May when we said an updated version of the Line Load Application was coming that would include passenger distribution data at max load locations? Well it’s here now!

If you’ve seen Metro employees with clipboards out during rush hour at major stations, then chances are you’ve seen the Metro load checkers. These individuals mark down the loads of these trains. They also mark down any people who didn’t board. Last but not least, they are also doing this by car, and with that information Metro has been keeping track of the spread of the loads on the cars at the max load stations.

carloads

Average Car Loads in the AM Peak Hour – October 2014 Weekdays – Modeled Distribution of Passengers at Dupont Circle **The estimated railcar crowding is based on the scheduled Red Line service.

Read more…

2014 “Metrobus Survey” Complete

August 5th, 2015 Comments off

Metro is pleased to announce that the 2014 “Metrobus Survey” is officially complete. Stay tuned for results.

30s buses 081514

Read more…

Categories: Planning Studies Tags:

Planning Tool Update Sheds Light on Rail Car Crowding Distribution

May 18th, 2015 19 comments

Latest version of Line Load tool will feature modeled car-crowding numbers.

Many factors influence which car number of a Metrorail train a customer rides.  Infrequent riders may wait for the train near the escalator and board the nearest rail car. Savvier customers may prefer to ensure they are the first to exit at their destination station or have an shorter walk at a transfer station.  Others may board cars based on understanding where seats are more likely to be available.  All of this activity can result in uneven loading of Metrorail cars across a given train, with some rail cars crowded and others near empty.

As we mentioned in 2013, the Office of Planning has an in-house tool that allows planners to estimate how crowded trains are based on origin-destination ridership data. Currently we are in the midst of a few updates, which will include the Silver Line that opened last year.  Another of the new features that we are excited about is a rail car crowding analysis for the system’s most critical segments.  Based on over six months of rail car-crowding data that was collected at selected stations by rail passenger “checkers,” the train-based ridership data will be distributed across the cars so we can estimate what kind of crowding we have by car number, at the peak load points. The following graph illustrates the observed car crowding variations at Gallery Place.

carcrowding

Customers may experience crowded conditions even when the average rail passenger per car (PPC) numbers (PDF) would indicate otherwise. This new feature is an important addition that will help Metro planners better understand the customer experience.  The car crowding analysis will begin to identify which cars of a train tend to be crowded in the peak hours, and which are less crowded.  This information will the be used as a starting point for devising strategies for better spreading customers across all cars of a train.

How do you choose which rail car you ride in?  Other than berthing trains at the center of the platform (see this informative article over at Greater Greater Washington on that topic), what strategies might Metro consider to better balance customers across rail cars?


Astoria’s Old Riverfront Trolley

September 16th, 2014 2 comments

Old freight railroad tracks in Astoria, Oregon become a major tourist attraction, with the installation of an old historical trolley train.

Picture 144

Astoria’s riverfront view of Washington

Astoria, Oregon was once slated to be the largest port on the west coast of the United States. Well situated at the mouth of the Columbia River, there was booming trade — fur trade early on, and later fishing, fish canning, and timber — with its deep water port and connection to the Pacific Ocean. In fact, Astoria had the first US Post Office west of the Rocky Mountains. For about 100 years, from the late 1800s, Astoria was an economic center with its port, but by the mid 1970s, the economy had tanked with the decline of canneries and timber. Read more…

2014 Metrobus Survey is Expected to Commence on March 18

March 12th, 2014 2 comments

Bus Ballston Fall  110811-72

 The 2014 Metrobus Survey will commence on March 18, 2014. This survey will take place during Spring and Fall of 2014 covering every Metrobus route, in all jurisdictions.  If you receive a survey, please fill it out on paper or online. If you have any questions, please ask the surveyor, or feel free to call the toll free number on the survey.

The primary purpose of the survey is to gather data to support operating and planning activities and for calculating jurisdictional subsidy allocations.  The survey is also being conducted to meet Federal Transit Administration’s Title VI regulations.  Metro reports ridership coming from each of the eight jurisdictions in the Metro service area, and the survey provides the most scientific approach to estimate ridership by jurisdiction.

Additionally, we are asking about employer-related transit benefits received by our riders.   The 2014 survey differentiates between fully subsidized and partially subsidized riders, expanding our understanding of how our riders make decisions related to fares.

Our 2012 Metrorail Survey raised a lot of questions that we answered here on PlanItMetro.  We’ve pasted those questions and answers here, as they should be helpful during this year’s Metrobus Survey, as well as some 2014 Metrobus Survey-specific questions.

The last full survey of Metrobus ridership was conducted in 2008.

Feel free to ask any additional questions that we’ve missed in the comments section below and we will try to respond as best we can.

Frequently Asked Questions:

Q: The survey started on March 18, but I haven’t received a form yet.  When will you survey my bus route?

A: This survey uses statistical methods to capture a representative sample of our ridership.  On a given day, survey forms are being given out on selected bus routes.  To ensure that the survey remains statistically representative, we do not disclose the survey schedule to the public. Read more…

Singapore MRT Rail Map Diagrams Show the Way

January 27th, 2014 2 comments

Picture 040

Paya Lebar MRT Station Map (click & zoom for detail)

Picture 041

Travel Times Between Stations

While waiting for a Metro train one day in Singapore, I noticed their rail map diagram had a big white space and then the rest of the map. Upon closer inspection the ‘white’ part was actually a grayed out part of the rail map showing the route the train had already covered. Having that information is very useful, particularly for a traveler unfamiliar with the system. One knows if they are starting at this particular station (Paya Lebar), what their options might be if he/she actually wanted to go in the opposite direction. This information gives the rider a helpful reference point in relationship to the rest of the system.  Also upon closer inspection I saw that the map gave expected travel times between stations. How great is that?

Categories: Transit Travelogue Tags: ,

Courtesy Messages – Singaporean Style

January 13th, 2014 1 comment

I was recently in Singapore for vacation and while I was there I used their delightfully clean and efficient rail system (more on that later). While walking through the stations, I spotted several movie posters, which actually happened to be posters for YouTube-based public information message ‘movies’. The movies are put out by the Land Transport Authority, which is a part of the government that does the planning for their transit systems.

Picture 110

‘May I Have a Seat Please?’

Picture 109

‘Can You Move in Please?’

Can you move in please? leaves viewers with two messages: 1. move to the back of the bus so that everyone can get on, and 2. take off your backpack or move any bags you may have out of the way. Some of the movie is lost in translation I think culturally speaking but still, you get the point.

Excuse me, May I have a seat please? is about exactly what the title suggests. This movie especially rings true in this day and age as a lot of commuters have their noses buried in their books and cell phones (even more prevalent in Singapore – a lot of people walking in stations and outside while watching movies!!).

The courtesy issues that Singapore is tackling rings true here in DC too, as well as any city that has transit.