Search Results

Keyword: ‘Metrorail Rider’

Data Download: Metrorail Ridership by Station by Month, 2010-2015

March 24th, 2016 6 comments

Data_clipSee how seasons, land use, and service drive trends in rail ridership at the station level, in this new data download.

This latest data download shows Metrorail ridership by station, by month, for the last five years or so. It hints at the complex factors driving rail ridership – from short-term effects like weather or service changes, to long-term trends like real estate development and office relocations.

We see a few tidbits in this data:

  • Seasonal trends: rail ridership follows a predictable pattern each year – peaking in the summer and around Cherry Blossoms, and reaching lows around the holidays.  Compare the high seasonality of Arlington Cemetery to a more commuter-oriented station, for example.  Ridership in the summer at that station can quintuple over its winter base.
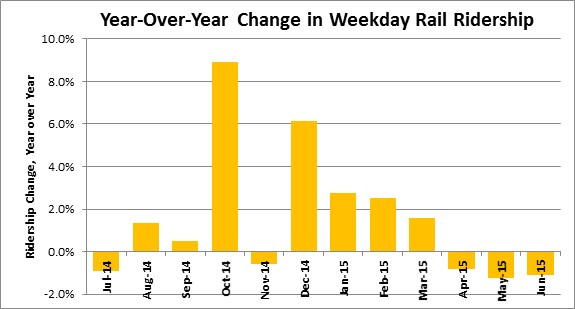
  • Weather impacts: see how the blizzard this past January lowered the average for the month as service was shut down.
  • Service changes: See how the opening of the Silver Line shifted riders from Orange to Silver in July-August 2014.
  • Land Use is key! Look at the recent growth rates at stations like Navy Yard and NoMa (formerly New York Ave.), reflecting the new jobs and residences near those stations.

Metrorail Ridership, by Station by Month, 2010-2015, Average Weekday (.xlsx, 120kb)

Metrorail Ridership, by Station by Month by Period, 2010-2015, Average Weekday (.xlsx, 630kb) (Added 3/30/2016)

Notes: these numbers are raw entries for an average weekday in the month, including snow days, excluding holidays when we did not run a weekday schedule.  The numbers are for trend analysis and will differ slightly from those we report in financial statements, which undergo additional data scrubbing and normalization.

What do trends you see?

Metrorail Ridership Data Download, October 2015

March 14th, 2016 10 comments

New data download features rail ridership by origin, destination, day of week, and quarter-hour intervals.

ridership_plots_subset

Subset of the visualization made by BioNrd aka Mike from our October 2014 data download data.

As you’ve probably noticed, it’s been a while since we’ve released a fresh batch of Metrorail ridership data.  Continuing the spirit of openness, we have recently uploaded data from October 2015 in CSV format.  (The number of rows is too great for Microsoft Excel).

This new dataset includes day of week data, so you can begin to investigate impacts of evolving workplace policies such as compressed work schedules.  You can also compare it to October 2014.

In the past, we have seen a lot of innovative analyses of the data we share.  Perhaps the best so far was a visualization of Metrorail station entries and exits by station by “BioNrd” aka “Mike.” What else can we learn from this dataset?


Right Underneath our Feet – How Planning, Zoning, and Development Influence Metrorail Ridership

January 12th, 2016 4 comments

Metrorail ridership is heavily-determined by station-area land use patterns, so attention to land use as a transportation strategy will be important to sustaining Metrorail’s long-term ridership growth.

There has been a tremendous amount of attention recently paid to Metrorail’s ridership trends.  While history tells us that the current ridership snapshot – which shows that ridership has essentially flatlined – is quite normal given the cyclic nature of ridership growth, Metro’s Office of Planning has been exploring why certain station areas and rail segments have seen ridership gains during the downturn, while other station areas and segments have seen losses.

Passenger Miles Traveled by Trip Origin at Each Metrorail Station, AM Pea, Full-Fare Riders with no Transit Benefits. One of the inputs from this study.

Passenger Miles Traveled by Trip Origin at Each Metrorail Station, AM Pea, Full-Fare Riders with no Transit Benefits. One of the inputs from this study.

The questions we sought answers to included, for instance:

  • Why is it that while system-wide ridership declined last year, we saw ridership gains at stations with lots of transit-oriented development, such as NoMA, Columbia Heights, and Navy Yard-Ballpark?
  • How much of an impact does transit-oriented development have on overall ridership, and can that impact be measured, both in terms of new ridership as well as in terms of net new farebox revenue?
  • With so many ways to get around – including walking and biking and Uber and Lyft – and gas prices at near historic lows, how does a Metorail trip compare to other ways of getting around in terms of overall competitiveness?
  • Does the location of a transit oriented development project matter in terms of how much ridership it generates?  Does that vary by the type of project (i.e. office, retail, residential, etc)

Read more…

Ask the Professors – How Local Land Use Decisions Impact Metrorail Ridership

August 24th, 2015 1 comment

This post is guest-written by Chao Liu, Hiro Iseki, and Gerrit Knaap, researchers from University of Maryland’s National Center for Smart Growth, who helped Metro develop our Land Use Ridership Model.

Even though Metro doesn’t control where new jobs and households locate in the region, these decisions are critical to the agency’s ridership and financial future. 

It is well known that the form and intensity of development in and near rail transit station areas can have measurable impacts on transit ridership.  For these reasons, transit oriented developments (TOD) generally feature high-density construction, mixed land uses, and bike and pedestrian friendly infrastructure.  But not all TODs are alike, and the effects of TOD on transit ridership are likely to depend on how well the station is connected both locally and regionally, whether the station is near the center or end of a transit corridor, and what kinds of jobs and household are located nearby.

To explore how different forms of development might impact ridership on the Washington Metrorail system, Dr. Hiroyuki Iseki and Dr. Chao Liu assisted Metro to develop a direct ridership model (DRM), called Metro’s Land Use Ridership Model.  A DRM uses statistical techniques to quantify the relationship between entries and exits at rail stations and land uses nearby.  This model can then be used to estimate the number of passengers who will access the station, by waking or biking, as a result of changes in land use features, transit service characteristics, and socio-demographics within the walkshed of any given station.

The direct ridership model includes a large number of variables for each station, including the density, diversity, and design of local environment; transit service and connectivity; job accessibility by auto and transit; walk score; the availability of parking; the demographics of nearby residents; the number and types of jobs nearby, and more.  The model was estimated for the AM Peak, Midday, PM Peak, and Evening travel periods.  The AM Peak model is best suited for estimating the increase in morning boardings that would result from locating more households near the station; the PM Peak model is best suited for estimating the increase in afternoon boardings that would result from locating more jobs near the station.

Pedicted AM Peak Entries per New HH

Map 1. Predicted AM Peak Entries per New Household

The impact of adding jobs and households near stations varies by station area.  Map 1 above, for example, shows the estimated entries per new household in the morning peak—that is, how many additional boardings would occur in the AM peak if one additional household was located in the walkshed of the station.  Stations shown by red dots gain more than 0.57 boardings per day, for each new household in the walk shed, while stations shown with green dots gain only about 0.20 boardings per day. As a concrete example, Rhode Island Row is a 274-unit, mixed-use, TOD project built on a WMATA site.  Situated along the busy Red Line, the project has long been considered as a prime location for new housing development.  According to the DRM model, adding 274 new households near the Rhode Island station would increase boardings by 144 passengers in the AM peak.  The same development at the New Carrollton station, however, would have added only 52 passengers.  This is because, compared to New Carrollton, the Rhode Island Avenue station has better job accessibility and more frequent transit service, and is thus likely to stimulate more transit ridership. Read more…

Metrorail Ridership – Back on Track

July 21st, 2015 Comments off

Metrorail ridership stabilized in FY 2015, and that’s exactly what we said would happen.

We’ve seen from previous posts that total Metorail ridership had been experiencing its cyclical swoon following the housing bust and economic collapse of 2008.  Despite the volatile market, system ridership stabilized over the last few years – this past year may mark the beginning of the next phase of Metrorail ridership growth.  In Fiscal Year 2015, average weekday Metrorail ridership grew by just over 1.5%.

Ridership

The biggest swing of course is the difference in October: in October of 2013, we experienced the ridership loss due to the prolonged Federal Government shutdown; that didn’t happen in October of 2014.  Another interesting difference is that in FY 2014 there were five snow days during the winter, compared to only two snow days during the winter of FY 2015.  So, even when discounting the October effect, ridership was still up slightly year over year – a good sign for Metro and the region that helps support its services! And of course, the new Silver Line stations are helping to drive growth as well.

Meanwhile, we are continuing to experience strong growth in Metrobus routes where we have executed operational innovations.  Metro stands ready to work with jurisdictions and replicate these successes elsewhere.

This isn’t the end of the story.  The region’s pipeline of transit oriented development is going to accelerate this ridership growth, and in the next post we’ll provide just one example by detailing the expected ridership impacts of the exciting new project proposed for Rhode Island Avenue.

Categories: Engage Tags: , ,

Metrorail Rider Incomes – A Closer Look

June 29th, 2015 5 comments

Salaries of actual riders are needed to paint a true picture of Metrorail ridership by line.

The Washington Post recently featured a series of images from the You Are Here project of the Social Computing Group at MIT showing Metrorail median income by line and station.  We were digging into it and realized it uses median household income within a half-mile radius, and not that of the actual riders’ households.  While we’ve mapped low-income riders before, we set out to answer the question, “What is the actual average income of Metrorail riders by line and station?”   Along the way, we developed this interactive data visualization.

dashboard

Screenshot of Metrorail rider income by station visualization. Click image for full interactive version.

The biggest overall difference between our work and that of the MIT group is higher  household incomes at end-of-line stations on the eastern side of the region.  These stations, while located in lower income areas, have large parking facilities that draw commuters from all over the region and beyond. Read more…

Going Up – Why the Construction Pipeline Means Higher Metrorail Ridership (Part Two)

April 7th, 2015 6 comments

In Part Two of this series, we forecast the impact of the region’s near-term development pipeline on Metrorail ridership, using the Land Use-Ridership model. The good news? Metrorail ridership is set to show big gains. The bad news? Your ride just got less roomy.

Just as we were putting the finishing touches on this post, we saw a flurry of news articles detailing the regional market forces that portend increased rail ridership. Millennials choosing not to drive, even as they grow up.  Office parks in far-flung places experiencing devaluations while Metrorail-adjacent areas capturing the lion’s share of new leases.  Marriott announcing that it will seek a transit-accessible location when it moves.  And even defense contractors coming to bat to argue for the economic benefits of the Purple Line. All of this free publicity set us up nicely for what we wanted to share with you – the first results of the Office of Planning’s Land Use-Ridership model as applied to near-term development projects.

The Near-Term Pipeline. Researchers at Jones Lang LaSalle have been compiling a list of actual development projects – under construction, or planned – near Metrorail stations, so that we can forecast the near-term capital needs for the system. A huge amount of development (over 105 million square feet!) is on the books for within a half-mile of a Metrorail station.

NearTermPipeline_Thumbnail

Map of near-term development projects near Metrorail, by building type (click for full image)

So, How Much Ridership? What impact will all of this have on Metrorail? We ran these projects through the Land Use-Ridership model, and what we found was both intuitive – and startling. Read more…

Going Up – Why the Construction Pipeline Means Higher Metrorail Ridership (Part One)

April 6th, 2015 5 comments

We’ve claimed that Transit-Oriented Development (TOD) projects in this region will be critical to Metrorail ridership and sustainability. The good news is that our assertions are grounded in statistically rigorous evaluations of TOD’s impact on Metrorail ridership – here’s how. (Part one of a two-part series).

While factors like fares, service, and the economy can certainly explain some changes in Metrorail ridership, one absolutely fundamental explanation of differences in walk ridership between stations is development.  Why does a station like Landover see only 50 riders arrive on foot each morning, and a station like Crystal City see over 3,000?  Why does a station like Bethesda see balanced ridership in all directions, where a station like Suitland is almost entirely one-direction? Development. Even a simple scatter plot shows that households alone near the station explain 70% of AM Peak walk ridership!

Planning studies have long-posited that transit-oriented development is such a key part of driving ridership, and if that is the case, then TOD is vitally important to Metro’s long-term financial sustainability.  We at Metro needed to quantify this link in a more sophisticated and system-specific way, and so we created a way to calculate the impact of land use changes (household growth, employment growth, new development) on ridership and revenue.

What is a Land Use-Ridership Model? To help, Metro’s Planning Office has built a Land Use-Ridership Model that will predict changes in Metrorail ridership as a result of occupancy changes (growth, decline, new development, etc.) in the station area.  This model helps us get very specific when it comes to modeling the impact of land use changes on ridership and revenue.  It helps us answer questions such as: “When developers build a new apartment building next to a Metrorail station how much ridership and revenue will Metro realize?”, and; “If an office building is proposed at one of four Metrorail stations, which location maximizes ridership and revenue without exacerbating core capacity constraints?”

LURM general flow

This tool is based on a rigorous understanding of the link between land use and the rail ridership we see today and is built on “direct ridership modeling techniques” found in academia.  It also focuses specifically on “walk ridership” (which constitutes 38% and 78% of our AM and PM peak ridership), since rides related to bus transfers, parking, and other access modes are less related to adjacent land uses.

To build this, we analyzed the actual quantity of walkable land uses from each station area, assembled detailed information about land uses and densities in those areas (households, jobs by industry type), and also controlled for other, non-land-use factors that shape ridership – like network accessibility. In all we worked through over 200 independent variables in our modeling and also brought in experts from the University of Maryland’s Center for Smart Growth, professors Hiroyuki Iseki, Ph.D. and Chao Liu, Ph.D., to bring their analytical and statistical firepower to the fray.

How We Built It. We defined the walkable area as a half-mile walk along a road network, so we account for barriers like highways and fences.  The half-mile cutoff is a bit longer than the median actual walk distance reported by our riders in the 2012 Metrorail Passenger Survey. For each station and its walk shed, we tested the following kinds of factors: Read more…

Metrorail Ridership Projections – Looking Ahead

March 11th, 2015 8 comments

Historical data and regional growth projections tell us one thing – Metrorail ridership will rebound and grow right along with the region, and the system better be ready to carry the load.

Crystal City Sta -am Rush 060912-129

Metrorail riders enter and exit Crystal City during the AM rush hour, June 2012.

Local ridership trends that seem to defy a national boom in public transit usage give some pause about the need for planned transit expansion projects.  It’s no surprise that even the most ardent of transit supporters might be caught flat-footed when trying to defend infrastructure investments against the backdrop of scarce funding.  Some have even gone so far as to question whether Metorail ridership, which just a few years ago looked poised to eclipse 800 thousand trips per average weekday, is experiencing more of a structural downshifting and may experience flat or even declining ridership for the foreseeable future.

All of this debate is understandable in a town obsessed with statistics and “horse race” leaderboards.  But when it comes to economics, demographics, mobility, and infrastructure, regional leaders need to look beyond the numbers d’jour and bet on a sure thing – Metro ridership will go up.  Here’s why:

1. Short-term snapshots of rail ridership miss the forest for the treesOr maybe even just leaves.

The graph below shows Metrorail average weekday ridership from the beginning of Metrorail. You can see that ridership grew in the first five years as the system grew from just the Red Line and four stops in 1976 to adding Orange and Blue Lines in operation by 1980. And after all of that expansion was completed, something fascinating took place – ridership declined and essentially flatlined until 1985. During that time, the region didn’t stop investing in Metro. On the contrary, during that same time period Metro built the Yellow Line and extended the Red Line from Downtown into Upper NW DC and then all the way to Shady Grove. Ridership shot up again in the late 1980s while Metro extended the Orange Line to Vienna and the Red Line to Wheaton then flat-lined and even declined through the mid 1990s, all while Metrorail added capacity on Yellow and Blue and (finally) opened up the Green Line. From 1997 through the late 2000s Metrorail saw robust ridership increases despite minimal capacity increases – largely reflective of the underlying economic and demographic resurgence of the central city and its urbane suburbs – and ridership flat-lined in tandem largely with the economic collapse of 2008 and the prolonged Great Recession.

ridership_chart_v2-01

Read more…

Veterans Day 2014 Metrorail Ridership

December 18th, 2014 2 comments

 Metrorail’s special Veterans Day schedule handily served commuters and concert goers alike.

On November 11, 2014, Metrorail served a reduced commuter market, as well as a large event on the National Mall, the Concert for Valor.  Metro ran a modified rail schedule, with near-peak service levels throughout most of the day, and Blue Line trains replaced with additional Yellow Line trains.

by Entry Time

Compared to a Typical Weekday:

  • Total ridership for the day was 515,000 trips, which is about 80% of a typical weekday
  • The AM Peak commute was roughly half of a typical weekday.

Compared to Veterans Day 2013:

  • Ridership was up by around 40%, or 147,000 trips.
  • Ridership at most stations was up by about 25-50%, while five stations serving the National Mall doubled and tripled last year’s numbers.
    • Federal Triangle and L’Enfant Plaza were over quadruple last year’s ridership
    • Ridership at Arlington Cemetery was down by half, coinciding with reduced service to that station.
    • The morning commute (until 9:30am) was up 13% over last Veterans Day, evenly across most stations. This is another sign that when the federal workforce, most impacted by the drop in the federal transit benefit, is (mostly) removed from Metrorail’s commute market, ridership is up.

Read more…