
Metrorail Usage Data to Inform Analysis of the Current Budget Proposal Regarding Early Closures
Data can help inform understanding of the potential impacts and mitigating strategies for potential changes to Metrorail’s span of service.
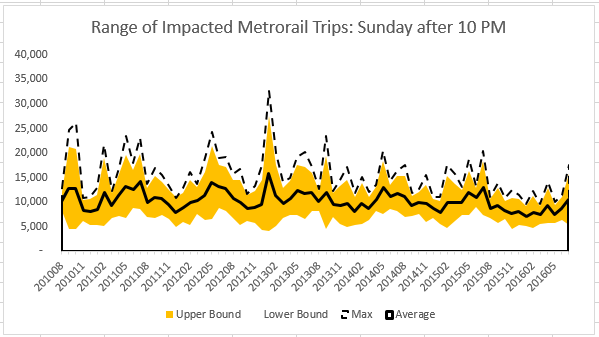
Metrorail ridership after 10 PM on Sundays, by month, since August 2010. The black line is the average, the yellow band is one standard deviation +/- average. The dashed line is the maximum.
In June of 2016, Metro began closing at midnight on weekend nights to allow more time for track work over the weekends, in support of the SafeTrack program. The Metro GM/CEO has recently announced he will pursue making this service change permanent. To meet the necessary track work requirements to get the system in a state of good repair – recommendations which the FTA and others have also made – the current budget proposal for FY 18 includes various additional early closure options, including ending Metrorail service at 10 PM on Sundays.
Staff from across the agency are currently working to assess the impact of such closures on customers and determine what strategies we might employ to replace some or all of that rail service with alternatives.
Similar to our data release related to SafeTrack, we are glad to provide ridership data to assist with analyses by our local partners and members of the transit advocacy community.
First, average, standard deviation and maximum ridership after midnight on Friday and Saturday, and after 10 PM on Sunday by month, station, and hour, from 2010 to 2016. (Excel, 13 MB) The graph above illustrates one dimension of this data: the average, usual range and maximum system ridership on Sundays by month since August 2010. The biggest spike there is during Obama’s second inauguration weekend. There is a lot to learn from this data set.
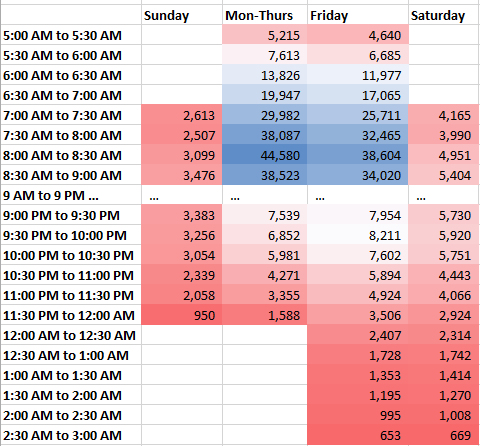
Secondly, we’ve put together Metrorail entries by half hour by day type. The full dataset is available for download, but the relevant data is presented in the image below, showing the half-hour segments that have the lowest ridership.
We have also assembled additional visualizations of ridership during the potentially impacted periods:
Late Night Ridership by Station
This visualization shows each station as a dot sized by total station traffic (entries + exits), with the color of the dot and data label indicating what percentage of the station traffic is exits. Majority exits are shown as blue, and majority entries render orange. The “quick filter” allows you to choose between Friday night, Saturday night or Sunday night.
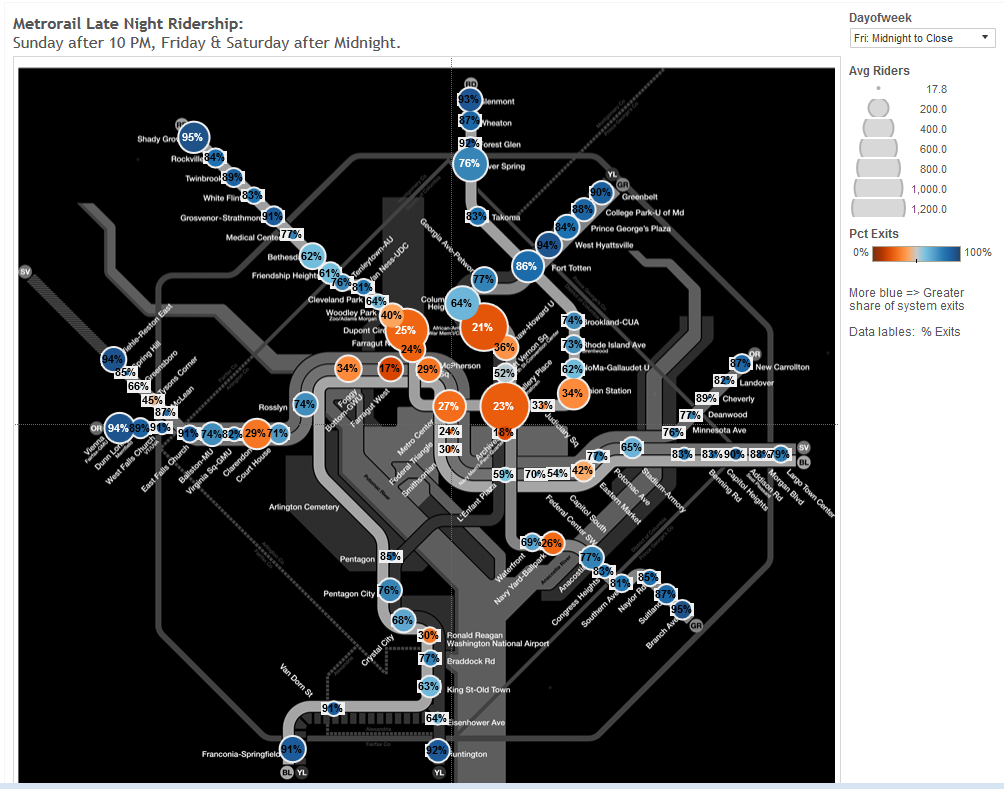
Late night ridership by station. Click for interactive version.
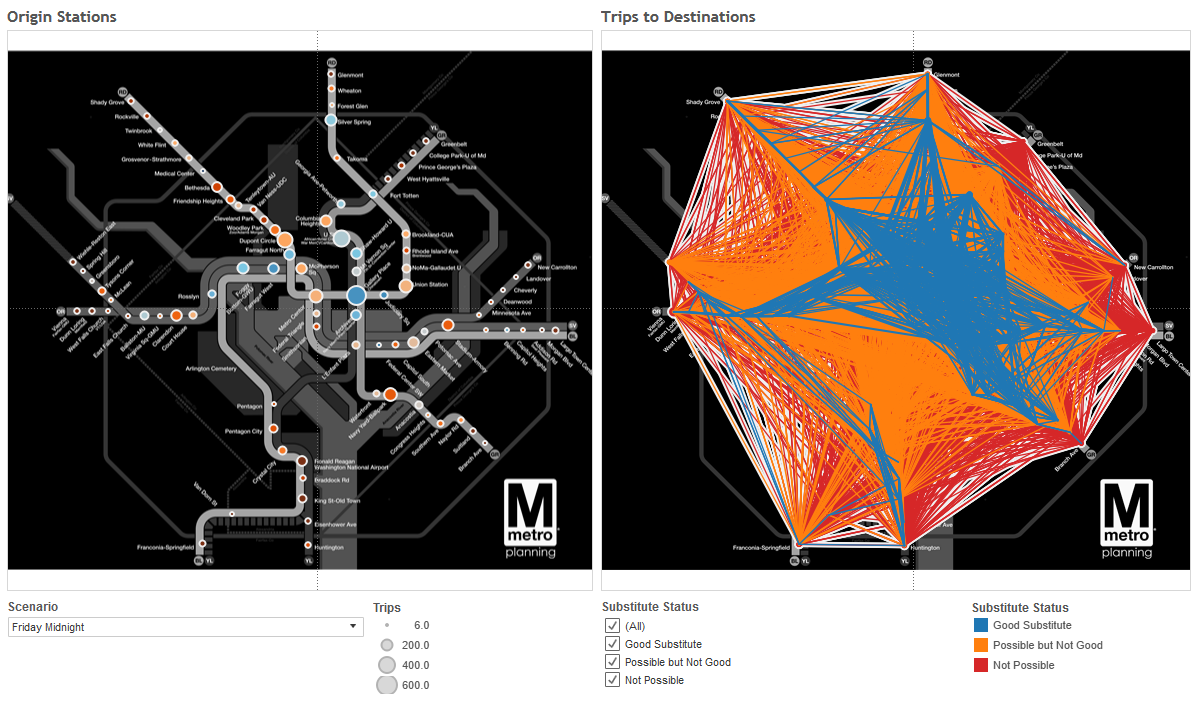
Interactive Late Night Origin/Destinations
This viz shows a map on the right panel illustrating station entries. Clicking one refreshes the map on the left to show where those riders go. You can choose between which day type and hour you want, and choose May or October from 2012 to 2016.
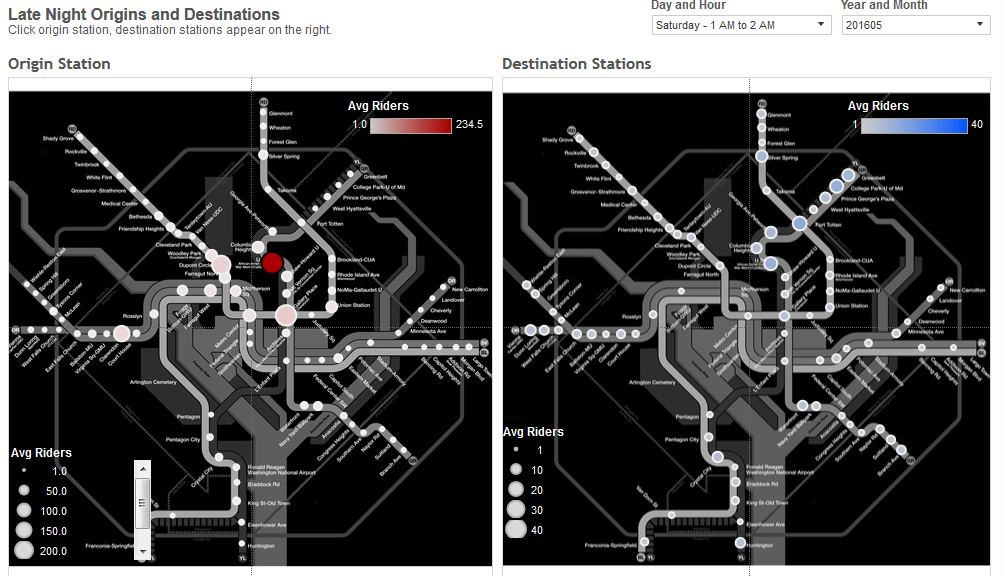
Late night origin/destination data. Click for interactive version.
Late Night Rail Link Loads
We used a mash-up of ridership data and historical train movements to create an illustration of the passenger load per link of the rail network per hour for the potentially impacted days and times. This data is from October 2015, and the viz allows you choose the hours for Saturday after midnight or Sunday after 10 PM. Metro planners have been using this visualization to assess how strong the demand would be for rail-replacement bus service. As such, a “buses per hour” field is provided as a filter: you can turn off low-demand links to see what a late night bus network would look like at different minimum frequencies.
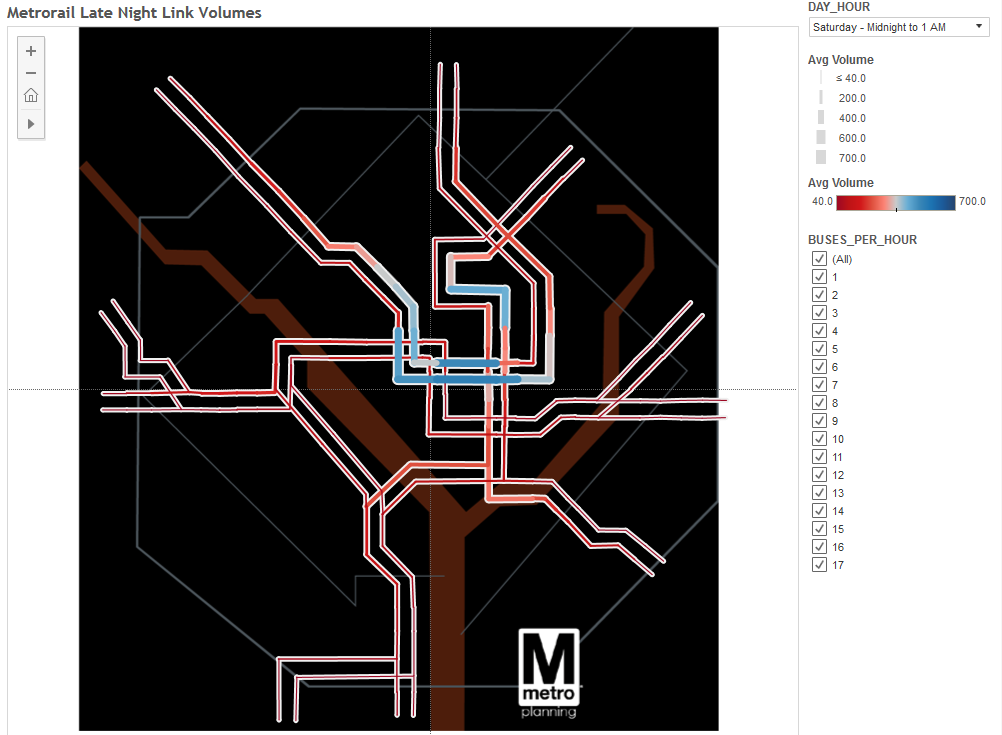
Late night rail link passenger loads. Click for interactive version.
Late Night Bus Substitutes
Finally, we ran our late-night origin-destination table through our trip planner to determine which trips could be provided by the current bus service at the same hour. We classified each potential trip into one of three groups. A “good substitute” is a one-seat ride with only 50% increase in travel time. “Possible but not good” is one with greater than 50% increase in travel time or that requires a bus-to-bus transfer. “Not possible” are trips that can’t be made on the bus network at the given hour. This assessment includes local bus services as well.
These visualizations and more are available on the PlanItMetro dashboard on the Tableau Public website.
Grab the data, use these viz tools, and see what you can learn from it. Let us know what you find in the comments.

Great data!
One of my largest concerns with the Sunday night early closures (and why I’m so adamantly opposed to them) is preserving the ability to get home after traveling for a weekend. Many weekends I am arriving back in DC by rail or airplane and depend on Metro to make it home. As the above map makes it clear, there are not any good alternatives from DCA or BWI into DC, or for those coming into Union Station to VA. I assume once the Silver Line Phase II is completed, the 5A will be discontinued, which would then add IAD to this list.
Looking at this data, I have to wonder if the solution is to trim Fri/Sat hours back until 2 AM, but otherwise maintain the pre-Safetrack schedule. Then simply have rotating line closures for 48 hour periods over the weekends to ensure there is enough time to maintain the system. Since Safetrack has been implemented, I’ve found weekend service to be vastly improved from pre-Safetrack (I’m on the red line) since I only have to deal with a disruption every few weeks, rather than grappling with single tracking every weekend.
@Ross
Yes, DCA is a transit desert if you turn off the rail network. Currently the 13Y provides weekend service from DCA to Union Station before the rail system opens. We would consider operating the 13Y during any hours during which we cut back rail service, with a frequency based on demand.