Archive for September, 2016

With Additional Price Points, SelectPass Sales Continues to Grow

September 29th, 2016 3 comments

Metro added an additional seven price points to SelectPass starting in August, and customers have started to take notice!

selectpass-sales-by-month-by-price-point

SelectPass sales by month in a stacked line graph, meaning total sales is the value of the upper-most line.

Perhaps you recall Metro is testing a new, custom-value pass.  Customers “select” their usual commute trip and then can purchase a monthly pass priced at 18 days of commute travel.  Since all months have more than 18 work days, this new pass offers regular customers a great deal.  The pass began with two price points ($2.25 and $3.75) and included rail-only and rail-bus options.

As you may have heard, Metro expanded the SelectPass pilot to 7 new price points on August 22, for September passes. And customers have responded.  As you can see in the graphic above, the base-fare pass sales for September exceeded their sales levels for July.  And instead of eating into sales of the base-fare pass, the new price points are adding additional pass sales.

A recent customer experience survey polled over four thousand current or former SelectPass customers, where we learned the following: Read more…

Categories: Engage Tags:

Biking and SafeTrack – Highlighting the Need for Bike Infrastructure

September 28th, 2016 Comments off

Transit and bikes go hand in hand. Not only can riders bike to and from stations for that first and last mile, but biking is a great way to get around when Metrorail is under maintenance.  It’s important that our policy makers understand the importance of having good bike infrastructure.

jim-at-howard-theater

Biking to historic Howard Theater (photo courtesy of APA’s Sam Schipani)

On Sunday, September 18th, I rode around DC with a bunch of planners from across the country in town for the American Planning Association’s (APA) annual Policy and Advocacy Conference.  This annual conference gears planners up to advocate for federal, state and local policies that advance good planning principles through the legislative process.   There are two days of training workshops and speaker sessions and an entire day of meetings on Capitol Hill, where planners meet with their representatives to discuss planning issues and their importance to creating strong communities.

One of the training sessions sponsored by the APA Virginia Young Planners Group (YPG) was a mobile workshop on bicycle infrastructure planning and the role of the bicycle as a viable transportation option.  I was there as a speaker to provide some background about bicycling as an alternative for riders trying to get around during our SafeTrack rebuilding program.  Two other speakers very familiar with the biking world here in DC were on the tour as well – Jim Sebastian, who manages DDOT’s Active Transportation Branch and is their chief bike planner responsible for most of the DC bicycling infrastructure that has come on-line in the last decade and helped make DC #4 in the country for bike commuting, and Doug Smith, WABA’s Everyday Bicycling Coordinator. Read more…

Bike and Pedestrian Infrastructure – Quantifying the Return on Investment

September 26th, 2016 Comments off

Sometimes small investments yield large returns. Building sidewalks and bike lanes to Metrorail stations increases safety and pays off two to one.

To close the loop on the last post that described our station area bike/ped project selection and evaluation process, we’ve posted the summary report online for your reading pleasure.   To skip right to the bottom line, though, we’ve been able to tie dollar amounts to certain project benefits and have calculated a total return on investment that’s nothing to sneeze at.   In short, we’ve estimated that a $13 M investment in some of the 394 top pedestrian projects leads to a $24M discounted revenue impact for Metro and its funders of the course of these projects’ useful life, a net positive benefit of $11M.  BAM!

MSIS Report Cover

In addition to the monetary returns, there are a number of other benefits that tend are challenging to quantify financially but have great value to customers and society at large.   For example:

  • New pathways shortens someone’s travel time, making Metro a more attractive option for the trip they are making;
  • New sidewalks may open up the station to an ADA customer who had to rely paratransit before to get to where s/he was going; and
  • New bike lanes provides a separation between both moving and parked cars, and the bicyclist, making her safer.

These projects are valuable indeed and the task before us (the royal ‘us’) is to ensure that they are built, thereby contributing to a more efficient use of the Metro system by maximizing the accessibility of stations.  So, let’s get cracking!

Since we collected projects from planning documents going back a few years, we anticipated that some of them might already have been built or might no longer work in the current context.  Therefore, we asked staff from our local transportation departments and planning agencies to help us “ground-truth” or update project status.  Out of the 394 top projects, we removed 194 that were already completed, no longer under consideration or that have already been funded, leaving 200 to focus on.

Not bad for a day’s work!

The summary report includes maps showing where the most-needed projects are located, as well as a “scorecard” detailing each project’s potential benefits as calculated in the prioritization process.  These include the safety measure defined by frequency of crashes proximate to the project, the potential ridership generated for certain projects, community facilities served, whether or not the project is located in a low income area (and, if so, how much of it falls in that area), the Walkscore, estimated cost, and a number of other useful indicators.

Read more…

Metrorail Usage Data to Inform Analysis of the Current Budget Proposal Regarding Early Closures

September 23rd, 2016 2 comments

Data can help inform understanding of the potential impacts and mitigating strategies for potential changes to Metrorail’s span of service.

sunday_night_trend

Metrorail ridership after 10 PM on Sundays, by month, since August 2010. The black line is the average, the yellow band is one standard deviation +/- average. The dashed line is the maximum.

In June of 2016, Metro began closing at midnight on weekend nights to allow more time for track work over the weekends, in support of the SafeTrack program.  The Metro GM/CEO has recently announced he will pursue making this service change permanent.  To meet the necessary track work requirements to get the system in a state of good repair – recommendations which the FTA and others have also made – the current budget proposal for FY 18 includes various additional early closure options, including ending Metrorail service at 10 PM on Sundays.

Staff from across the agency are currently working to assess the impact of such closures on customers and determine what strategies we might employ to replace some or all of that rail service with alternatives.

Similar to our data release related to SafeTrack, we are glad to provide ridership data to assist with analyses by our local partners and members of the transit advocacy community.

First, average, standard deviation and maximum ridership after midnight on Friday and Saturday, and after 10 PM on Sunday by month, station, and hour, from 2010 to 2016.  (Excel, 13 MB)  The graph above illustrates one dimension of this data:  the average, usual range and maximum system ridership on Sundays by month since August 2010.  The biggest spike there is during Obama’s second inauguration weekend.  There is a lot to learn from this data set.

Secondly, we’ve put together Metrorail entries by half hour by day type.  The full dataset is available for download, but the relevant data is presented in the image below, showing the half-hour segments that have the lowest ridership.

span_of_service_ridership

We have also assembled additional visualizations of ridership during the potentially impacted periods: Read more…

Try Out the New “Metrobus Explorer” Tool and Tell Us What You Think!

September 22nd, 2016 5 comments

We want your feedback on a new online tool, Metrobus Explorer, which allows visualization of Metrobus service frequency and geography.

One of the biggest challenges facing bus transit is making the service extremely easy to understand.  Metrorail stations are filled with customer information, including system maps, fare and travel time tables, station-ahead lists, and passenger information display systems (PIDS) screens, leaving little guesswork for the savvy traveler.  Moreover, with limited real estate available for customer information, Metrobus stops are often at a disadvantage.  While Metro continues to improve bus stops around the region — including the design and installation of new diagrammatic bus system maps — information technology is also playing an important role in filling the bus customer information gap, including BusETA, information displays, and trip planning sites and apps.

Metro’s Office of Planning is developing a new online tool called Metrobus Explorer that is geared to answer two questions about the Metrobus network:  “How often do buses arrive at a given stop (or set of stops), and where do they go from there?”

bus_stops_freq_spider

Screen shot of the bus frequency and spider map tool. Click the image to access the live tool online.

Read more…

Pledge to Go “Car Free” on September 22!

September 19th, 2016 Comments off

Planning to Walk, Bike, Telework or Take Metro on September 22?  Then take the pledge to go Car Free.

Car Free Day is this Thursday, September 22.  Any of us who live or work in the Washington region can pledge to go Car Free or “Car Lite” (meaning some access to a car or van pool) to help raise awareness  about alternative modes of travel relative to driving alone.  In addition to showing your support for a good cause, you might even win a prize.

Interest in Car Free Day is widespread, from folks who don’t even own cars (see our post from a few years ago) to folks who typically drive alone to work and may need a little encouragement to try something else.  Last year, more than 3,500 people pledged to go car free in the region.  About 38% said they would bike, 22% would take rail, and 17% said they would use a bus as their primary mode of transportation.  As with Bike to Work Day, events like Car Free Day can have a lasting impact beyond the one-day event by leading people to make changes in the ways they choose to get around.  So help bring up this year’s number of pledges by signing up today.

Metro to Continue Dialogue with App Development Community and Riders!

September 15th, 2016 2 comments

Metro Data Day 1 will bring together Metro staff, the app developer community, riders and advocates.

banner-draft

Metro has some great data feeds, and app developers — from Google and Apple to Metro Hero — are consuming them to provide great tools for transit riders in the Washington DC region.

That’s great news, and yet there are opportunities to do even more!  For example, we’d love to see app developers help customers plan an accessible trip – one that routes a user to station entrances where elevators are present.  And this isn’t likely the only unmet need from the Metro transit rider community. There are loads of great ways to make this data more useful to you.  That’s where you come in.  Read more…

Categories: Engage Tags: , , , ,

Tens of Thousands of Customers Relied on Metrobus During SafeTrack Surges 3 and 4

September 12th, 2016 Comments off

Surges 3 and 4 saw the highest shuttle bus ridership of SafeTrack so far. Overall, Metrobus shuttles moved around 17,000 trips per day during Surge 3, and around 25,000 trips per day during Surge 4.

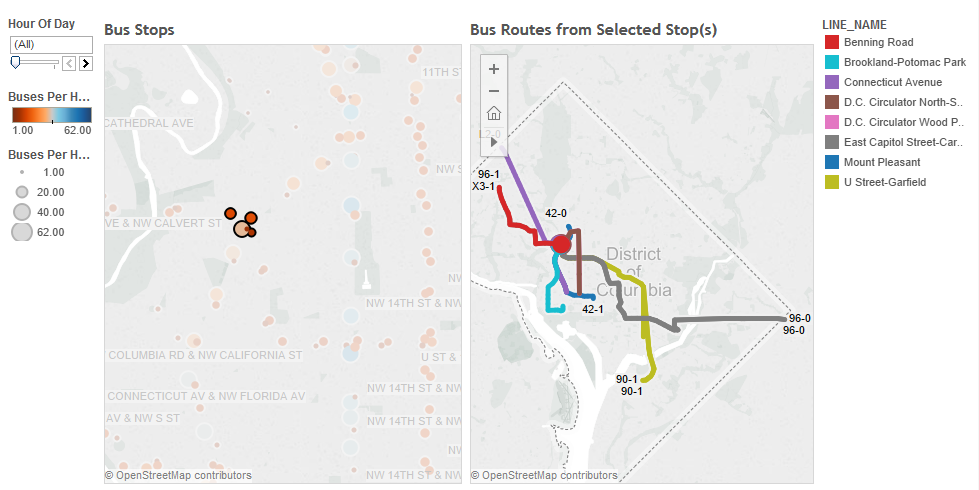
With shuttles every 2.5 minutes and Metroway running every 6 minutes, there were about 35 buses per hour during peak periods on Route 1. Taken together, the two services moved about 31,000 passengers per day during Surge 4. As a comparison, that stretch of road serves about 41,000 cars per day.

A small portion of shuttle bus ridership was on the Franconia to Pentagon shuttle, with the remainder on shuttles between Pentagon City, Braddock Road, Crystal City, and National Airport. The sheer volume of ridership on the shuttle buses made the shuttle operation Metro’s busiest bus line, albeit temporarily. At 25,000 trips per day, the shuttles moved more riders than we typically move on any other major bus route, including some of the busiest like 16th Street NW, or the various 30’s buses.

Not all rail customers chose to use the shuttles.

Some riders, especially those traveling locally, switched to other bus routes. Ridership on the Metroway premium bus service more than doubled compared to June, and during Surge 4, it nearly tripled compared to the same period last year! Ridership on the 10A was up 29-64%, and 11Y ridership was up 128-133%, or more than double. Metrobus added service on all of these alternative lines, and Metroway did not charge fares during the Surges. We will be monitoring future ridership to see if any customers decide to remain with Metroway after the surges end.

Overall bus ridership on other lines in the Surge area was up 1%.

These first SafeTrack surges highlight one of bus’ key attributes as a mode: flexibility.

Metrobus has supported the SafeTrack work by moving tens of thousands of passengers along corridors that don’t normally see that level of demand for bus service, in different locations every couple of weeks. There’s been plenty of work behind the scenes to make that happen:

  • The planning and scheduling team has worked out which routes the buses should take, which bus bays they should use at the stations, what time the buses need to leave the garages, and more.
  • Our customer facilities team has ensured there were signs up at all the stops and stations pointing the way to bus service.
  • The bus maintenance team has kept all the buses for SafeTrack up and running.
  • The street operations staff have answered passengers’ questions and worked with the Bus Operations Communications Center and the bus operators to make sure everything ran smoothly.
  • Bus operators have learned new routes in a very short amount of time and safely taken tens of thousands of passengers where they needed to go.

Usually, Metrobus makes service changes only about once a quarter, since passengers count on the consistency and reliability of our service. But when it’s needed, bus service can be very nimble, allowing it to support the important maintenance work being done during SafeTrack.

Did you ride Metroway or the shuttles during Surge 3 or 4? What did you think? What other opportunities are there to capitalize on the flexibility of bus service?

Studies on Dedicated Funding for Metro – If We Had a Nickel…

September 7th, 2016 3 comments

The region has entered its 30th year of discussion about funding Metro.

Rail Rehab Costs 86 Study

Projected rail structure maintenance costs from the 1986 FCC study.

There has been a lot of talk recently and even more sound bites about the need for more consistent, reliable, and dedicated funding for Metro. But while it may seem like an innovative topic, discussions about Metro’s funding challenges and the need for a dedicated funding stream for Metro have been going on for … decades.  This has been an identified problem and heavily-studied topic since at least 1986 – the year the Oprah Winfrey Show debuted, Top Gun was the highest grossing film, and Ferris Bueller took a day off.

Truth be told, scores of very smart people have expended time and effort and resources to articulate the problems, accurately predict the consequences of inaction, and suggest solutions suitable (and necessary) for implementation.  So when you read “news” about Metro’s funding challenges, the problems it creates, and potential fixes – remember that what you are reading is hardly “new”.  And no refrain is older than the “it’s not the right time”, to which we must remind the reader that for three decades, it hasn’t been “the right time”.  How’s that working out, anyway?

Below are a few of the studies and reports generated on Metro’s funding challenges and possible solutions to closing the funding gap:

Studying – check. So now what? Read more…