
Introducing S.W.A.R.M. – Another Tool For Your TOD Toolkit
A new tool helps estimate ridership and revenue from transit-oriented development projects near Metrorail stations. Download it for yourself!
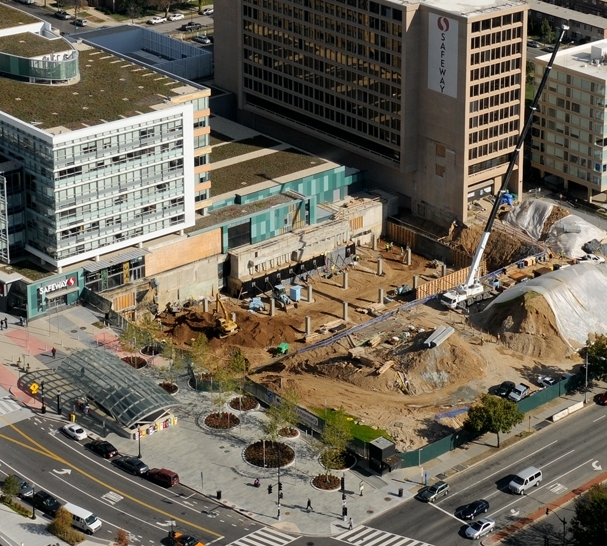
For months we have been detailing our work that quantifies the relationship between land use and rail ridership. This is important because Metrorail has been experiencing large changes in ridership, and we were interesting interested in understanding why certain station areas – like Navy Yard and NoMa – were showing ridership gains while the system as a whole is experiencing losses in the long arc of ridership growth.
To get to the bottom of this, we worked with researchers from the University of Maryland’s National Center for Smart Growth to analyze how walk ridership at a Metrorail station relates to its surrounding land uses, and create a tool that accurately estimates the likely change in ridership from changes in land uses. This tool, the Station Walk Area Ridership Model (or S.W.A.R.M., for short), helps us estimate the potential impacts of land use changes – new households, new jobs (by type of employment!), and even changes in the station’s walkshed – on ridership and revenue to Metrorail.
No reason to keep this tool all to ourselves, so we are making an easy-to-use and Excel-based version of the tool (WMATA SWARM Model 3.1, 2.2 MB) available to the public here. Using it is fairly intuitive – you simply enter the anticipated change in households and employment in the station area (by rough distance from the station) into the appropriate columns and rows, refresh the PivotTables, and then scroll over to see how these changes impact ridership and system revenue. You might be surprised to see how powerful land use changes can be to attracting ridership and stabilizing Metro’s finances through farebox revenue!
A few notes before you get started:
- This model is calibrated to the WMATA rail system, and is not suitable for extrapolation to other transit systems or the bus network. We may choose to expand this to Metrobus at some point in the future – stay tuned.
- We are estimating direct walk ridership only here – the current model does not calculate changes due to park and ride, bus connections, etc.
- Outputs from the model reveal the average ridership increase resultant from a change in adjacent land uses. Some developments will perform better than this model would predict, others worse. There’s a high, midpoint, and low estimate to give a range of estimates and show uncertainty. The midpoint estimate also steps through a change in network accessibility to see if the land use change would add value to the network and attract additional ridership.
- We have ground-truthed the model outputs against changes to Metrorail ridership that occurred due to past land use changes, we believe that the model is conservative if anything. Actual ridership observed from TOD projects are often higher than what it predicts.
- The model is based on land use and ridership data from 2014.
We’re happy to provide you with some level of answers to your questions as you explore this tool, and hope that it is useful for a variety of purposes! How might YOU use this in your TOD Toolkit?

So this would seem to argue for WMATA advocating for higher density development around its rail stations.