
We Heard You! MyTripTime Provides Personalized Information On Your Metrorail Trips
Starting Wednesday, July 27th, Metrorail customers can see their own, personal on-time score for trips that they’ve taken over the past 90 days by logging into the SmarTrip website.
Metro has a long history of reporting system-wide performance via our quarterly Vital Signs reports. However, our customers often say that this information doesn’t resonate with their own experience because it averages things out across all operating hours and all stations.
Customers: we heard you! MyTripTime reports your own, personal on-time score based on every trip that you’ve taken over the past 90 days.
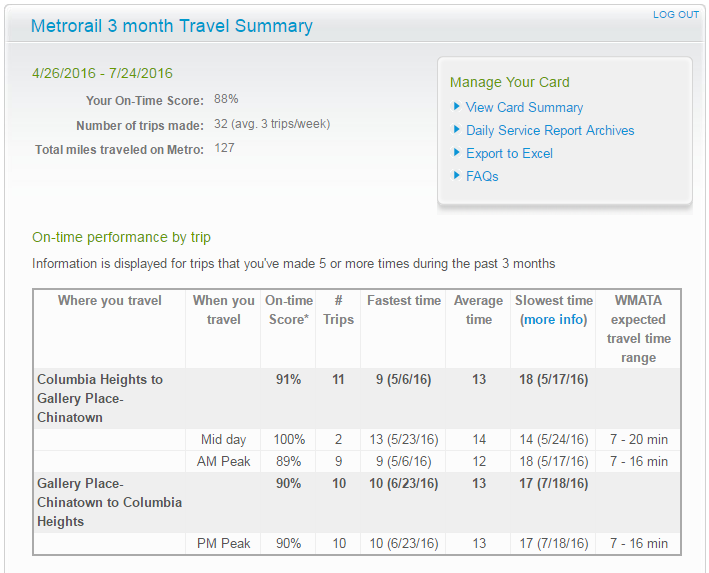
Screenshot of MyTripTime, from smartrip.wmata.com
MyTripTime works by first calculating how long it actually took you to get from Station A to B, from the time you tap-in to the time you tap-out. Then, we compare this to how long it should take under normal operating conditions. If it takes you longer, you are late. Every trip taken over the last 90 days is rated as on-time or late. Your score reports the percentage of all trips that were on-time. Additional details, like fastest, average and slowest times are provided for trips that you frequently make. Hopefully this information can help you track the impact of our SafeTrack rebuilding efforts on your own travel, and hold Metro accountable for doing better.
So, how long should a trip actually take? Imagine your journey. You tap-in, walk from the fare gate to the platform (probably using an escalator or elevator), wait on the platform for a train, ride the train, exit and walk from the platform to the fare gate. The “WMATA expected travel time range” estimates how long each of these steps should take. It includes how long it takes trains to travel between stations (this is usually the information you see in Metro’s trip planner, based on our scheduled run times) and standard wait times. We also add in about a minute each at the origin and destination stations (2-3 at our larger stations) to allow time to travel between the platform and the fare gates. While this is enough time for most customers, those of you who routinely use the elevator may take a little more time for this leg of the journey–and as a result may be “late” more often.
The low end of our “expected travel time range” is basically the “perfect trip”: you enter a station just as your train is pulling up, don’t have to wait, and experience no other delays along the way. We also assume that you are a speed walker (please, for safety’s sake, don’t run!) and spend minimal time going from the fare gate to the platform and vice versa. Basically, your travel time equals the time you spend on the train. The high end of the range assumes that you just miss a train and that you take the full minute or two allotted to walk between the fare gates and platform. The high end is what we use to determine if you are late.
My own MyTripTime is pretty good: 88 percent overall, 90 percent for my commute between Gallery Place and Columbia Heights (I mostly b. Over the last 90 days, I haven’t had the “perfect trip” but came pretty close a few times.
What’s your MyTripTime? Log onto the SmarTrip site to find out.

Wow, this is actually really helpful. Much easier to gauge how long a trip takes and how long I should plan for then the TripPlanner. Broken down by peak/not-peak was also a great idea.
The miles don’t count for FitBit do they? :)
I’m at 58% over 73 trips. Yikes, that’s bad. Have you used this data to create average on-time performance for certain lines at certain times of day?
@SM
Good suggestion! The Vital Signs report (check out the link in the post) reports monthly customer OTP by line in the tables in the back of the report.
@Jordan
First, why is rail OTP the only vital sign without a target in the Q1 scorecard?
Second, from reading the definitions, it appears on-time performance measured using headways (as opposed to scheduled trains). This is an FTA criticism dating back to AT LEAST 1997. For example, the 1997 FTA SSO audit report (FTA-MA-90-9005-97-1) at 17 stated:
WMATA does not utilize on-time performance as an indicator of system health.
[ . . . ] In its place, WMATA has traditionally utilized headways (the interval of time
between trains), which, while sound for bus systems where “bunching” is an issue,
fails to account for deterioration in running speed and other potential problems on rail
systems.
@WRD
Hi WRD,
The new rail OTP measure (the one without the target) is the percentage of customers who were on-time (it aggregates across all customers the information used to produce MyTripTime). We will set a target for this after we have a few more months worth of data (we only started measuring this beginning Jan 2016). We also report on headway adherence in the Vital Signs report (see the tables in the back).
@Jordan
So full disclosure, I’m on the internet and obviously don’t know what I’m talking about. However, in reading your response, specifically your first sentence in your second paragraph, it seems that you ARE using headways as a key performance indicator. Which the safety regulator says is not appropriate.
On that basis, I think you might have ignored my second point. It appears the FTA says headway is not an appropriate measure of rail on-time performance. Contrary to the regulator’s position, WMATA uses headway as the OTP metric.
Perhaps I misunderstand how OTP is calculated, and if so, please correct me! Yet, if I’m correct, this is a problem.
You can’t disagree with your regulator. (I work in finance. Trust me, we’ve tried and it doesn’t work)
I checked MTA in New York. They measure rail on-time performance without headway.
Here’s their exact definition:
The percent of trains making all the scheduled station stops arriving at the destination terminal on-time, early or no more than five minutes late. Trains re-routed, abandoned or operating under temporary schedule changes are all counted as late.