Archive for June, 2016

SafeTrack’s Surge 2 Bus Shuttle Proves Bus Rapid Transit Can Work Here

June 28th, 2016 Comments off

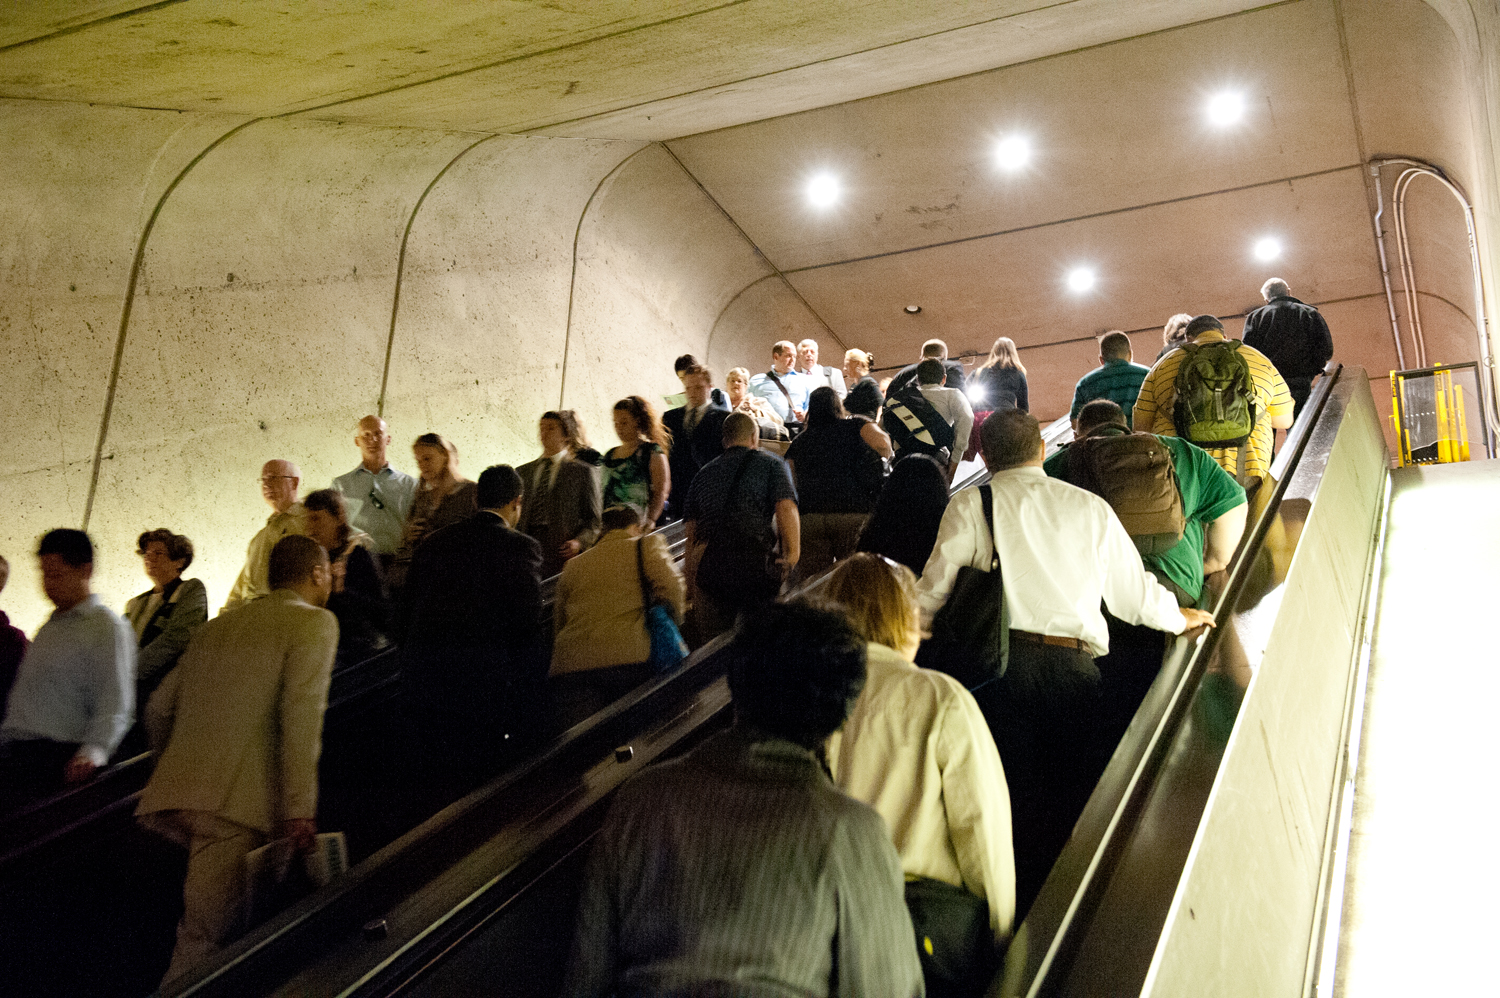
The shuttle buses at Eastern Market during Surge 2 are arriving every two minutes at rush hour, and are moving nearly the same number of people as 3 lanes of Pennsylvania Avenue SE.  This shows how much we can achieve by giving buses priority – lanes, signal priority, and more – on busy streets. 

27234765704_310d840f17_k

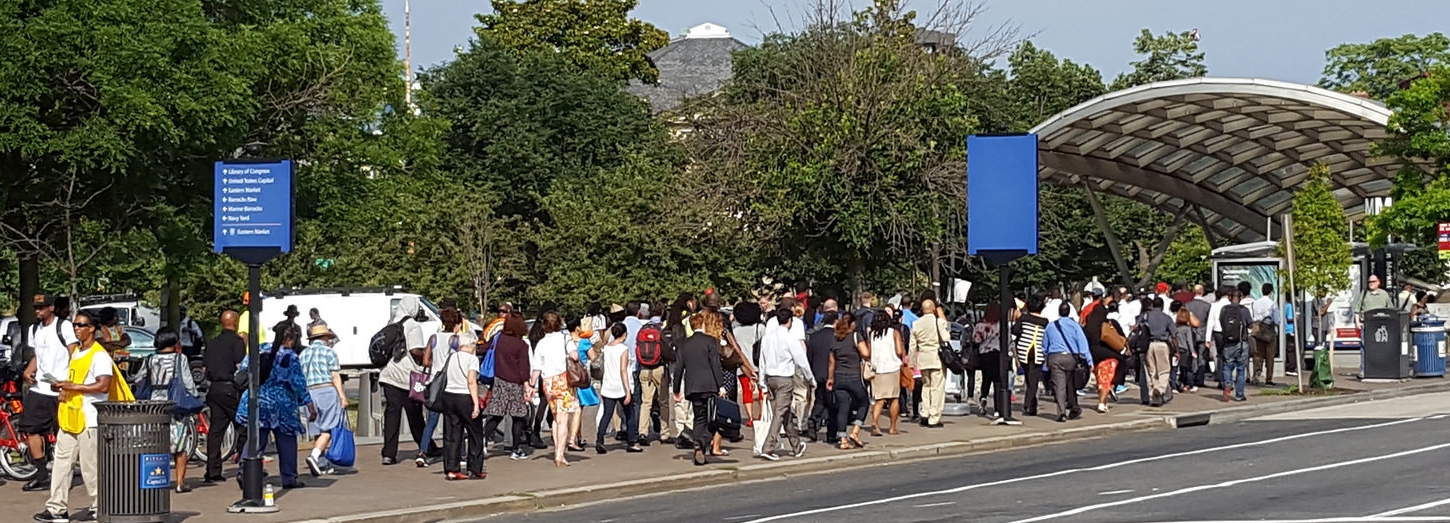
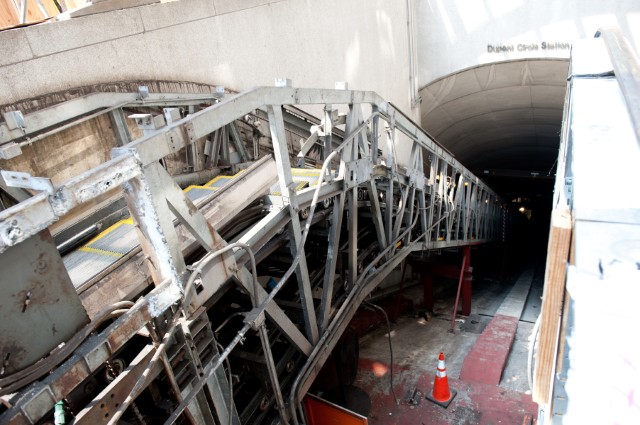
Commuters transferring from shuttle buses Eastern Market station (photo by author)

For the last week, Metrobus has been operating bus shuttles between Eastern Market and Minnesota Avenue and Benning Road, to provide alternatives around SafeTrack Surge 2 while we rebuild tracks and infrastructure on that segment of Metrorail.  While still moving less than half the the riders as what Metrorail normally moves, the shuttles are moving an impressive number of people:

  • In the morning rush hours, buses are arriving at Eastern Market every 2 minutes on average
  • Shuttle buses are delivering 1,800 people per hour to Eastern Market between 8:00 and 9:00am.  This is about the same as the number of vehicles that 3 lanes of Pennsylvania Ave. SE typically moves (1,500-2,000 vehicles per hour per direction, according to TPB Regional Transportation Data Clearinghouse).
  • Around 16,000-17,000 people per day are riding the shuttles, or about two-thirds of the number of vehicles driven through the corridor in a day (25,000 average annual daily traffic)
  • Traffic Control Officers from DDOT are critical to this operation, ensuring that everyone moves safely and efficiently

Read more…

Growth Mode or Stuck in Neutral? Or Both?

June 27th, 2016 2 comments

Population and jobs are up, but regional travel is down – Why? The very nature of trip-making may be changing in this region.

Crystal City Sta -am Rush 060912-129For several years, we have been reporting internally and externally about declines in Metrorail ridership. Our most recent rail ridership numbers show continued patterns of ridership levels that are five to eight percent below its 2009 peak, and despite gains in March, the trend in April and May suggests that the ridership patterns that we are seeing now are more structural than cyclical.  The implication here is that Metrorail may be operating at a “new normal” level that is still poised for growth, but growing from a baseline that has been reset at a lower level.

Theories abound about why this is taking place – telework and rail reliability are among the most talked-about culprits – but it’s almost impossible to isolate one cause among many in a time period that also witnessed fare increases, gas prices drop to historically low levels, and wild variations in the Federal transit benefit.

Now we have new information that may present a compelling theory about the declines in Metrorail ridership – the region is making fewer and fewer tripsData recently released by our Transportation Planning Board depicts a startling story of this region’s travel patterns over the last decade or so.  This data tell us that despite economic factors that would normally portend increased trip-making – rising population, household, and employment growth – this region is actually seeing fewer trips overall, regardless of mode. Read more…

Shared Mobility – Complementing Public Transit in the Nation’s Capital

June 27th, 2016 6 comments

In the DC region, shared mobility (Uber, Lyft, etc.) are actually complementary to the transit network. Here’s why we see opportunities to consider even better system integration.

“Transportation Network Companies” – you know them as Uber, Lyft and a host of other brands – are now part of the urban transportation landscape. Some have suggested that the rise of their popularity contributes to ridership decline on Metrorail and still others have heralded their emergence as the end of transit as we know it.  Always focused on investigating trends and proliferating fact rather than folklore, we wanted to know the truth.  Should Metro be nervous?  Are customized trips like these going to put traditional bus and rail out of business?

Unlikely.

Research (PDF) published by the American Public Transit Association and Transportation Research Board – and which I had the pleasure of helping to oversee –  tells us that customers of ridesourcing tend to use the services when transit is less available as well as to get to destinations not easily served by traditional transit.  Furthermore, we learned that in the DC region especially, these TNCs tend to function as informal “Metrorail shuttles” – almost two thirds of Uber trips in the District begin or end at a Metrorail station, and slightly more than a third of Uber trips follow that pattern when we zoom out to the entire region.  Similar statistics prevail when examining the usage of car sharing companies such as Zipcar and Enterprise.  Finally, the data indicates that 57% of frequent users of ridesourcing companies as well as car- and bike-sharing customers identified bus and rail transit as their preferred transportation mode.  This tells us that these services have an important role in complementing the Metro rail system for many customers.Source: Lyft Read more…

New Metrobus schedules begin this Sunday

June 23rd, 2016 Comments off

On Sunday, June 26, service changes will take effect on Metrobus routes across the region.

Bus%20Gallery%20Place%20041816-5908[1]These adjustments aim to improve system reliability, route simplicity, and customer service. The bulk of this service change impacts bus routes in Virginia. Check below to see if your routes will be affected and look up upcoming timetables here.

DC: 42, 52, 53, 54, 60, 79, D1, E2, E4, G2, L2, N2, N3, N4, N6, A2, A6, A8, A42, A46, A48, D3, D4, G8, P6, V1, V2, V4, X1, X3, X9

MD: B29, B31, J11, J12, J13, K11, K12, R12, V14

VA: 1A, 1B, 1C, 1E, 1Z, 2B, 3T, 4A, 4B, 9A, 10A, 10B, 10E, 10R, 10S, 15M, 17M, 18E, 18J, 18P, 21A, 21D, 23A, 23B, 23T, 28X, 29K

ICYMI: What Makes a World Class Metro – Lessons from Peers @ Metro Summit

June 22nd, 2016 Comments off

Metro turned 40 this year. Regional leaders are looking to ahead to what Metro could be in the next 40 years.

artworks-000155909567-uxkbs7-t500x500
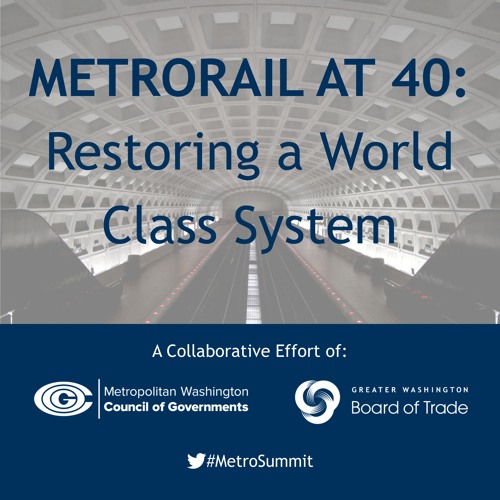
On Monday, June 13th, the Metropolitan Washington Council of Governments (COG) and the Greater Washington Board of Trade (BOT) convened a second Metro Summit to discuss opportunities and lessons learned from peer systems across North America. One hundred elected and business officials from across the region gathered at the Mayflower Hotel to discuss funding and governance structures with the leaders of Toronto, Miami, Atlanta, Chicago, and New York’s transit agencies. Additionally, Alex Barron, the Head of Metro Benchmarking, Railway and Transport Strategy Centre, Imperial College London, provided context on what attributes define a world class metro. (pdf)

Audio of the entire proceedings is also available. Information on the first Metro Summit, which was held on March 30, 2016 and discussed funding, safety, development around Metro stations, and governance is also available by audio.


Categories: Engage Tags:

What’s the “Word” on SelectPass

June 20th, 2016 7 comments

Customers are saying great things about SelectPass, Metro’s new unlimited monthly pass program.

SelectPassWordCloud

Word Cloud representing what SelectPass customers have said about the new pass program. Click for a larger version.

This post was submitted by Metro’s Director of Customer Research.

Metro’s limited time offer SelectPass has early adopters talking. In April, Metro sought to provide new payment methods by introducing SelectPass—a multi-tiered pass option allowing customers to ride as much as they want on Metrorail (and Metrobus).  Currently two price points are available. Read more…

Late Night Bus Maps and Options

June 15th, 2016 2 comments

Updated 7/6/2016

Now that Metrorail closes at midnight on weekends, what buses are available? New regional bus maps can help you find alternatives to Metrorail after midnight.

Since the launch of the SafeTrack program, rush-hour alternatives have been a hot topic across the region, especially for commuters impacted by the rail surges. However, it’s also important to address navigation strategies for people impacted by Metrorail’s earlier weekend closing time — midnight rather than 3:00 A.M. on Friday and Saturday nights (technically early Saturday and Sunday mornings). While nightlife patrons are part of the mix, most of our late-night rail customers are traveling to or from work. Since teleworking may not always be an option for these commuters, night owls should be aware of the bus options available after midnight.

We’ve assembled bus service availability, by hour, on weekends from Metrobus and our regional partners, and put the data on maps!

To see individual route labels, click on a map to expand.

Detailed timetable information is available from Metrobus, Fairfax Connector, Ride On, ART, and DC Circulator. Some bus service differs slightly between the two weekend days; you can plan a specific trip in Metro’s Trip Planner.

Note: Metrobus map data is based on information from the Late Night Service Study published in April 2016 and may not reflect recent service changes on certain bus routes. We will follow up next week with any updates.

Updated 7/6/2016: Map graphics have been revised to reflect current service patterns.

More maps below the fold:  Read more…

Rail Car Crowding and SafeTrack – Potential Customer Impacts Analysis Released

June 13th, 2016 1 comment

We have developed a customer impact analysis that shows how and where customers may be impacted in the SafeTrack safety surges, to help guide regional partners plan mitigation and alternatives

you_down_with_PPCThe first SafeTrack project began on June 4, meaning that Monday, June 6th, was the first day with peak-period service disruptions.  This first safety surge is to accommodate the track improvement project planned for the Orange and Silver lines between East Falls Church and Ballston.  With only one track available for revenue service, we are cutting back to just over 3 trains per hour on each line through the work zone.  When service levels decrease without a decrease in demand, we see an increase in passenger loading on rail cars.  We measure that with a metric called passengers per car, or PPC.

Our rail cars are designed to comfortably transport around 100 passengers each, with most sitting and a few customers standing.  After special events (or any given weekday on some lines) we often find rail cars with much higher passenger loads. From a planning perspective, an average PPC of greater than 120 is considered crowded.  Also, we know that customers don’t evenly distribute themselves across rail cars, so an average PPC of 120 means some cars are much more crowded. Read more…

Categories: Engage Tags: , , , ,

Off-Peak Fare Discounts and their Behavioral Implications

June 8th, 2016 4 comments

Metrorail riders facing a high percentage off-peak discount are motivated to delay their travel and save.

This post is guest-written by Sam Winward, a behavioral economist and Metrorail commuter who lives and works in the District. His analysis of Metro ridership patterns sheds light on the influence of off-peak pricing.

If you’ve ever waited a few extra minutes before swiping through a Metrorail faregate to qualify for the off-peak fare, you’re not alone. Within the afternoon peak / off-peak cusp period, when riders may be somewhat time flexible, Metrorail data from AprilMay 2015 confirms that some riders are delaying entry for savings.

What riders probably don’t know, is that their off-peak pricing discount could be substantially different from the riders around them. In fact, off-peak percent discounts can range from a 19% to 40% reduction of peak fares. Given the varying degree of off-peak incentive, riders are responding as we’d expect when weighing their opportunity cost of time.

As percent savings increase, riders are more likely to delay travel for off-peak fares. The graph below, derived from WMATA data, displays this ridership tendency.

Note the ridership uptick just after 7 pm. This runs counter to the natural pattern of declining ridership over this period, and the uptick steepens as the percent discount facing riders increases.

Exhibit 1_Ridership Uptick

So why is there so much variation in off-peak discounts, and who are the lucky riders allowed large savings?

Particular trips, based on mileage between origin / destination stations, are subject to off-peak fare “caps.” WMATA introduced the caps in 2012 when off-peak fares switched to incremental fee-per-mile pricing. Off-peak fares for trips of just under 7 and 10 miles were capped, as these trip distances would have otherwise seen very large increases between the old and new fare structure. A maximum off-peak fare cap of $3.60 was also implemented, affecting riders with trips lengths greater than 11 miles.

The effects of these fare caps remain in the system today, and are not mirrored in peak fares.

As displayed below, the gap between peak and off-peak fares increases over regions subject to off-peak fare caps. This makes off-peak travel more enticing for riders’ whose trip length falls within a green zone.

Exhibit 2_Fares

Notably, small tweaks in the fare structure have large behavioral effects.

Even if you decide that added off-peak savings aren’t worth the wait, at least your decision can be informed. To see the off-peak discount applicable to your route, and how it compares to the rest, check out the interactive off-peak discount calculator on my website.

The full story, including the off-peak discount calculator and a formal analysis of the delayed ridership patterns, can be found at Sam’s site.

WMATA Begins a New Capital Needs Inventory

June 6th, 2016 1 comment

Restoring Metro’s reliability and quality requires a comprehensive approach to asset management and reinvestment.

dupont_escalator_replacement

Capital needs include escalator replacement, as pictured here.

In April, Metro staff commenced the important work of updating its Capital Needs Inventory (CNI), a financially unconstrained prioritized plan of capital needs that documents Metro’s infrastructure, vehicle, facility, technology, and system capacity investment needs over an immediate to 10-year horizon, and provides input to the development of the six-year Capital Improvement Plan (CIP).  This document, which itemizes and prioritizes the capital investment needs of the entire Authority over a ten-year period, not only informs our jurisdictional partners about funding needs, but is now also a component of the federally required Transit Asset Management Plans outlined in MAP-21.  Importantly, Metro’s CNI effort is occurring at a critical time both for the Authority and within the transit industry. Concurrent with recent asset-related failures on Metro’s rail system, international standards for asset management (ISO 55000) and Federal Transit Administration (FTA) proposed rules have recently been published that can help guide the methodology and tools used to develop a best-in-class CNI.

Have we done this before?

Awareness of the need to focus on the maintenance and renewal of Metro’s capital assets has existed since the system opened, but a comprehensive approach to long-term planning for the funding and management of capital assets has been lacking for much of Metro’s history. In the early years of Metrorail operations, the focus of funding campaigns was on construction of the full system. Toward the late 1990s, as the 103-mile rail system neared completion, efforts began to quantify capital improvement needs and to increase the size of the capital improvement program budget. Some key milestones during that period included: Read more…

Categories: Engage Tags: , , , ,